The Climate Action Monitor is a key publication of the International Programme for Action on Climate (IPAC). It provides a synthesis of climate action and progress towards net-zero targets for 51 OECD and OECD partner countries. This year's edition presents a summary of information on greenhouse gas emissions, an assessment of climate-related hazards and recent trends in climate action. Directed towards policymakers and practitioners, the findings suggest that without increased ambition and a significant expansion in national climate action, countries will not be able to meet the net-zero challenge.
The Climate Action Monitor 2023
Providing Information to Monitor Progress Towards Net-Zero
The Climate Action Monitor
Abstract
Executive Summary
Climate impacts are rapidly intensifying and expanding
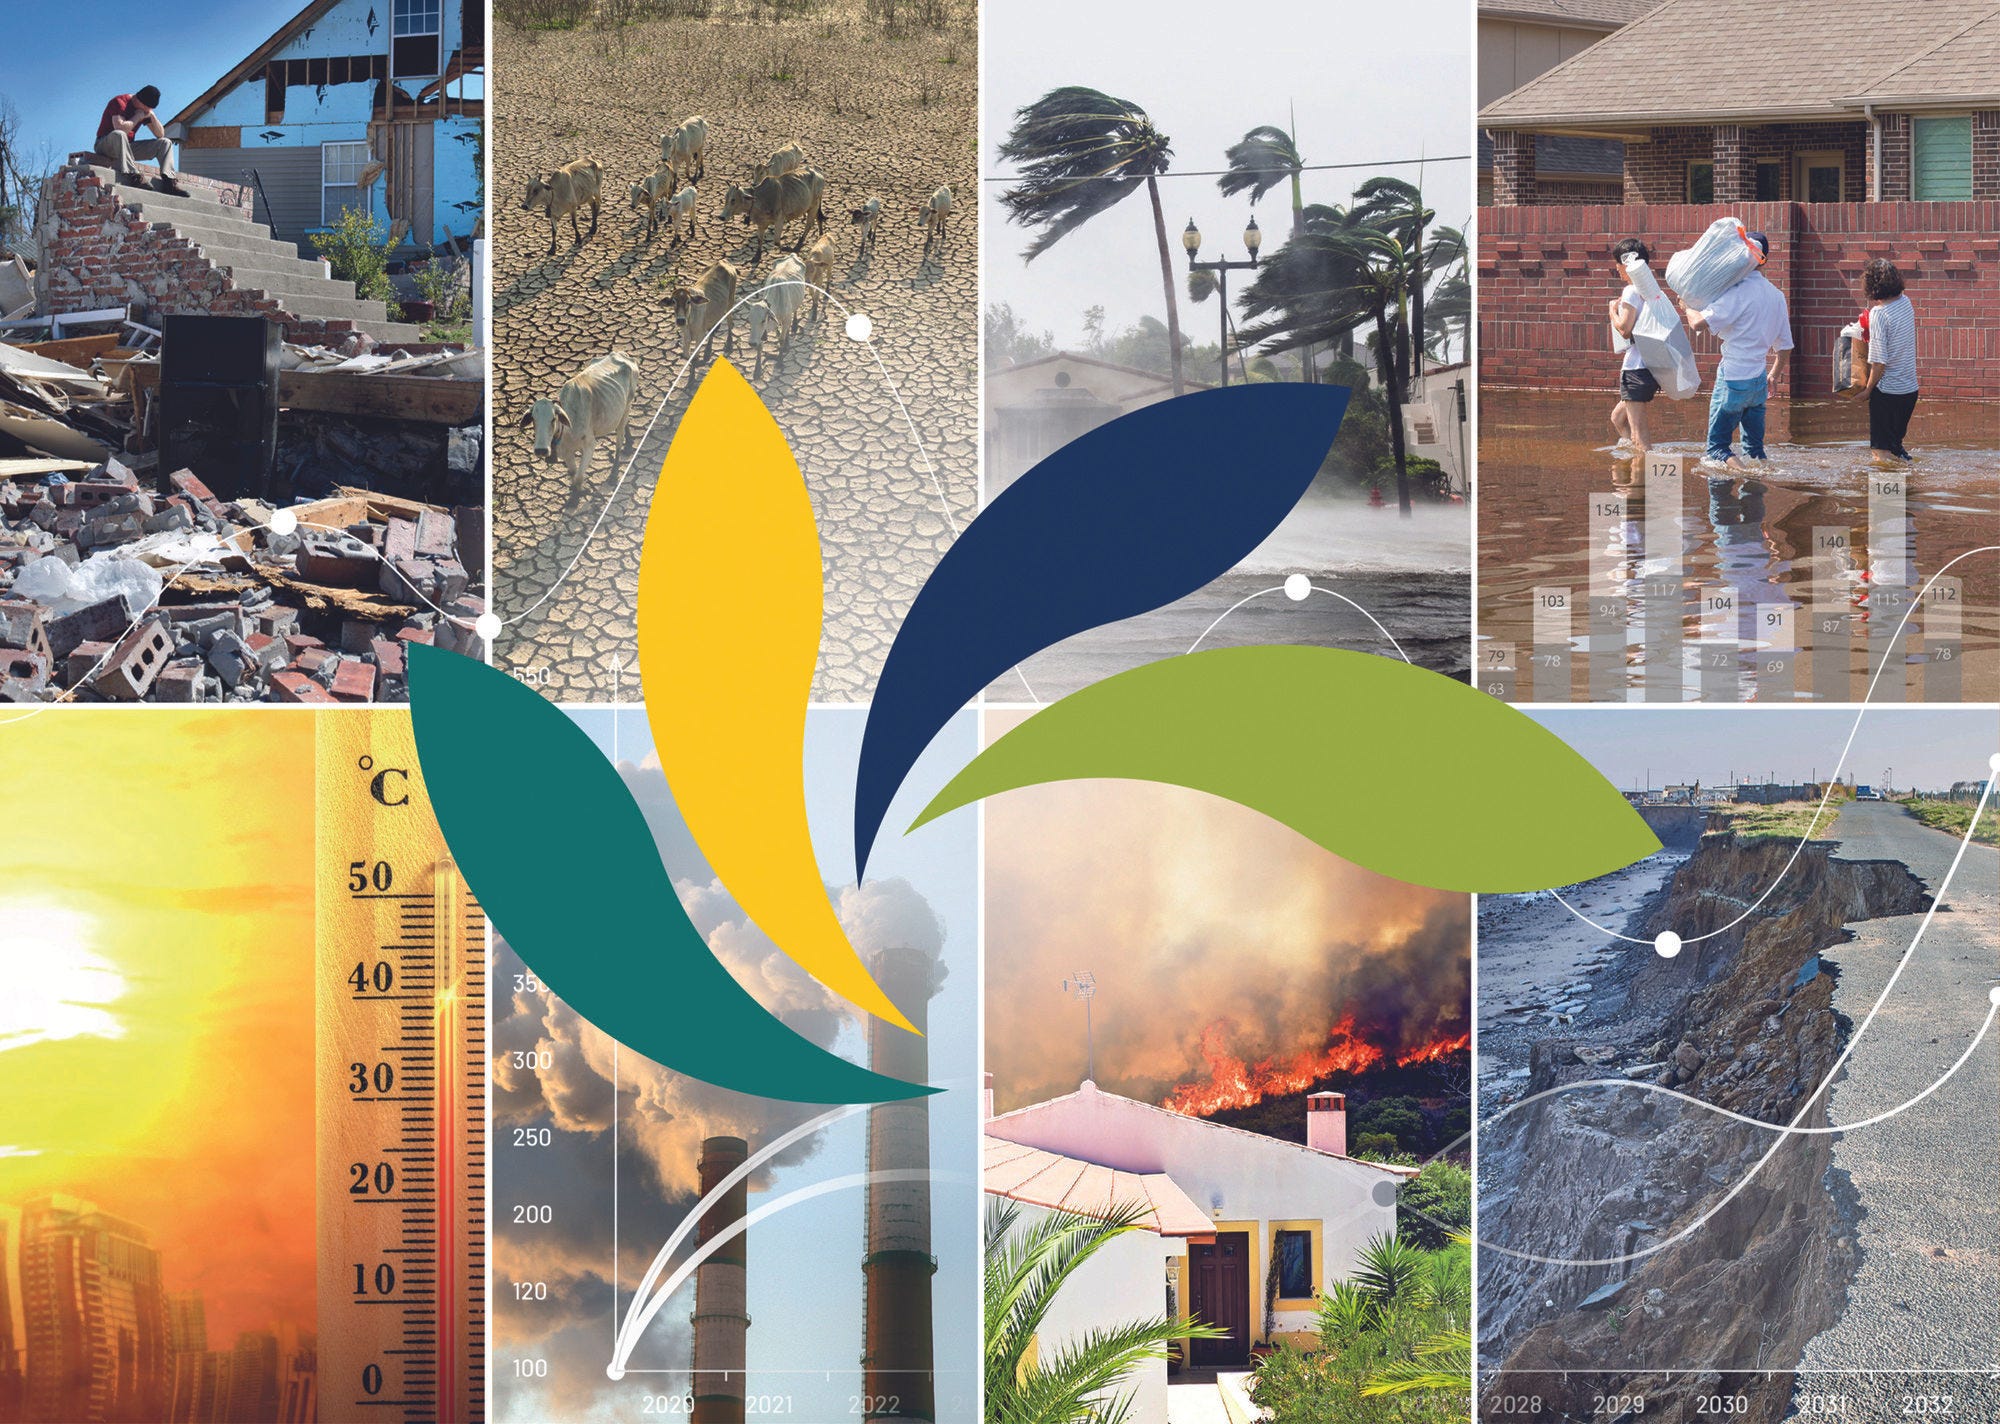
In 2023, the impacts of climate change have been dramatic worldwide. This year, the Earth experienced the hottest three-month period on record, with unprecedented surface temperatures and extreme weather events. Heatwaves, wildfires, floods, and hurricanes have raged across the globe, destroying lives and livelihoods.
Accelerating and unprecedented climate impacts are confirmed by OECD data. Systematic data on the evolution of climate-related hazards from countries covered under the International Programme for Action on Climate (IPAC), considering both OECD and OECD partner countries (including accession countries), confirm that climate impacts are accelerating and becoming even more extreme, exposing a greater share of the world’s population and land surface area. The 2023 climate-related extreme events are consistent with long-term trends.
The population exposed to extreme temperatures is growing rapidly. An estimated 11.3% more people are exposed to days with maximum temperatures exceeding 35°C in OECD and OECD partner countries in the period 2018-22 compared to the reference period 1981-2010, reaching over half a billion people. As a result, in 2022, over 45% of the population in OECD and OECD partner countries experienced at least two weeks of extreme temperatures. Temperatures recorded this year attest to the continuation of this trend, which not only has direct impacts but can also intensify hazards such as hurricanes, heatwaves, droughts, and extreme rainfall, affecting vulnerable populations, ecosystems, and economic infrastructure.
Population exposure to tropical nights (above 20°C at night) is increasing. Twenty countries — out of 51 OECD and partner countries — experienced a 10% increase in the population exposed to tropical nights over the period 2018-22 compared to 1981-2010. Korea (28%), Italy (18%) and Greece (16%) had the highest increase in population exposed to more than eight weeks of tropical nights.
Agricultural droughts in OECD and partner countries are intensifying. Countries such as Argentina, Brazil and Romania have experienced an average fall in soil moisture of more than 6% in the last four decades (period comparison average 2018-2022 compared to 1981-2010). These drought conditions can be even more acute at the sub-national level and during specific seasons, generating additional social and economic impacts.
Wildfires have been raging at unprecedented scales with a record-breaking land area burnt this year. An increasing area of forest land is exposed to wildfires across the OECD and partner countries. Between 2000-2003 and 2019-2022, the percentage of forest exposed to wildfires increased from 15% to 18%.
Increasing mean temperatures alter rainfall patterns affecting agricultural production and increasing vulnerability. Six out of the ten countries across OECD and OECD partners whose cropland area is the most exposed to extreme precipitation events are also highly dependent on agriculture as a share of GDP. For example, the countries with the highest share of cropland are exposed to extreme precipitation events between 2018 and 2022 included Indonesia (31.6%), Colombia (13.2%), Costa Rica (9.8%), Peru (8%) and Brazil (3.3%). This illustrates how climate change also threatens national and global food security.
Many countries are exposed to river and coastal flooding. Flooding events in 2023 were devastating and are likely to continue. Over 18% of the population of OECD and partner countries are exposed to the risk of river flooding. For some countries this can be as high as 40%. Similarly, over 2.6% of the population in OECD and partner countries are exposed to the risk of coastal flooding.
There is progress but more ambition and efforts are needed to achieve carbon neutrality by 2050
The Paris Agreement has been instrumental in increasing climate mitigation ambitions. 196 Parties have communicated their GHG mitigation commitments through NDCs and, as of September 2023, 105 countries have pledged a net-zero target, with 90 aiming to reach this target by 2050. Most targets are not legally binding, however. Net-zero targets cover about 83% of global GHG emissions, only 26 countries and the EU, representing 16% of global GHG emissions, have enshrined these into law.
NDCs’ mitigation commitments fall below those need to meet Paris Agreement targets. The IPCC estimates that a global GHG emissions reduction of 43% by 2030 (from 2019) is necessary to be on track to achieve the Paris Agreement goal of limiting temperature to 1.5°C by the end of this century. However, OECD countries have committed to an estimated emissions reduction of 28% and OECD partner countries to an emissions reduction of 5% compared to their 2020 emissions. OECD and OECD partner countries need to increase their emissions reduction targets by, at least, an additional 30% in aggregate to achieve the projected reductions estimated by the IPCC necessary to reach the Paris Agreement goal and fill the “ambition gap”.
The number of adopted national climate policies, tracked by the OECD, slowed in 2022
The growth rate of national climate actions adopted by both OECD and OECD partner countries only increased by 1% in 2022. By contrast, the average growth of adopted policies between 2000 and 2021 was 10%, as tracked by the IPAC Climate Actions and Policies Measurement Framework (CAPMF).
Policy coverage and policy stringency are not necessarily indicative of policy effectiveness in reducing GHG emissions. However, the slowdown in 2022 may pose a risk to countries’ policy implementation. Countries still have multiple options to increase the stringency of existing policies or adopt new policies that are currently not widely used (e.g., carbon pricing in the building and transport sector, bans and phase-outs of fossil fuel extraction or fossil-based infrastructure).
The overall slowdown of climate action masks significant differences across countries and instrument types. For example, 22 OECD and 8 OECD partner countries – jointly accounting for 29% of global GHG emissions – intensified climate action in 2022. This increase was driven principally by new or enhanced net-zero pledges, strengthened regulatory measures, higher prices in most emissions trading schemes and small advances in international climate co-operation and international climate finance. The energy crisis provided further impetus for countries to adopt more ambitious targets on renewables and energy efficiency and to accelerate implementation.
Geopolitical and macroeconomic shocks, however, led some governments to backtrack on climate action. The energy crisis delayed or postponed planned climate actions such as carbon pricing and the phase-out of fossil fuel infrastructure. At the same time, countries ramped up fossil fuel support to new record levels, reaching over USD 1 trillion (1000 billion) in 2022. Some countries, notably in Europe, significantly reduced public expenditure for research, development and demonstration (RD&D) for low‑carbon technologies.
Climate action is increasingly diverging across countries. Most OECD countries already had stronger policies in place and were able to accelerate climate action faster than OECD partner countries. Diverging climate action reinforces the need for more international co-ordination and co-operation on climate action. Otherwise, diverging climate action may increase risks of carbon leakage, therefore limiting the overall effectiveness of increased climate action.
The expansion of market-based instruments (MBIs) was substantially lower than that of other instrument types between 2000 and 2022, implying a continuous decrease of MBIs’ relative importance in countries’ policy mixes. Despite their potential to incentivise cost-effective emissions reductions, few countries strengthened MBIs, such as carbon pricing. While countries face challenges to implementing carbon pricing due to lack of public acceptability, proper design, such as revenue recycling, can boost public support for such schemes.
Looking ahead
Making progress towards the net-zero challenge demands ambitious mitigation targets and effective implementation, as well as navigating the policy landscape. It is crucial that climate policies are inclusive and cognisant of social and economic impacts. Countries will have to adapt their policies to ensure a just transition and that vulnerable households and communities are not disproportionately affected. Without identifying and understanding the full impact of these trends and events, it is difficult to assess the final impact of climate policy on mitigation outcomes.
The OECD horizontal project Net Zero+ explores how governments can build climate and economic resilience. IPAC is one of the project’s components and considers these and other key challenges including skills shortages, the supply of critical minerals and other potential bottlenecks to a rapid and resilient net-zero transition.