Rising uncertainties and geo-political tensions, together with more complex trade relations have increased the demand for data and tools to monitor global trade in a timely manner. At the same time, advances in Big Data Analytics and access to a huge quantity of alternative data – outside the realm of official statistics – have opened new avenues to monitor trade. These data can help identify bottlenecks and disruptions in real time but need to be cleaned and validated.
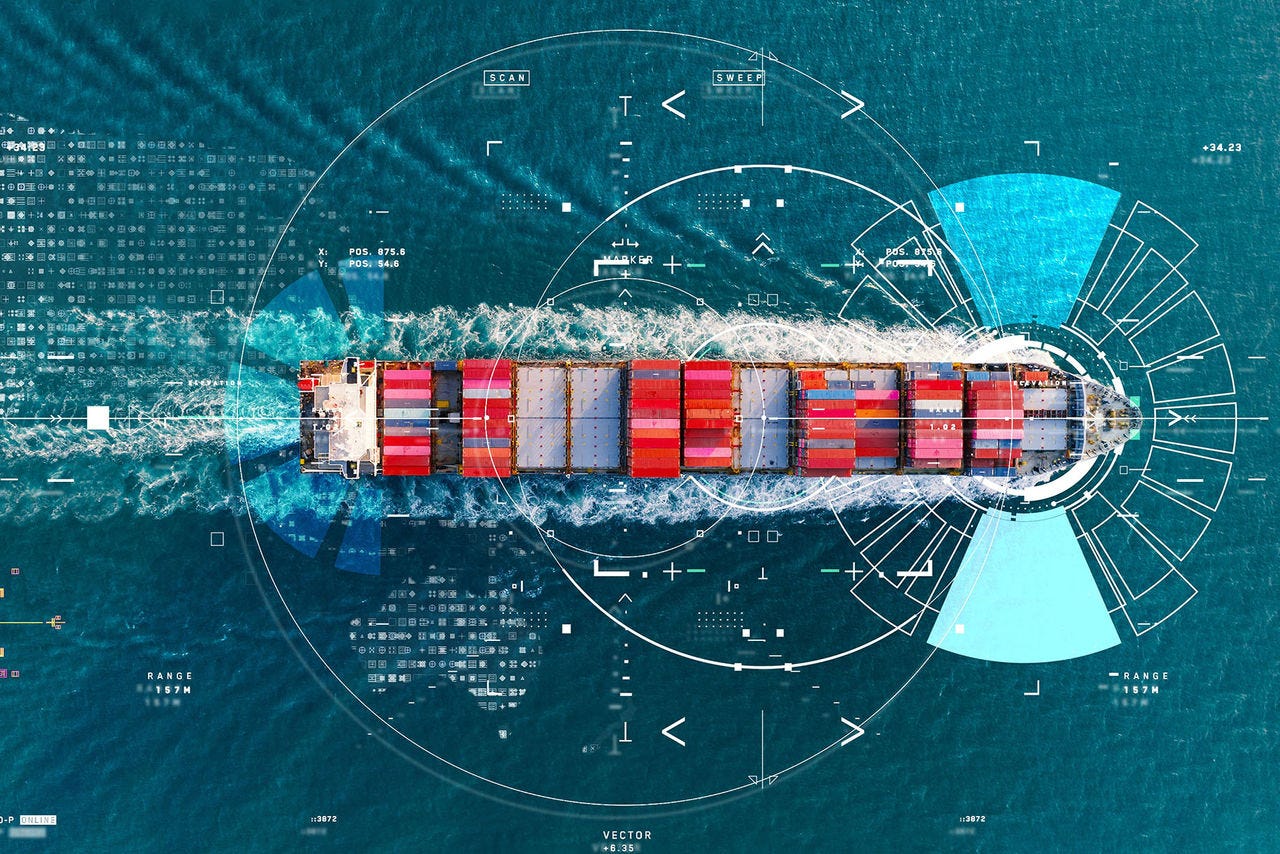
One such alternative data source is the Automatic Identification System (AIS), developed by the International Maritime Organisation, facilitating the tracking of vessels across the globe. The system includes messages transmitted by ships to land or satellite receivers, available in quasi real time. While it was primarily designed to ensure vessel safety, this data is particularly well suited for providing insights on trade developments, as over 80% in volume of international merchandise trade is carried by sea. Furthermore, AIS data holds granular vessel information and detailed location data, which combined with other data sources can enable the identification of activity at a port (or even berth) level, by vessel type or by the jurisdiction of vessel ownership.
New work from the OECD Statistics and Data Directorate contributes to existing research in this field in two major ways. First, it proposes a new methodology to identify ports, at a higher level of precision than in past research. Second, it builds indicators to monitor port congestion and trends in maritime trade flows and provides a tool to get detailed information and better understand those flows.
This new OECD AIS Tracking Dashboard visualises key indicators on ports and maritime trade. Indicators still need to be refined, by complementing the AIS database with additional data sources, but already provide a useful source of information to monitor trade, at the country and global levels.


