Africa's cities are especially vulnerable to the effects of climate change. Flooding, heatwaves, landslides, and extreme climate events mean that building resilient and sustainable urban spaces, and preserving ecosystems and biodiversity is critical. MAPTA-Climate combines innovative spatial data on green spaces, pollution, street networks, and urban forms for nearly 7 200 urban agglomerations with 10 000 inhabitants and above in 54 countries. This data can help policy makers better plan and guide more sustainable and resilient urban development.
Mapping Territorial Transformations in Africa (MAPTA)
Africa is undergoing enormous territorial transformations driven by factors such as climate change, rapid urbanisation and a growing population. The Mapping territorial transformations in Africa (MAPTA) platform provides data and analyses to help policy makers design more effective and integrated development policies. MAPTA focuses on the three key challenges: climate change, security and gender equality issues.
Climate
Green spaces
Green spaces deliver indispensable ecosystem services, from pollution control to the cooling effects and fostering biodiversity. However, the availability of green space is not enough, proximity matters. People need to live close to these green spaces to benefit from their cooling effects. Data is essential to help define targeted strategies to preserve and leverage green spaces in the face of rapid urbanisation and climate change.
To see our interactive maps and data: https://mapping-africa-transformations.org/climate/
Urban form
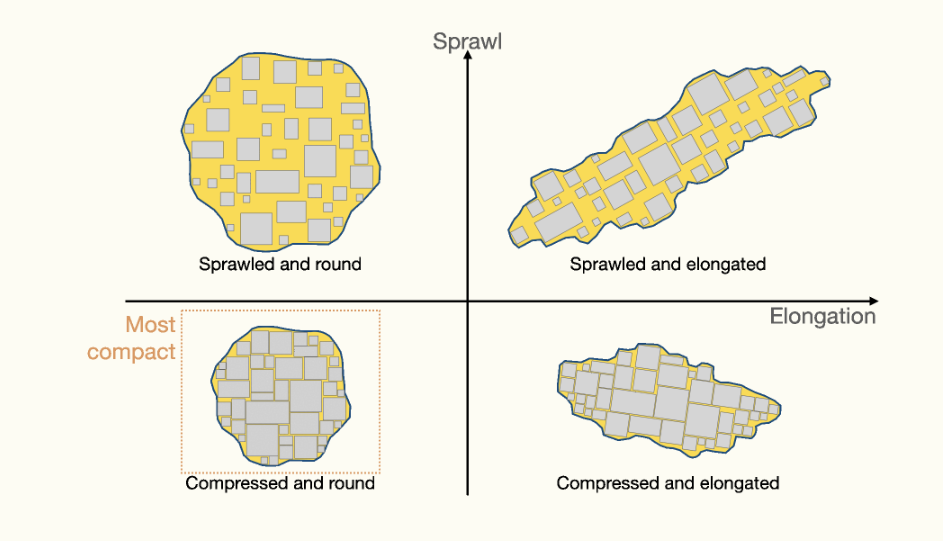
African cities are important places to focus climate action. They are considered “extremely at risk” by the Climate Change Vulnerability Index and therefore need data and decision-making tools. In a context of rapid urbanisation, better planning towards a more sustainable, compact urban form is critical. More compact cities ensure better access to services, reduced travel distances, lower energy consumption by vehicles, and therefore, less emissions and pollution. To measure compactness, SWAC/OECD developed two indicators: sprawl and elongation. Sprawl measures the amount of space between buildings and elongation measures the tendency of the buildings to form a circle - the most compact urban form. Check out MAPTA-Climate to discover the diversity of African urban forms.
To see our interactive maps and data: https://mapping-africa-transformations.org/climate-urbanform/

Mobility
Urban mobility is a major challenge for African cities. In many cities, the transport system has failed to keep up with urban growth, falling short of meeting residents’ travel needs. In Accra and Kumasi in Ghana, basic services such as markets, healthcare facilities and primary schools are inaccessible for many people. This has led to increasing car ownership, higher emissions, pollution, and congestion. Decision makers in Accra and Kumasi are reflecting on redesigning the transport system for more liveable cities. To support this work, SWAC/OECD provides new data and evidence to help inform sustainable solutions that enhance the quality of life, economic opportunities, and social inclusion of city residents while mitigating environmental impact.
To see our interactive maps and data: https://issuu.com/swac-oecd/docs/ghana_brochure

Proportion of trips by transport modes across income groups in Acrra and Kumasi
Gender
The SWAC/OECD provides data and analyses on violence involving women in West Africa spanning the last two decades. Sourced from the Armed Conflict Location & Event Data Project (ACLED), this data tracks how women and girls are targeted and identifies the primary perpetrators. Understanding the nature and severity of violence against women and girls across countries is critical for developing effective protection strategies.
To see our interactive maps and data: https://mapping-africa-transformations.org/gender/
Women Leading Change
The SWAC/OECD produces a podcast series Women leading change. This series provides diverse perspectives on the experiences and achievements of West African women, contributing to a richer understanding of their roles and impacts across the region. We gather first-hand examples of their outstanding work within local communities as well as their important contributions to advancing gender equality and driving social, economic, and political change. These conversations also help better connect the SWAC/OECD’s evidence-based analysis with civil society advocacy and action.
Security
Violence has reached a record high in West Africa. MAPTA-Security helps policy makers to better understand the geography of violence, which leads to better designed, place-based, and contextualised policies. Security is analysed across four dimensions: i) the Spatial Conflict Dynamics indicator (SCDi); ii) conflict networks; iii) borders and iiii) the urban/rural dimension.
Spatial Conflict Dynamics indicator (SCDi)
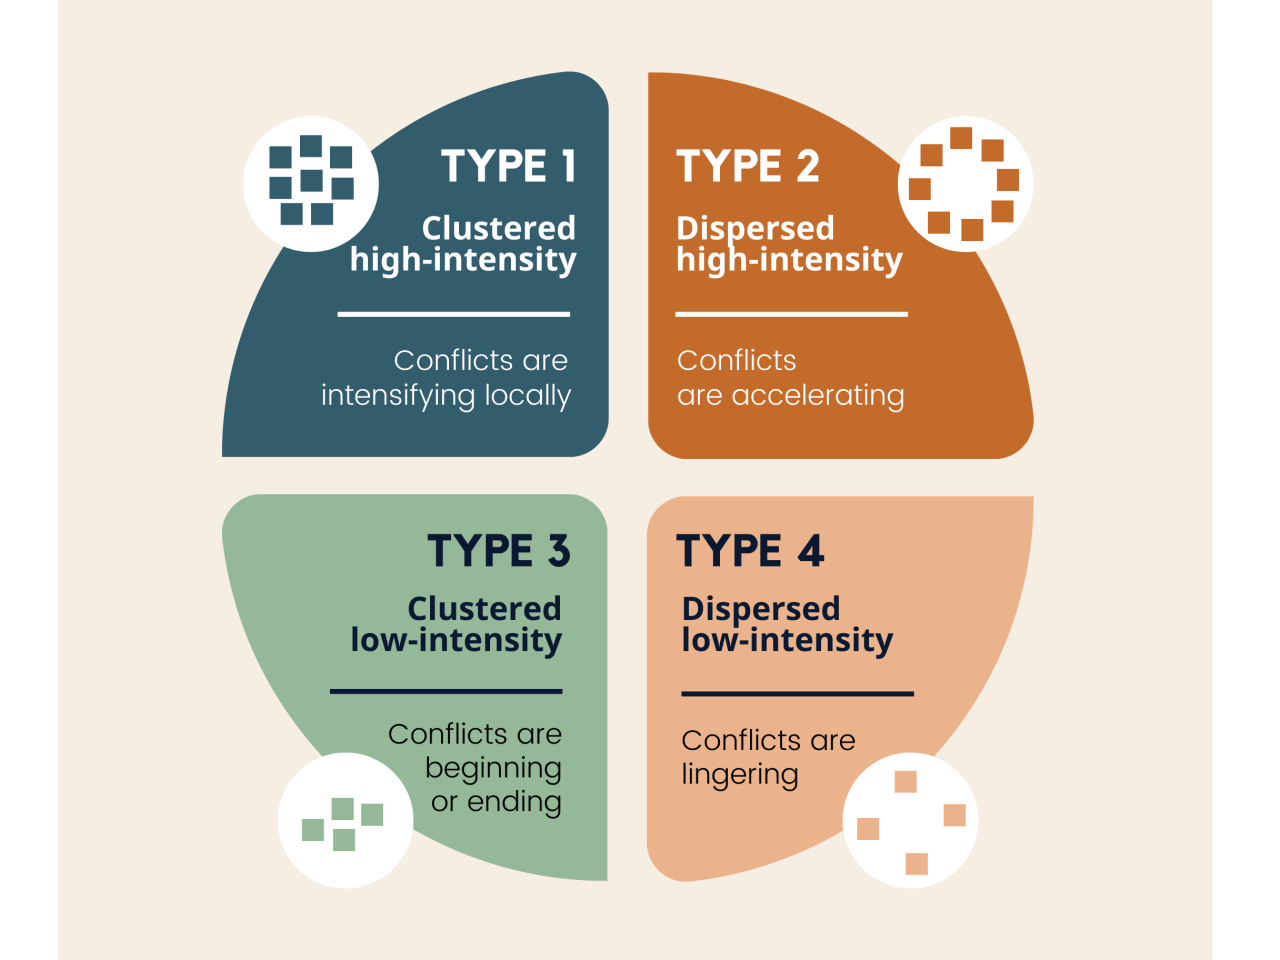
The Spatial Conflict Dynamics indicator (SCDi) maps the temporal and spatial evolution of political violence in North and West Africa since 1997. It classifies the type of conflict by combining two dimensions – the intensity and concentration of violent events. The SCDi provides policy makers with key insights on how conflict is spreading or contracting within or across national borders.
To know more about how the SCDi works: https://www.youtube.com/watch?v=4QdVBgLULzs
To see our interactive maps and data: https://mapping-africa-transformations.org/security/

Conflict Networks
Many actors are involved in conflict, including state forces, rebel groups and extremist organisations. Their relationships are complex and remain poorly understood. MAPTA helps fill this knowledge gap by monitoring how co-operative and rivalrous ties between these violent actors change since 1997. This relational approach is called dynamic social network analysis. Better knowledge of these relationships is crucial to informing regional strategies that aim for long‑term political stability.
To see our interactive maps and data: https://mapping-africa-transformations.org/security-conflict-networks/
Borders
Borderlands are strongly associated with conflict. From 1997-2023, nearly 49% of all violent events took place within 100 kilometres of a border. MAPTA provides spatial analysis to support the need for co-ordinated cross-border solutions, at a time when the transnational nature of conflicts and violent groups is increasing.
To see our interactive maps and data: https://mapping-africa-transformations.org/security-borders/
Urban/rural
Violence remains predominantly rural in West Africa accounting for more than 40% of all events and fatalities recorded between 2000-22. When violence does occur in urban areas, it is mainly observed in small agglomerations with 100 000 inhabitants or less. Mid-sized or large cities rarely see violent events, but conflict in surrounding rural areas isolate these cities from their hinterlands.
To see our interactive maps and data: https://mapping-africa-transformations.org/security-urban/