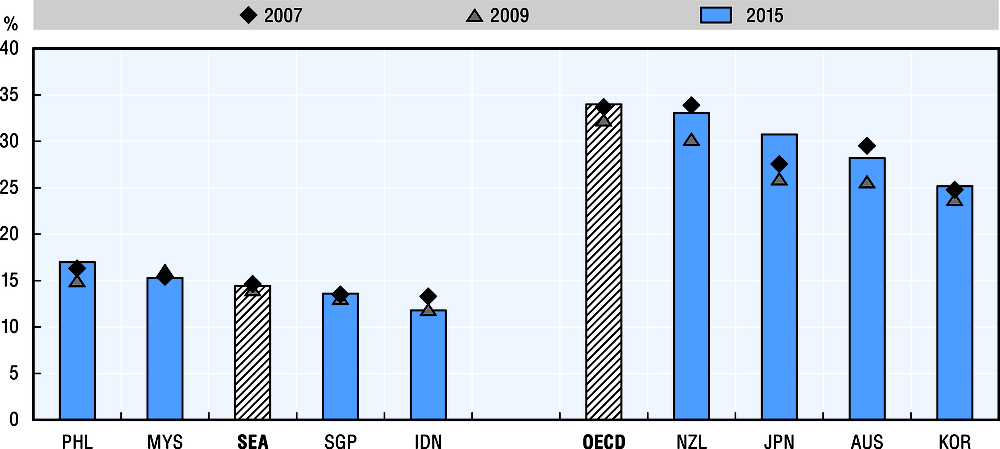
The capacity to tax citizens is one of government’s core attributes. Revenues collected from taxes represent the most important source of public funds in almost all countries and are crucial to provide public goods and services, guarantee government operations, undertake public investments and, depending on societal choices, embark on a higher or lower degree of income redistribution. As a general trend, in 2015 tax revenues as a share of GDP are around 14% on average in the four SEA countries for which there is data. This is significantly less than in the four OECD countries in the region, where tax revenues range between 25% and 33% of GDP.
Taxation in SEA countries varies somewhat, ranging from 11.8% of GDP in Indonesia to 17% of GDP in the Philippines in 2015. Overall taxation levels fall at around half of those in OECD countries, where the 2015 average was 34% of GDP. As a result, governments from OECD countries generally play a more active role in the provision of public goods and services than in SEA countries. There could be several reasons for the gap between SEA and OECD countries. Primarily a narrower tax base in SEA countries as well as comparatively lower tax rates, e.g. goods and services tax rates that are much lower in Southeast Asia than the OECD average. It may also be related to the fact that there is low tax compliance in some countries, and a limited capacity for tax enforcement. Another contributing factor may be the significance of agriculture in some of the countries, which is often associated with lower tax-to-GDP ratios (OECD, 2017).
Between 2007 and 2015, general government tax revenues in SEA countries barely changed, going down by 0.2 p.p. on average in terms of GDP. The change in OECD countries was also minimal, though in the opposite direction, going up by 0.3 p.p. on average. The increase in OECD countries has been steady since the low point reached in 2008 due to the financial crisis.
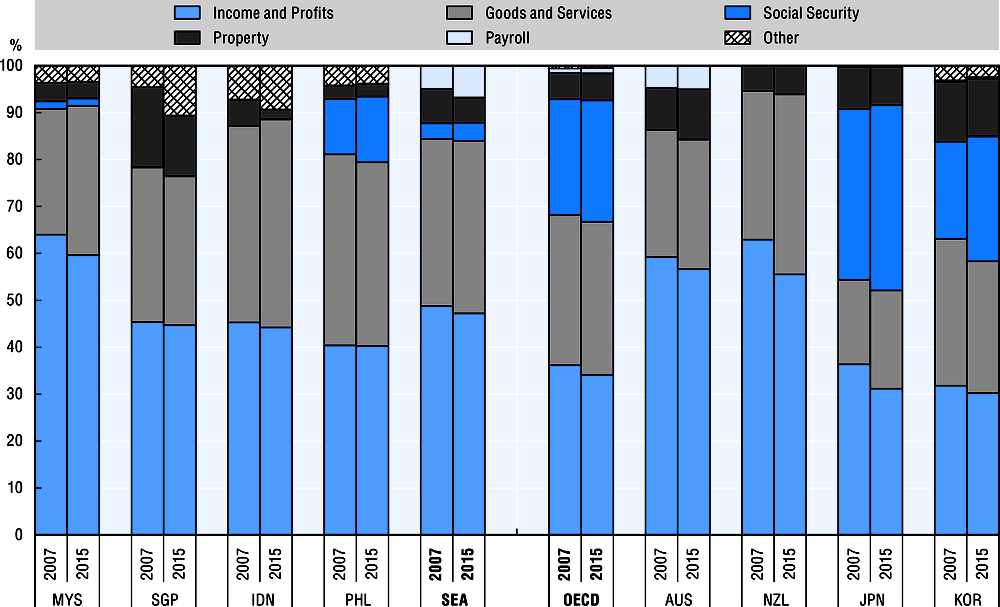
In Indonesia, Malaysia, the Philippines and Singapore, taxes on income and profits account for an average of 47.2% of total tax revenues in 2015. Taxes on goods and services represent on average 36.7%, while property taxes account for 5.4%, social security for merely 3.9%, and other taxes make up the remaining 6.8%. In OECD countries, taxes on goods and services account for a similar proportion of tax revenues on average, accounting for 32.4% in 2015. However, revenues from income and profits taxes are less significant in OECD countries, accounting for roughly a third (34.1%) of tax revenues, and social security contributions are more important, representing one quarter (25.8%). The minimal share of social security contributions in these Southeast Asian countries could also reflect the higher levels of informal employment and economic activity than in OECD countries and expectedly a relatively low distribution of social benefits to citizens. Property, payroll and other taxes similarly contribute a small amount to the overall tax revenues in OECD countries.
The composition of tax revenues has stayed fairly stable in Southeast Asian countries between 2007 and 2015.


