Global Insurance Market Trends 2023

Annex A. Statistical tables
Table A A.1. Breakdown of direct non-life gross written premiums in selected jurisdictions, by insurance class, in 2022
As a percentage of total direct non-life premiums
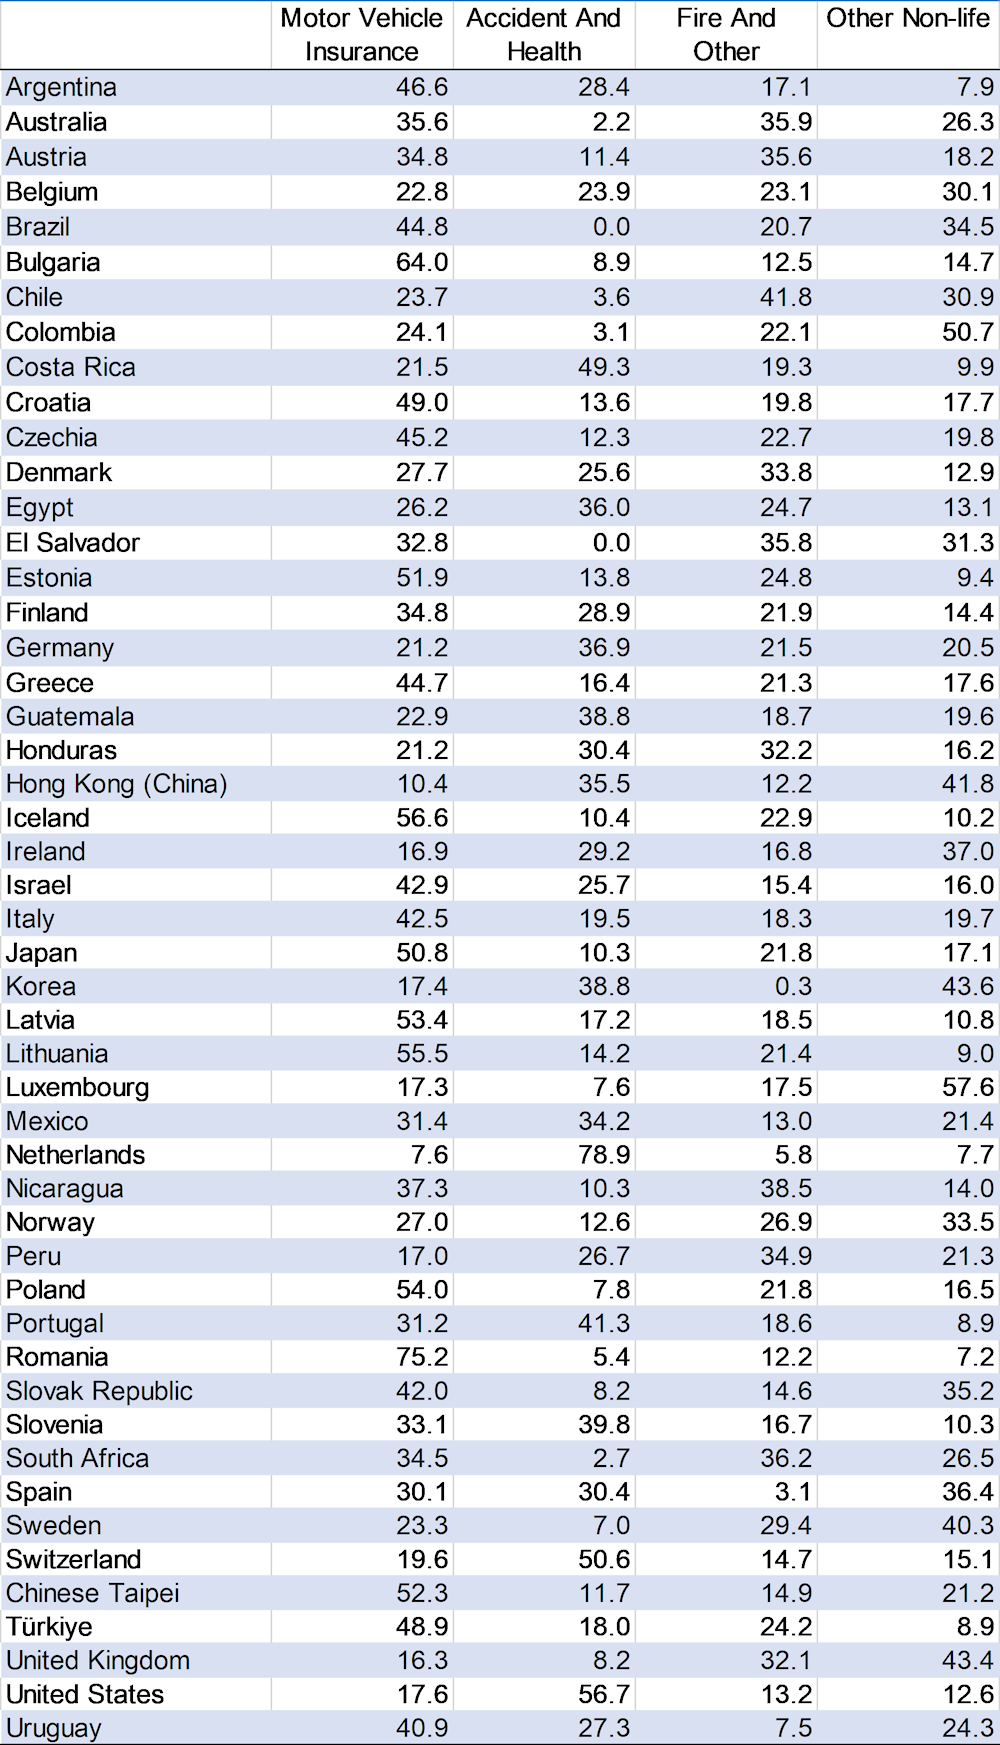
Note: The "other non-life" category includes: Marine, Aviation And Other Transport Insurance; Freight Insurance; Pecuniary Loss Insurance; General Liability Insurance; Treaty Reinsurance.
Source: OECD Global Insurance Statistics.
Table A A.2. Asset allocation of domestic life insurers in main instruments or vehicles, at end-2022
As a percentage of total investment
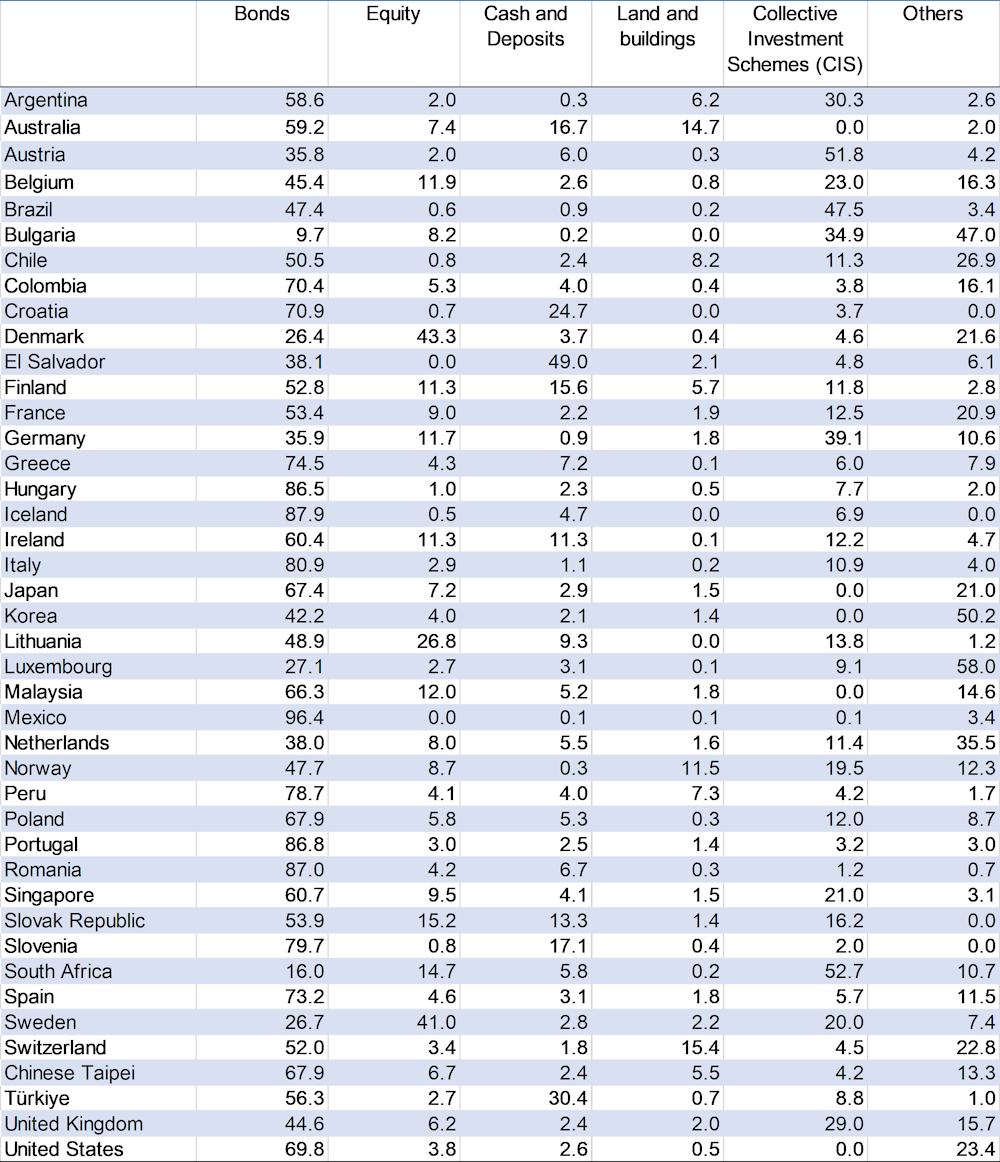
Note: Data exclude assets linked to unit-linked products where risk is fully borne by policyholders. The “Others” category includes investments in loans, private equity funds, hedge funds, structured products and other investments. Negative values in some categories for some jurisdictions were excluded from the calculations of the asset allocation.
Source: OECD Global Insurance Statistics.
Table A A.3. Asset allocation of domestic non-life insurers in main instruments or vehicles, at end-2022
As a percentage of total investment
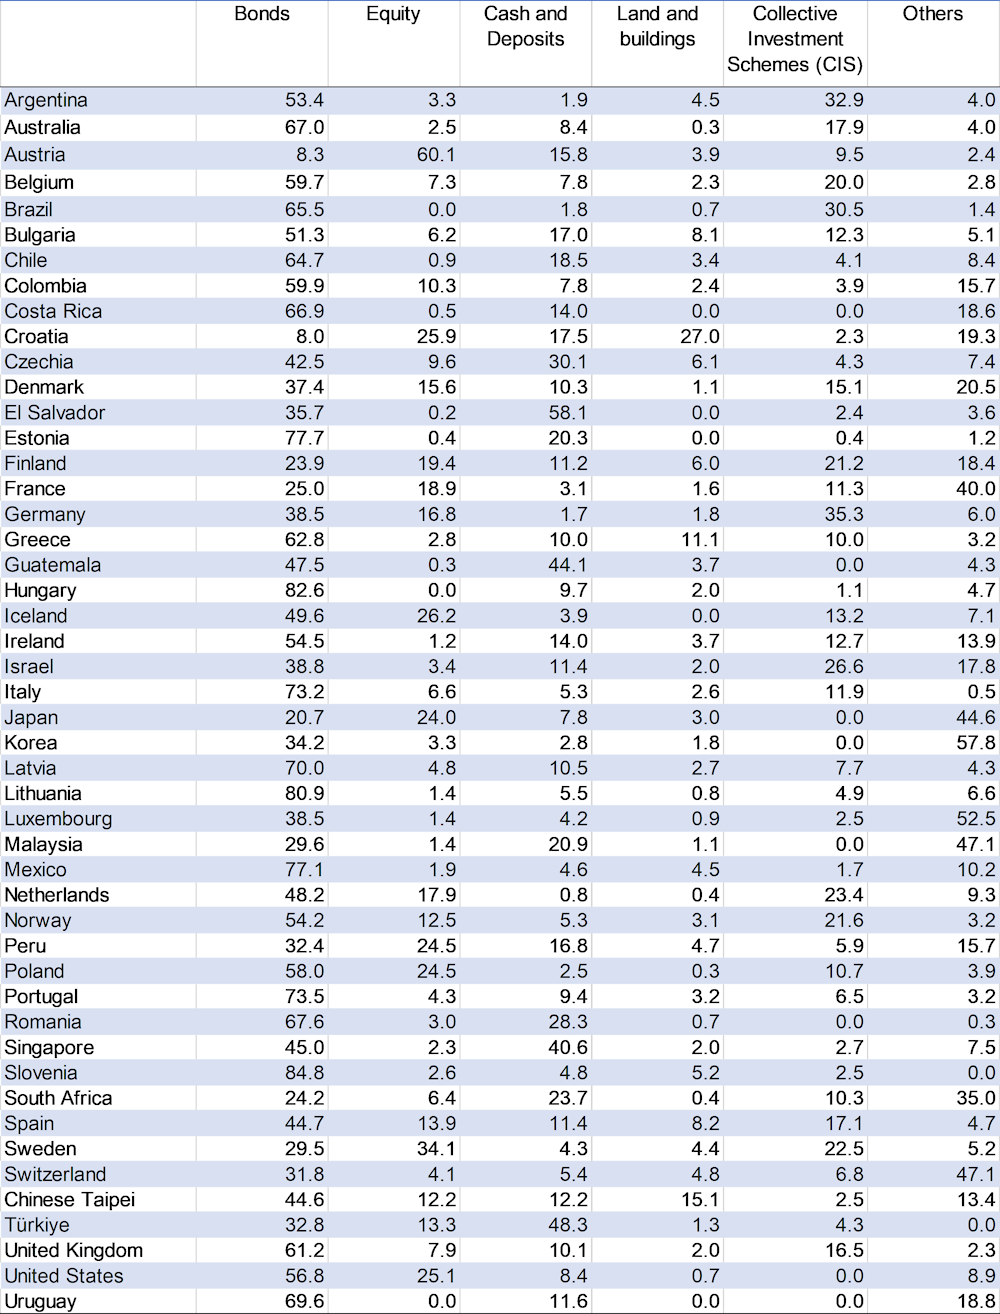
Note: The “Others” category includes investments in loans, private equity funds, hedge funds, structured products and other investments. Negative values in some categories for some jurisdictions were excluded from the calculations of the asset allocation.
Source: OECD Global Insurance Statistics.
Table A A.4. Asset allocation of domestic composite insurers in main instruments or vehicles, at end-2022
As a percentage of total investment
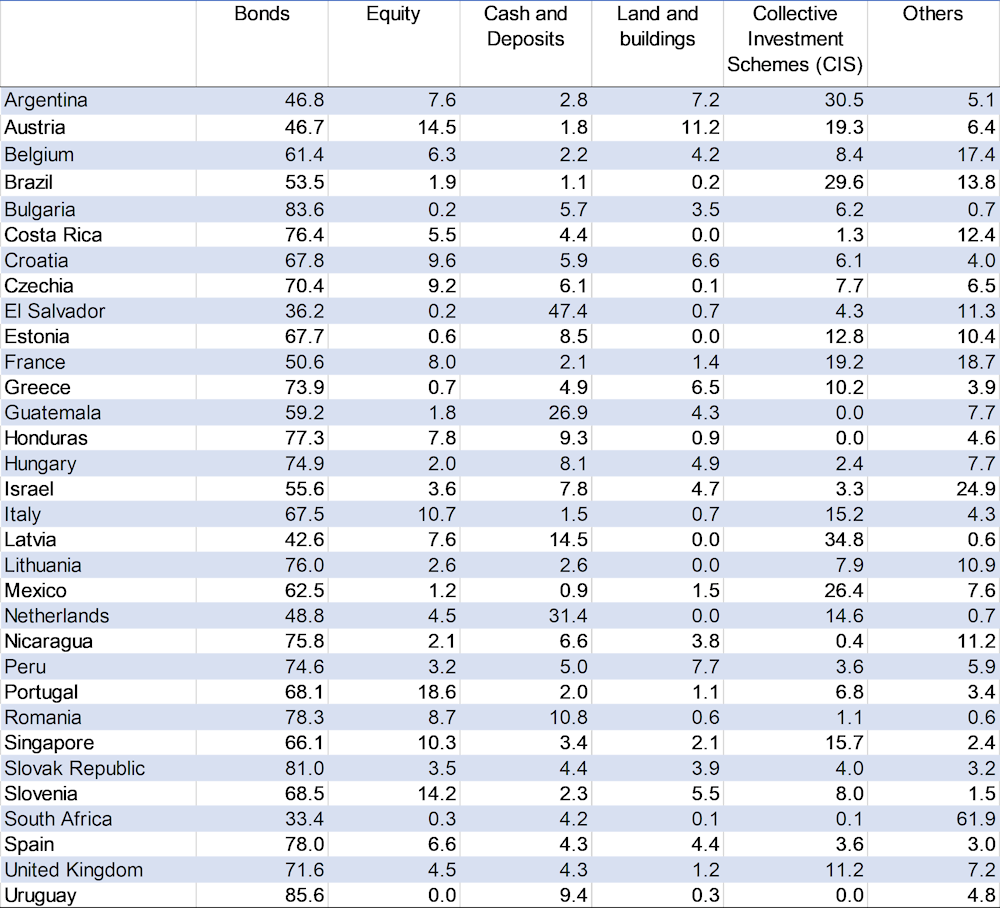
Note: Data exclude assets linked to unit-linked products where risk is fully borne by policyholders. The “Others” category includes investments in loans, private equity funds, hedge funds, structured products and other investments. Negative values in some categories for some jurisdictions were excluded from the calculations of the asset allocation.
Source: OECD Global Insurance Statistics.
Table A A.5. Average nominal and real net investment rates of return by type of domestic insurer in selected jurisdictions, 2021-22
In per cent
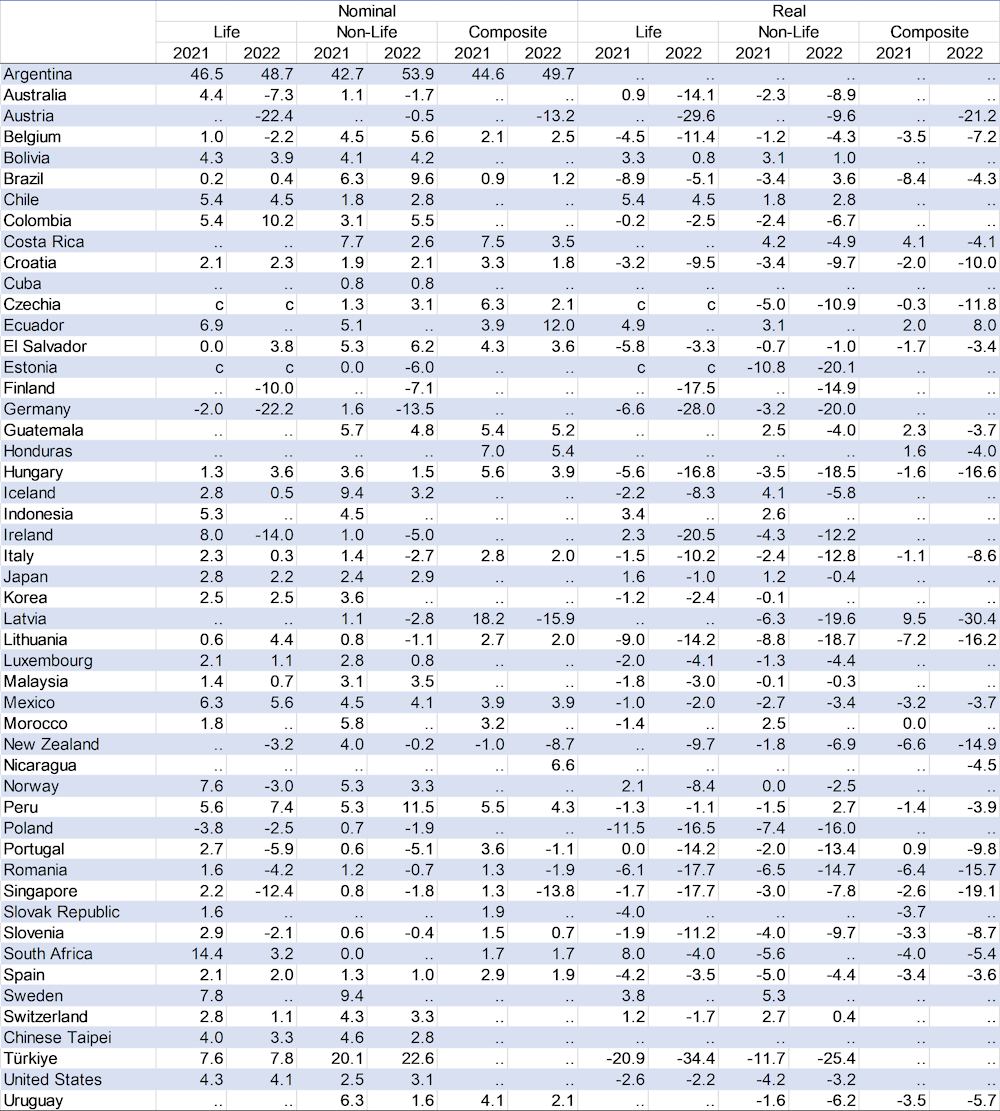
Source: OECD Global Insurance Statistics.
Table A A.6. Return on equity by type of insurer in selected jurisdictions, 2021-22
In per cent
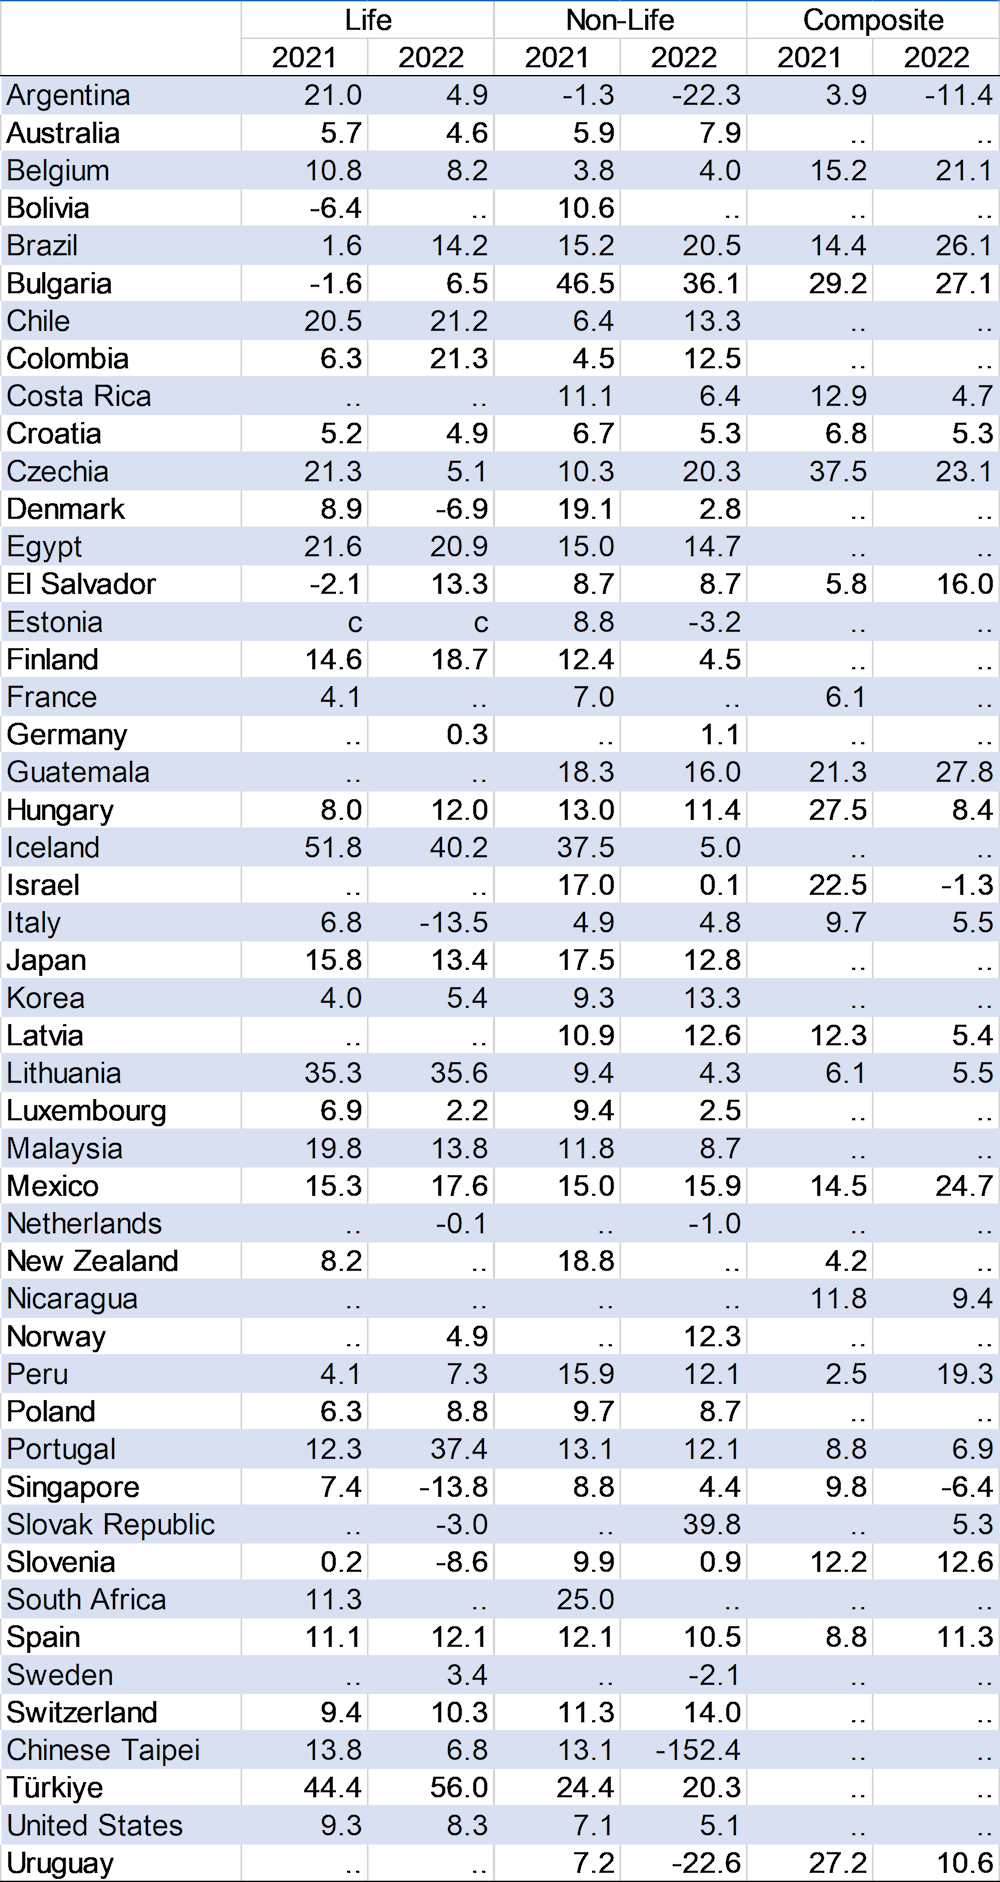
Note: The return on equity (ROE) was calculated by dividing net income for the year N by the average shareholder equity over N-1 and N.
Source: OECD Global Insurance Statistics.