This chapter focuses on mobilising sustainable investment in Central Africa’s nine countries [Burundi, Cameroon, the Central African Republic (CAR), Chad, the Republic of the Congo (Congo), the Democratic Republic of the Congo (DRC), Equatorial Guinea, Gabon and São Tomé and Príncipe]. It analyses the region’s financial inflows and considers how they are allocated to sustainable activities that promote regional integration. It then proposes a case study on the potential monetisation of natural ecosystems to attract investment and help transform production in the region. It provides a baseline study of natural ecosystems and existing monetisation mechanisms, before analysing the main challenges facing their development. Finally, this chapter proposes public policies to quantitatively and qualitatively increase the monetisation of natural ecosystems in Central Africa.
Africa's Development Dynamics 2023
Chapter 4. Investing in natural ecosystems for Central Africa’s sustainable development
Abstract
In Brief
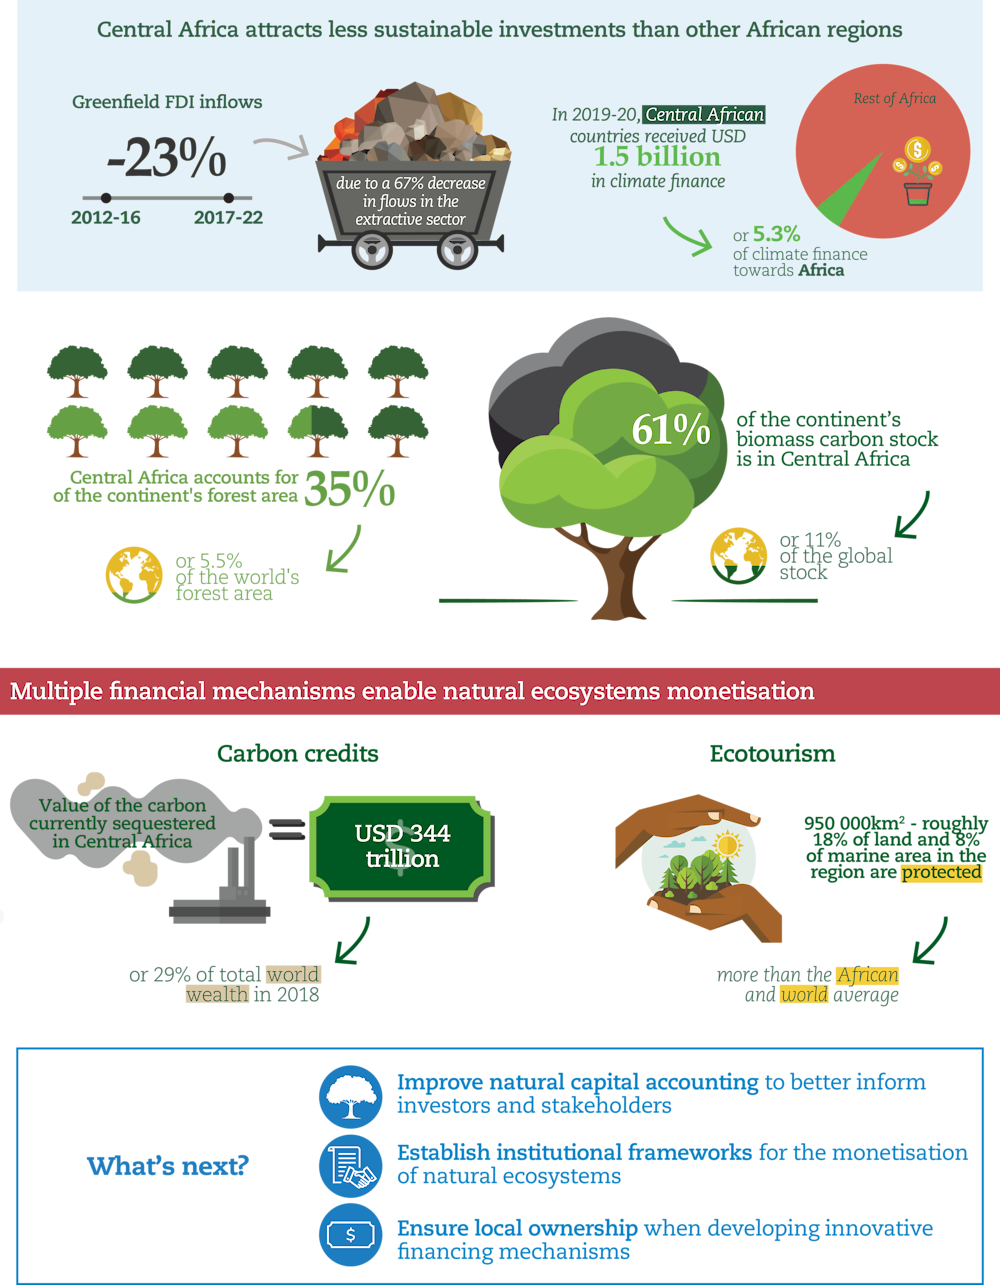
The high potential of Central Africa’s natural ecosystems should make it possible to increase sustainable investment in local economies. Monetising the ecosystem services they provide – such as carbon sequestration by forests, estimated at more than USD 344 trillion – could leverage more financing for sustainable development.
Despite this potential, Central African countries are struggling to extract value from their natural capital. In 2019-20, they received USD 1.5 billion, i.e. just 5.3% of the climate finance allocated to the continent and 0.2% of global climate finance. Technical constraints at the local level and weak institutional and governance frameworks are some of the factors hindering local governments’ ability to establish effective mechanisms for monetising natural ecosystems.
National, regional and international actors should consider three priority actions to increase the monetisation of natural ecosystems: 1) improve natural capital accounting in Central Africa to better inform investors and stakeholders; 2) establish institutional frameworks adapted to the monetisation of ecosystems; and 3) promote innovative financing mechanisms in consultation with community, political and financial actors.
Central Africa (infographic)
Central Africa regional profile
Figure 4.1. Components of economic growth and sources of financing in Central Africa
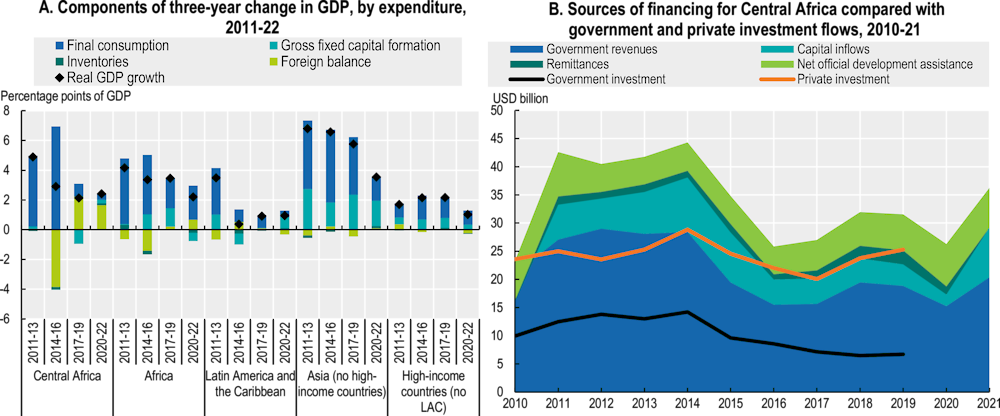
Note: The components of growth in gross domestic product (GDP) are calculated on an annual basis using real annual GDP growth to estimate the increase in real USD. Aggregate figures are calculated by taking the average of national figures weighted by GDP in PPP (purchasing power parity) dollars. The components of three-year change in GDP were calculated by taking the difference between the geometric average of real annual GDP growth over the period and real GDP growth when each component is set to zero for the individual years. Foreign balance is the difference between imports and exports. Imports make a negative contribution negatively to GDP. “High-income countries” refers to countries outside of Latin America and the Caribbean that are classified as “high-income” according to the World Bank’s country and lending groups. Government revenues include all government tax and non-tax revenues, less debt service and grants received. Capital inflows include foreign direct investment (FDI), portfolio investment and other investment inflows reported by the International Monetary Fund (IMF) on an asset/liability basis. Capital inflows should be interpreted with caution as some of the figures for 2021 and for portfolio inflows may be missing.
Source: Authors’ calculations based on IMF (2022a), World Economic Outlook, October 2022 (database) www.imf.org/en/Publications/WEO/weo-database/2022/October; (OECD, 2022a), OECD Development Assistance Committee (database), https://stats-1.oecd.org/Index.aspx?DataSetCode=TABLE2A; World Bank (2022a), World Development Indicators (database), https://data.worldbank.org/products/wdi; IMF (2022b), Balance of Payments and International Investment Position Statistics (BOP/IIP) (database), https://data.imf.org/?sk=7A51304B-6426-40C0-83DD-CA473CA1FD52; IMF (2022c), Investment and Capital Stock Dataset (ICSD) (database), https://data.imf.org/?sk=1CE8A55F-CFA7-4BC0-BCE2-256EE65AC0E4; and World Bank-KNOMAD (2022), Remittances (database), www.knomad.org/data/remittances.
Figure 4.2. Greenfield foreign direct investment flows to Central Africa by activity, source and destination, 2017-22
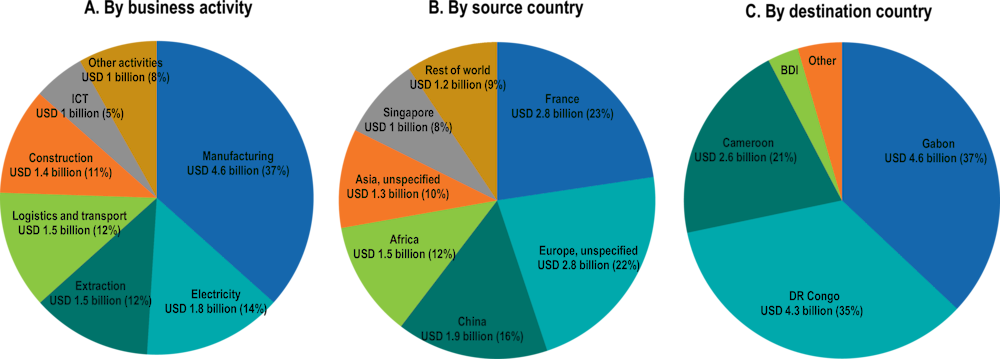
Note: The fDi Markets database is used only for comparative analysis. Actual investment amounts should not be inferred, as fDi Markets data are based on upfront announcements of investment projects, including a share of projects that do not actually materialise. ICT = information and communications technology. BDI = Burundi.
Source: Authors’ calculations based on fDi Intelligence (2022), fDi Markets (database), www.fdiintelligence.com/fdi-markets.
Despite its unique potential, Central Africa receives fewer sustainable investments than other African regions
Financial flows must be enhanced to ensure sustainable development in Central Africa
Investment has contributed little to Central Africa’s growth since the 2010s. The region’s strong population growth may in part explain the significant consumption-led growth over the 2011-13 and 2014-16 periods (Figure 4.1). However, between 2015 and 2016, falling oil prices upset the balance between these different components of growth. The trade balance had a negative effect on growth in 2015 when the value of Central Africa’s oil exports fell suddenly, and then contributed positively when exports slowly bounced back. A 32% decline in public investment and 14% decline in private investment (the largest on the continent) also followed the 2015 price shock. Investment did not return to its previous levels until 2019 and, as a result, gross fixed capital formation had a negative effect on GDP growth during the 2017-19 period.
The declining extractive sector (due to lower oil prices) has been a major factor in reducing investment in the region. Total capital inflows (inflows of FDI, portfolio investments and other types of investment, Figure 4.1) averaged USD 7.5 billion between 2011 and 2015 but averaged only USD 3.8 billion between 2016 and 2020. Nevertheless, Central African economies remain heavily dependent on extractive industries, particularly oil production, whose 2015 price drop was followed not only by a decline in GDP growth, but also by a 59% decline in new investment projects between 2011-15 and 2016-21.
The COVID-19 pandemic has weakened public finances in most Central African countries. Prior to the COVID-19 pandemic, government revenue mobilisation remained relatively low following the 2015 shock (and subsequent 30% decline). According to an IMF and World Bank debt sustainability analysis in February 2023, most Central African countries were either experiencing debt distress (Congo and São Tomé and Príncipe) or at high risk of debt distress (Burundi, Cameroon, the Central African Republic and Chad) (IMF/World Bank, 2023). In 2020, the region’s countries faced an average increase in general government gross debt of 5.5 percentage points of GDP (from 39.9% to 45.3%) as a result of the COVID-19 pandemic. In 2022, most Central African countries continued to be classified as “fragile” contexts, with the exception of Gabon and São Tomé and Príncipe (OECD, 2022b). According to the IMF, however, in 2023 total revenues for Central African countries are expected to increase by 41% from their 2019 level, which could help improve the situation.
The rise in oil prices is having a mixed impact on the region’s economies. Oil prices reached a ten-year high in July 2022, increasing the value of oil exports by 6 percentage points of Central Africa’s GDP. Oil prices are expected to remain high over the next few years, which could lead to an upturn in investment in Africa in the short to medium term (World Bank, 2022b). Reinvestment in fossil fuels, however, would have negative environmental consequences and hinder sustainable development in the region. Moreover, the effects of this price increase have been mixed. They had positive impacts for the majority of net oil-exporting Central African countries (Cameroon, Chad, Congo, Equatorial Guinea and Gabon), but negative effects on the economies of the other four countries.
Central Africa remains vulnerable to a number of other risks beyond oil prices. Recent international conflicts are disrupting food supply chains in the region. Burundi, Congo and the Democratic Republic of the Congo, for example, receive the majority of their wheat imports from Russia and Ukraine (UNCTAD, 2022). Climate change is also increasing instability and exacerbating conflict in a region whose development is already hampered by its fragility (National Intelligence Council, 2021).
Investment is inadequately allocated to sustainable activities
New investment projects have shifted away from extractive industries towards manufacturing, power and logistics, but the overall amounts have fallen sharply. The total value of new investment projects in Central Africa fell by 23% between 2012-16 and 2017-22, mainly due to a 67% decline in flows in the extractive sector (Figure 4.3). Much of this decline predated the COVID-19 crisis: total new investment project flows to Central Africa were 40% higher in 2020 and 2021 than in 2017-18. Investment-related job creation also declined, going from 2.6 to 2.3 jobs per million USD invested. Even in the manufacturing industry, the ratio of jobs dropped from 4.2 to 3.8 jobs per million USD invested.
Figure 4.3. Job intensity of investment flows in new projects in Central Africa, by activity
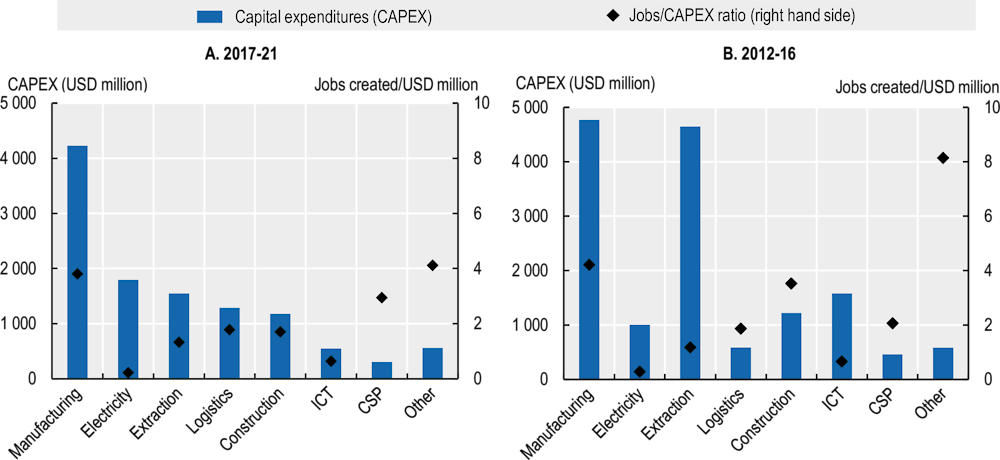
Note: CAPEX = Capital expenditure, ICT = Information and communication technologies, CSP = Corporate services provider.
Source: Authors’ calculations based on fDi Intelligence (2022), fDi Markets (database), www.fdiintelligence.com/fdi-markets.
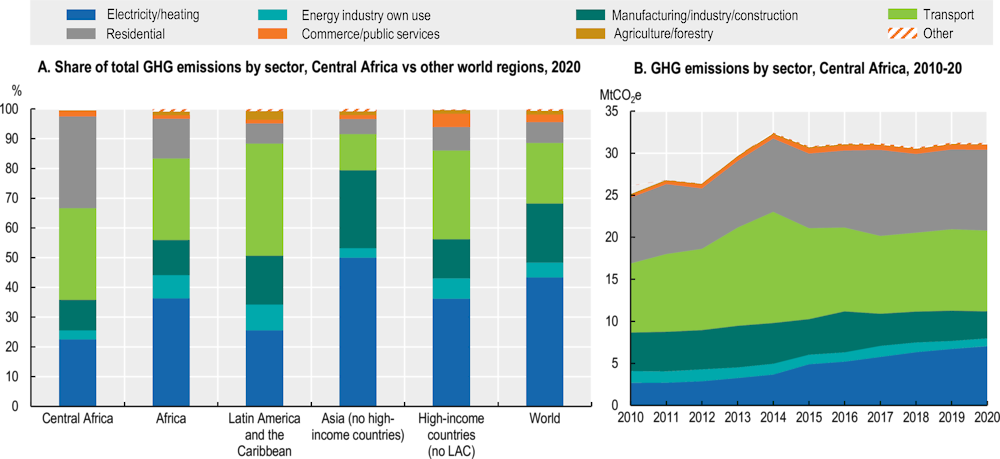
Central Africa has the least carbon-intensive economies in Africa. In 2020, Central African countries produced 31 megatonnes of carbon dioxide-equivalent emissions (MtCO2e), accounting for just 2.5% of Africa’s emissions and 0.1% of global emissions. According to the International Energy Agency (IEA), Central Africa’s share of greenhouse gas (GHG) emissions from residential sources exceeds its share from power generation, which is not the case in other regions of Africa or the world. Since 2000, however, GHG emissions from electricity generation have been on the rise, despite the region’s total emissions having decreased since 2014 (Figure 4.4).
Figure 4.4. GHG emissions in Central Africa, by sector
Source: IEA (2021), GHG Emissions from Fuel Combustion (summary) (database), http://dotstat.oecd.org/Index.aspx?DataSetCode=GHG#.
Central Africa depends less on fossil fuels to generate electricity than other African regions. Approximately 78% of electricity generation comes from hydroelectric power, with the remainder reliant on fossil fuels. However, Central Africa produces just 3% of the continent’s electricity, leaving 72% of its population (118 million people) without access to electricity in 2020. In addition, renewable electricity meets only a small portion of the region’s energy needs (heating, cooking, transport) (Figure 4.5).
Figure 4.5. Non-combustion electricity and heat production in Central Africa and the world, 2020
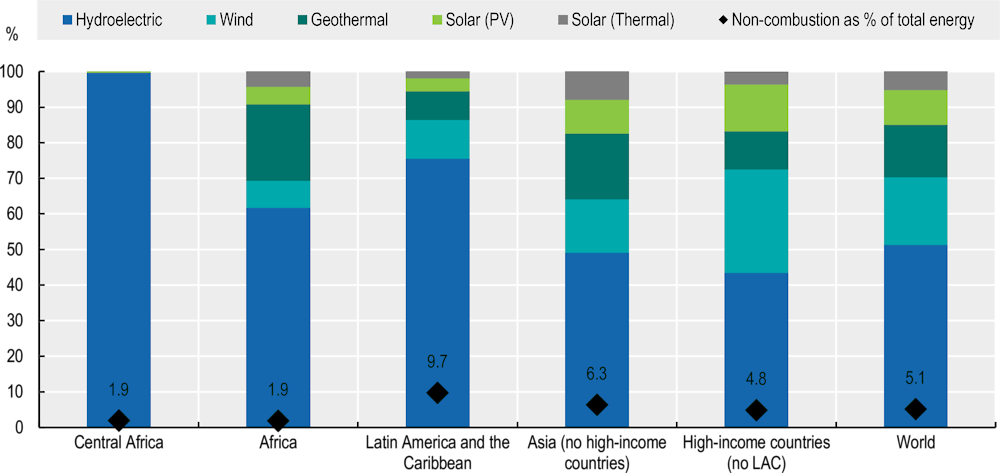
Note: Non-combustible energy sources include sources declared renewable by the IEA, but exclude energy sources based on fuel combustion, such as biofuels and waste. The IEA does not consider nuclear energy to be a renewable energy.
Source: IEA (2021), GHG Emissions from Fuel Combustion (summary) (database), http://dotstat.oecd.org/Index.aspx?DataSetCode=GHG#.
Investment in infrastructure and social services also remains limited in Central Africa. Public and private spending on health and education in Central Africa amounted to 3.7% and 2.3% of GDP, respectively, in 2019. These figures are lower than in other regions of the continent, with the exception of West Africa. Oil-rich countries, such as Congo, the Democratic Republic of the Congo, Equatorial Guinea and Gabon, have the lowest levels of spending on health and education as a percentage of GDP. However, official development assistance allocated to infrastructure and social services in 2020 represented 1.6% of GDP in Central Africa – a much higher proportion than in other African regions, but still insufficient to meet needs and compensate for the lack of public investment in these areas.
Regional integration will make the region more attractive to sustainable investment
Regional integration remains weak in Central Africa, which limits the potential for intra-regional investment development. Regional integration in the Economic Community of Central African States (ECCAS) remains lower than in other regional economic communities, with some disparities between countries (Table 4.1).
Table 4.1. Regional integration indices in Central Africa in 2019
|
Country |
Trade integration |
Infrastructure integration |
Productive integration |
Free movement of people |
Macroeconomic integration |
Average |
|---|---|---|---|---|---|---|
|
Burundi |
0.12 |
0.25 |
0.08 |
0.06 |
0.49 |
0.20 |
|
Cameroon |
0.38 |
0.79 |
0.87 |
0.16 |
0.81 |
0.60 |
|
Congo Republic |
0.90 |
0.43 |
0.43 |
0.54 |
0.77 |
0.61 |
|
Gabon |
0.50 |
0.83 |
0.39 |
0.54 |
0.79 |
0.61 |
|
Equatorial Guinea |
0.37 |
0.37 |
0.32 |
0.38 |
0.80 |
0.44 |
|
Central African Republic |
0.31 |
0.15 |
0.17 |
0.63 |
0.75 |
0.40 |
|
DR Congo |
0.08 |
0.11 |
0.27 |
0.47 |
0.60 |
0.30 |
|
São Tomé and Príncipe |
0.31 |
0.15 |
0.17 |
0.63 |
0.75 |
0.40 |
|
Chad |
0.41 |
0.18 |
0.54 |
0.78 |
0.00 |
0.38 |
|
ECCAS |
0.37 |
0.36 |
0.36 |
0.51 |
0.61 |
0.44 |
Note: The Africa Regional Integration Index (ARII) measures the extent to which African countries are meeting their commitments to pan-African integration initiatives, such as Agenda 2063 or the Abuja Treaty. The ARII addresses the following five dimensions of regional integration: trade integration, productive integration, macroeconomic integration, infrastructure integration and free movement of people. The index ranges from 0 (minimum) to 1 (maximum).
Source: Adapted from African Union Commission (AUC)/African Development Bank/United Nations Economic Commission for Africa (2019), Africa Regional Integration Index Report 2019 Edition, www.integrate-africa.org/fileadmin/uploads/afdb/Documents/ARII-Report2019-FIN-R40-11jun20.pdf.
Most new investment projects in Central Africa are from high-income countries. Between 2017 and 2021, the main sources of new foreign investment projects (in descending order) were the People’s Republic of China (hereafter “China”), France, Singapore, the Netherlands and Germany. Only one-tenth of inward investment flows came from other African countries. Outbound investments from the region are 50 times lower than inbound investments. Central Africa accounted for 0.06% of new outbound investment projects to the continent between 2017 and 2021, with Cameroon accounting for more than half of these flows (Figure 4.6). Compared with other African regions, Central Africa has fewer regional multinational companies investing in the region’s countries.
Figure 4.6. Greenfield foreign direct investment outflows from Central African countries, by destination regions, 2017-21, USD million
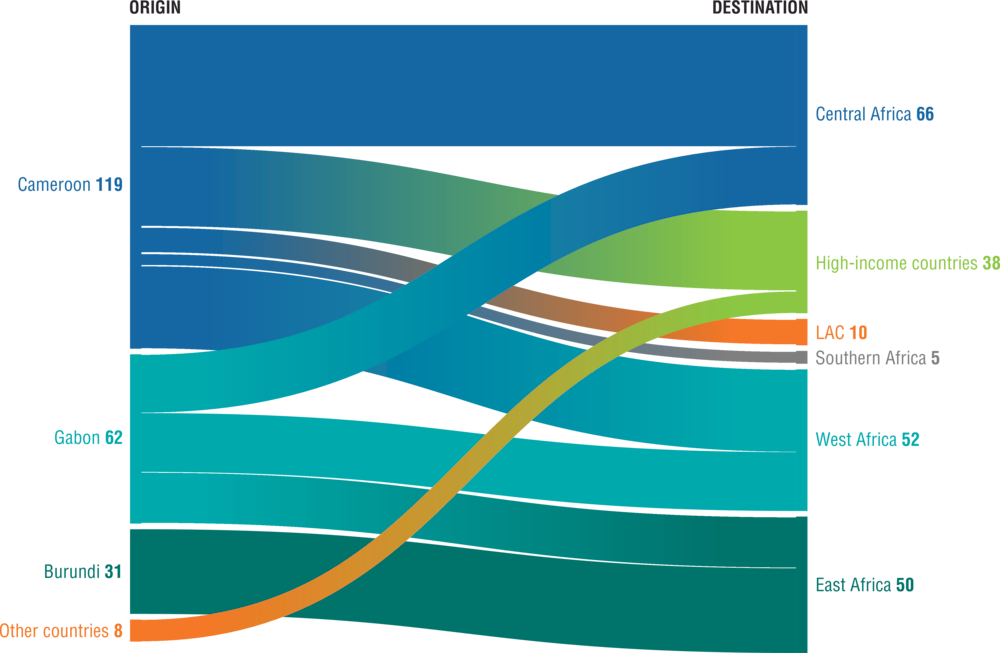
Note: “Other countries” includes the Congo Republic (USD 7 million) and Equatorial Guinea (USD 1 million). “High-income countries” refers to countries classified as “high-income” in the World Bank’s classification of countries by income group, excluding Latin America and the Caribbean (LAC).
Source: Authors’ calculations based on fDi Intelligence (2022), fDi Markets (database), www.fdiintelligence.com/fdi-markets.
Monetising natural ecosystems will attract more sustainable investment in Central Africa
To mobilise financing, policy makers must understand the economic potential of natural ecosystems. This is particularly true in Central Africa – home to one of the world’s largest intact ecosystems, which is immensely valuable to both the Earth’s biosphere and the global economy. However, despite these ecosystems requiring significant investment, sustainable investments in Central Africa remain lower than in the rest of the continent. Monetising ecosystems would therefore make it possible to leverage the financing necessary to protect them, while ensuring the economic development of the countries in the region – in particular by facilitating productive transformation, digitisation or participation in global value chains.
The exploitation of natural ecosystems in Central Africa is struggling to compete with more lucrative, environmentally destructive activities
Monetising natural ecosystems in Central Africa enables them to increase their contribution to sustainable economic development. Attributing monetary values to nature and the environment [sometimes called “monétarisation” in French literature: see, for example, Bouscasse et al. (2011)] may justify their protection and enable additional inputs to be mobilised. If Central African ecosystems do not produce financial returns for investors, they will be tempted to turn to activities that generate higher returns, such as agriculture or housing. Although Central Africa’s tropical forests and rivers are recognised as having globally important ecological and economic value, they struggle to attract significant investment, and deforestation shows no signs of slowing.
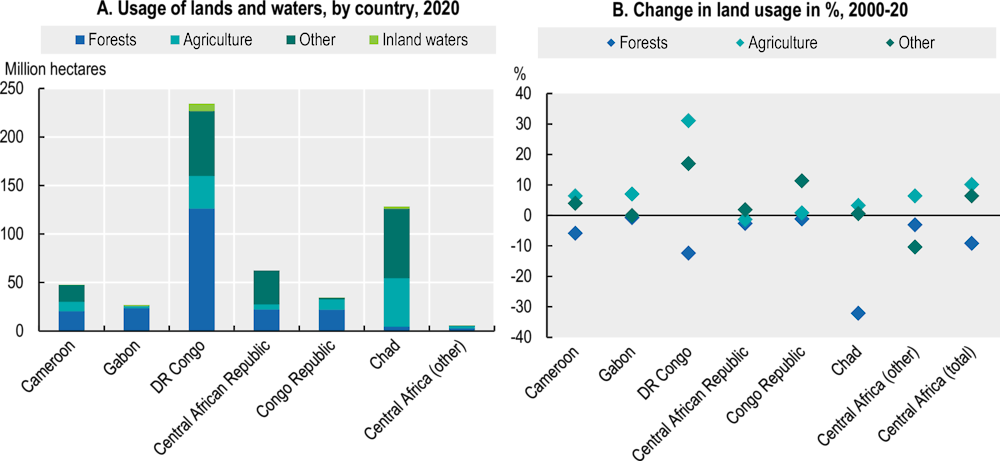
Central African natural ecosystems are losing ground because other forms of land use have higher commercial value. According to the Food and Agriculture Organization of the United Nations (FAO, 2021a), in 2020, Central African forests covered 221 million hectares (ha), i.e. 41% of the region’s land area, and accounted for 35% of Africa’s forest land (Figure 4.7). However, this figure is down 9% from the year 2000, while agricultural and urban land have increased by 10% and 131%, respectively. This decline in forest cover has occurred despite protected areas in countries belonging to the Commission for Central African Forests1 having doubled since the early 2000s (Doumenge et al., 2021). The rate of forest degradation has increased since 2017 in particular, driven by agriculture, infrastructure construction and population growth. The population of Central Africa increased by 87% between 2000 and 2020 and is expected to increase by 119% between 2020 and 2050, according to United Nations projections (2022a).
Figure 4.7. Land and inland water use in Central Africa
Source: FAO (2021a), Food and agriculture data (FAOStat) (database), www.fao.org/faostat/en/#home.
Central Africa has major assets with which to monetise its natural ecosystems
More than in any other region of Africa or the world, forests hold a significant share of Central Africa’s wealth. According to a World Bank estimate (2021) of the total value of human, physical and natural capital in the world’s economies:
The capital stored in Central African ecosystems was USD 394 billion in 2018, i.e. 26.6% of the region’s GDP. This figure exceeds the USD 383 billion in regional value attributed to fishing, agriculture, fossil fuels and minerals combined.
Central Africa’s forests, protected areas and ecosystem services account for 19% of the region’s total wealth, compared with 6% for Africa as a whole and around 1% for other regions of the world (Figure 4.8).
Of the wealth attributed to Central African ecosystems in 2018, 58% comes from future timber production, 27% from ecosystem services (recreation, hunting and fishing, non-timber forest products, watershed protection – see Box 4.1) and 15% from protected natural resources.
However, these estimates do not include the value of carbon sequestration in Central African ecosystems. They also depend on socio-economic factors: higher incomes and larger populations near forests increase the value of ecosystem services.
Figure 4.8. Distribution of natural capital as a percentage of national wealth (excluding external assets), 2018
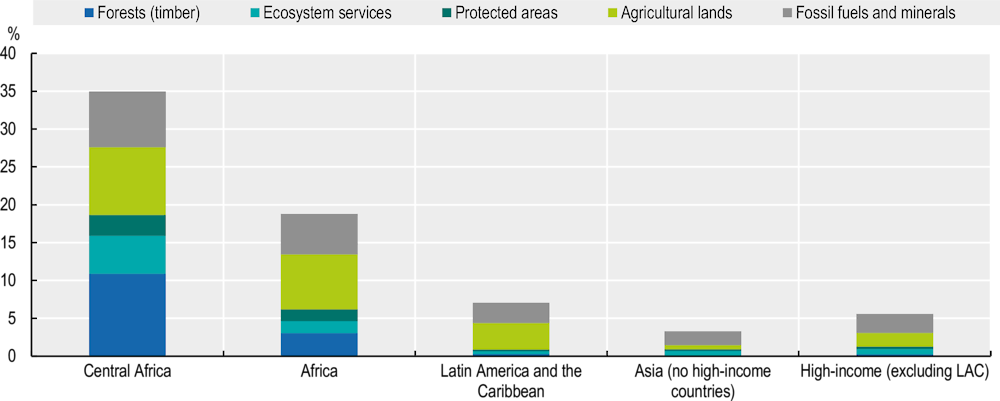
Note: The calculation excludes countries for which complete national wealth accounts were unavailable. This includes 11 African countries, including Equatorial Guinea from Central Africa. “High-income (excluding LAC)” refers to countries outside of Latin America and the Caribbean (LAC) classified by the World Bank as high-income for 2022 according to gross national income.
Source: World Bank (2021), The Changing Wealth of Nations 2021: Managing Assets for the Future, http://hdl.handle.net/10986/36400.
Central African forests are particularly valuable as carbon reservoirs. Although Central Africa accounts for just 35% of Africa’s forest area, it contains 62% of the continent’s biomass carbon stock, or 11% of the global stock (Figure 4.9). These figures do not take into account the potential for carbon storage in the forests’ topsoil, which would increase carbon stocks in West and Central African forests by around 41% (FAO, 2021b). Peatlands in the central Congo Basin account for an additional 30 gigatonnes of carbon stocks (Brown, 2017).
Box 4.1. Ecosystem services: Concept and method of economic evaluation
Ecosystem services refer to the benefits that natural ecosystems provide. These include tangible benefits, such as improved air and water quality, and intangible benefits, such as aesthetic value that can inspire art. The Common International Classification of Ecosystem Services lists three main categories of ecosystem services (Table 4.2).
Table 4.2. Ecosystem services listed in the Common International Classification of Ecosystem Services (CICES)
|
Ecosystem service category |
Ecosystem goods and services |
|---|---|
|
Provisioning services |
|
|
Regulating and maintenance services |
|
|
Cultural services |
|
Source: Authors’ compilation based on Dasgupta (2021), The Economics of Biodiversity: The Dasgupta Review, https://assets.publishing.service.gov.uk/government/uploads/system/uploads/attachment_data/file/962785/The_Economics_of_Biodiversity_The_Dasgupta_Review_Full_Report.pdf.
Economic evaluation of ecosystem services makes it possible to quantify their value in monetary units. For example, it is possible to evaluate the economic contribution of ecosystems based on the costs of building replacement infrastructure following ecosystem loss. However, this approach is just one of many existing evaluation methods (United Nations, 2005). According to Dasgupta (2021), more and more countries are incorporating estimates of natural capital and ecosystem services into their economic evaluations. These evaluations can help establish systems of “payments for ecosystem services” based on compensation in exchange for environmental preservation.
Figure 4.9. The world’s two largest carbon sinks, in Central Africa and the Amazon rainforest, are in decline
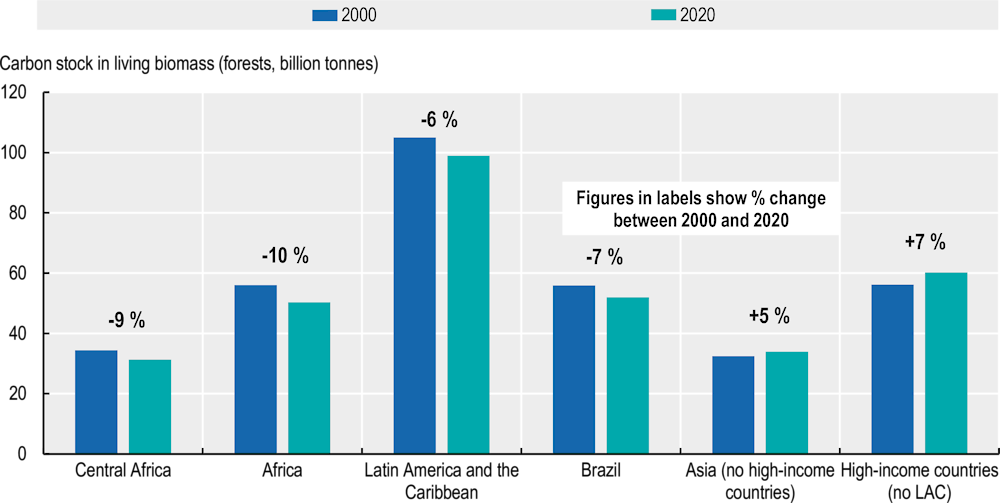
Note: “High-income (excluding LAC)” includes countries outside of Latin America and the Caribbean classified by the World Bank as high-income for 2022 according to gross national income.
Source: FAO (2021a), Food and agriculture data (FAOStat) (database), www.fao.org/faostat/en/#home.
Undegraded Central African forests have maintained strong carbon storage capacities (Hubau et al., 2020). Conversely, the carbon sink capacity of undisturbed Amazonian forests has been declining since the 1990s due to increased tree mortality, thought to be a result of climate change (Brienen et al., 2015).
The value of the carbon currently sequestered in Central Africa is estimated at over USD 344 trillion. However, the methods used to calculate this value change radically depending on the climate scenario under consideration.
The social cost of carbon (in other words the projected cost to society of releasing additional carbon dioxide into the atmosphere) could be as high as USD 307 per tonne of carbon dioxide (tCO2) (Kikstra et al., 2021). Releasing the 31.3 billion tonnes of carbon sequestered in Central African forests into the atmosphere would create global damages equivalent to USD 35.2 trillion.2
Assuming the economic damage caused by the released carbon persisted, the social cost of carbon would exceed USD 3 000 per tonne, i.e. USD 344 trillion for the carbon sequestered in Central Africa.
Although the theoretical costs of carbon pollution are extremely high, market-determined carbon prices vary and can be much lower. The World Bank (2022c) identifies 67 carbon prices from around the world, with an average price of USD 30 per tonne of CO2 equivalent (tCO2e), but ranging from USD 0.08 tCO2e to USD 137 tCO2e. Gabon plans to sell 90 million tonnes of carbon credits, with prices ranging from USD 25 to USD 35 per tonne of sequestered CO2 (Njoroge, 2022). At this price, Central Africa’s total forest stock is estimated to be worth USD 2.8 trillion to 4 trillion, while the annual net reduction in Central African forest stock is worth between USD 17 billion and USD 24 billion per year.
In return for the monetary value associated with Central African ecosystems as carbon sinks, preserving their biodiversity is a global concern. The World Wide Fund for Nature (WWF) estimates that failure to prevent biodiversity destruction will cost USD 479 billion per year globally, i.e. USD 10 trillion by 2050 (Roxburgh et al., 2020). Meanwhile, it costs USD 1.7 billion to USD 2.8 billion per year to preserve the Amazon rainforest. Based on these rates, the cost of preserving the Congo Basin, which is equivalent to around 30% of the area of the Amazon forests, would be between USD 500 million and USD 800 million per year. The Central African Forest Initiative (CAFI) estimates the cost of preserving Gabon’s forests at USD 150 million.
Multiple financial mechanisms enable natural ecosystems monetisation
Public funding
Around 68% of global climate finance comes from bilateral and multilateral donors (Climate Policy Initiative, 2022). The majority finance efforts to reduce GHG emissions from deforestation and forest degradation (REDD+) through funds such as the Green Climate Fund, the Amazon Fund, the Forest Carbon Partnership Facility and CAFI (Watson and Schalatek, 2020). Recipient countries develop a national REDD+ strategy with measured, reported and verified initiatives, and receive funding based on the results they achieve. However, very few REDD+ pilot projects have received these payments (Forests News, 2020). Gabon is an exception, having received a payment of USD 17 million in 2021 for its efforts to reduce deforestation over the 2016-17 period (United Nations, 2021). At the 26th Conference of the Parties to the United Nations Framework Convention on Climate Change (COP 26), collective funding of at least USD 1.5 billion for 2021-25 was pledged to support efforts to protect and maintain the Congo Basin’s forests and peatlands.
Central African governments are beginning to allocate a portion of the revenue generated by environmentally damaging activities towards sustainable financing. In Gabon, for example, reallocated oil revenues account for 10% of the finance received by the Gabonese Fund for Strategic Investments (FGIS), which manages around USD 2 billion in assets and aims to achieve net-zero decarbonisation by 2050 (Box 4.2). In Equatorial Guinea, the government also allocates 0.5% of its oil revenues to the Fund for Future Generations (Yonga, 2014). Countries such as Cameroon, Chad and Equatorial Guinea have also introduced environmental taxes to raise additional revenue while discouraging polluting behaviours. However, the revenue mobilised was below 0.5% of their GDP in 2020 (OECD/ATAF/AUC, 2022).
Box 4.2. Gabon’s forests in the Gabonese Fund for Strategic Investments (FGIS)
Established in 2019, FGIS has an ecological and economic purpose. It operates in three strategic sectors: infrastructure financing, support for small and medium-sized enterprises, and support for social sectors. Three core principles inform its approach: sustainable impact, innovation, and risk mitigation for its stakeholders. FGIS is the first African sovereign wealth fund to join the Net Zero Asset Owner Alliance convened by the United Nations. It has also joined the One Planet Sovereign Wealth Fund Coalition, the International Forum of Sovereign Wealth Funds and the Africa Sovereign Investors Forum. With its green commitments, and management of over USD 2 billion in assets, FGIS aims to achieve net-zero GHG emissions from its portfolio by 2050, set interim targets every five years and report annually.
Gabon’s forests not only play a central role in its ecological objectives but also serve as a source of sustainable financing. Forests cover more than 88% of Gabon’s territory, providing the largest forest cover in Central Africa. Despite the general decline in forest cover in the region, Gabon is the only Central African country to demonstrate that its forests absorb more carbon than they emit. Gabon’s forests are therefore a net carbon sink, absorbing more than 100 million tCO2 per year according to the forest reference emission level it reported to the United Nations Framework Convention on Climate Change (Eba’a Atyi et al., 2022). Given this ecological importance, the first of the three strategic objectives of Gabon’s “Plan Vert” [Green Plan] is to sustainably manage Gabon’s forest and position the country as a world leader in certified tropical timber. The second strategic objective is to create value from Gabon’s agricultural potential and ensure food security, while the third is to promote sustainable exploitation and development of fisheries resources.
Green bonds
Development projects are starting to include innovative financing mechanisms, such as green bonds. Africa’s green bond market remains limited (Table 4.3) but is attracting the attention of policy makers in Central Africa. Between 2014 and 2022, 25 green bonds were issued in 9 African countries, raising USD 4.5 billion, or 0.2% of the global market (Climate Bonds Initiative, 2022). Gabon plans to issue a sovereign green bond through FGIS (worth between USD 100 million and USD 200 million) to finance hydroelectric plant construction (Afrimag, 2022). At the regional level, the Central African Financial Market Supervisory Commission (COSUMAF) has also indicated that it intends to introduce green, social and sustainable bonds on the Central African Securities Exchange in the coming years. These tools can be deployed more effectively by learning from the experiences of other countries that have issued green bonds, such as Morocco or Egypt in Africa (Chapter 6), and Colombia or Uruguay in Latin America (OECD et al., 2022).
Table 4.3. Cumulative total of green bonds by region, in descending order of value, 2014-22
|
Region |
Green bond markets |
Number of issuers |
Number of transactions |
Value (in USD billions) |
|---|---|---|---|---|
|
Africa |
9 |
23 |
25 |
4.5 |
|
North America |
2 |
872 |
5 629 |
382.2 |
|
Latin America |
14 |
107 |
195 |
32.8 |
|
Asia-Pacific |
23 |
1 224 |
1 827 |
458.6 |
|
Europe |
33 |
1 151 |
2 434 |
867.4 |
|
Total |
79 |
3 377 |
10 110 |
1 745.5 |
Source: Climate Bonds Initiative (2022), Climate Bonds Interactive Data Platform (database), www.climatebonds.net/market/data/.
Carbon credits
Central Africa’s large forest cover allows the region to monetise carbon-absorption ecosystem services by implementing carbon credits. In the Congo Basin, the forest’s carbon removal services are estimated to be worth the equivalent of USD 55 billion per year, i.e. 36% of the GDP of the six forest-hosting countries (Cameroon, the Central African Republic, Congo, the Democratic Republic of the Congo, Equatorial Guinea and Gabon) (CGDEV, 2022). In the Democratic Republic of the Congo, for example, the Ibi Batéké agroforestry carbon sink project rewards sustainable forestry with a remuneration of USD 184 000 linked to carbon absorption, which is paid to local agroforestry cooperatives (Eba’a Atyi, 2022). Gabon also hopes to mobilise USD 2 billion through the sale of carbon credits. The country plans to allocate 25% of these funds to forest management and rural communes, 25% to FGIS, 25% to service national debt, and 25% to the national budget for education, health, and climate resilience (Ngounou, 2022).
Sustainable resource management in the agricultural, forestry and mining sectors
Sustainable natural resource management can promote value chain integration while preserving ecosystems. Over the 2015-20 period, the agricultural sectors (agriculture, forestry and fisheries) contributed on average 17% to the region’s GDP, while the extractive sector contributed 31%. Adopting regenerative agricultural practices would increase yields by at least 13%, and at the same time reduce soil erosion by 30% and increase the carbon in soils by 20% (Africa Regenerative Agriculture Study Group, 2021). This would sequester the equivalent of 4.4 GtCO2 per year, as well as an additional 106 MtCO2e by restoring land degraded by forestry. Furthermore, the growing demand for rare metals represents an opportunity for some countries in the region, but social and environmental protection rules must be implemented (AUC/OECD, 2022).
Ecotourism
Ecotourism can support local communities and help diversify economic activities. In Congo, for example, revenue from ecotourism in the Odzala-Kokoua National Park contributes to the local economy through salaries, service provision and community projects, including agricultural diversification, livestock farming, infrastructure development and delivery of medical supplies to health centres (Doumenge et al., 2021).
Protected areas in the region have been extended but remain under stress. The Strategic Plan for Biodiversity 2011-2020 and the Aichi Biodiversity Targets (CBD, 2010) aimed to protect at least 17% of the world’s land area and 10% of its marine and coastal area by 2020 through systems of internationally recognised protected areas. There are currently 206 protected areas in Central Africa, occupying more than 950 000 km², or about 18% of the region’s land and 8% of its marine area – more than the African and global average of about 14% (Figure 4.10). Despite these efforts, 55% of the region’s protected areas remain threatened by oil, gas and mining permits (Doumenge et al., 2021).
Figure 4.10. Protected areas in Central Africa (percentage of national area), by country
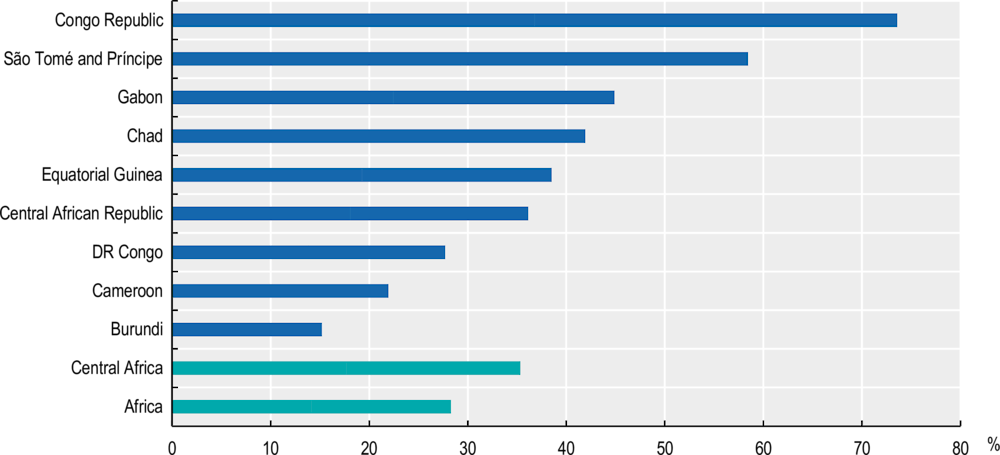
Note: National and international protected areas recognised by the World Database on Protected Areas.
Source: UNEP-WCMC/IUCN (2023), World Database on Protected Areas (database), https://doi.org/10.34892/6fwd-af11.
Challenges to monetising natural ecosystems
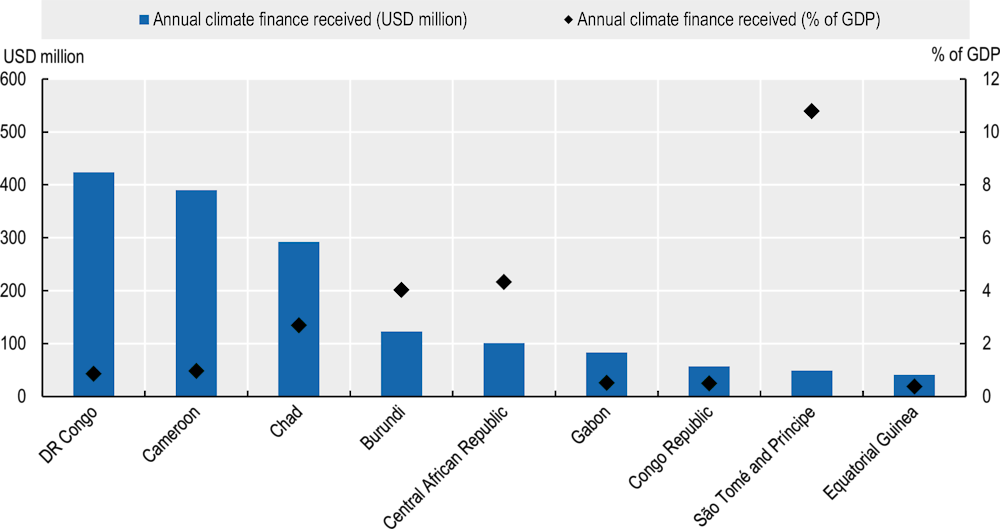
Central African countries receive only a small proportion of global climate finance. In 2019-20, they received USD 1.5 billion, i.e. just 5.3% of the climate finance allocated to the continent and 0.2% of global climate finance. The Democratic Republic of the Congo and Cameroon were the main beneficiaries (Figure 4.11). São Tomé and Príncipe received financing equivalent to 10% of its GDP over the period, which amounted to just USD 48 million, or about 3% of the financing received by the region. In contrast to other regions, more than half of the financing (54%) was for climate change adaptation projects, mostly in the agriculture, forestry, fisheries and land-use sectors (CPI, 2022).
Figure 4.11. Climate-related financing received by Central Africa, 2019-20 average
Source: Climate Policy Initiative (2022), Landscape of Climate Finance in Africa, www.climatepolicyinitiative.org/wp-content/uploads/2022/09/Landscape-of-Climate-Finance-in-Africa.pdf.
Corruption risks are a major constraint to natural ecosystem monetisation and climate investments in Central Africa. An evaluation of initiatives and mechanisms to monetise ecosystems highlights the governance issues affecting the region. For example, an evaluation of the implementation of the REDD+ initiative in Cameroon reveals the lack of an independent review mechanism to prevent falsification of data feeding into the environmental and social impact assessments required to validate of REDD+ projects (TI, 2016). In the Democratic Republic of the Congo, the national audit of industrial logging concessions by the General Inspectorate of Finances revealed that at least 18 illegal concessions had been awarded (Ligodi, 2022). At the regional level, CAFI has highlighted the fund’s good practices in transparency and anti-corruption, but its implementation has been difficult due to the multiple actors involved in its governance (TI, 2020).
Local technical constraints and the large number of forest carbon certification standards complicate the implementation of a voluntary carbon market. Capacity to implement carbon certification remains low in the region, which affects the credibility of initiatives such as REDD+, particularly in terms of calculating reference scenarios on which payments for results are based (Brimont, 2016). In the Democratic Republic of the Congo, for example, the Ntsio agroforestry project covering 5 500 ha and 260 agroforestry farms has been unable to benefit from carbon certification due to the technical constraints that local producers face in managing carbon transactions (Eba’a Atyi, 2022). Different certification standards use different methods to measure results and evaluate carbon prices (Angelsen et al., 2019). For example, mitigation projects certified by the Verified Carbon Standard achieve an average price four times higher than that of the Gold Standard (Table 4.4).
Table 4.4. Sequestered carbon standards and certifications used in REDD+ project compensation
|
Standard |
Voluntary-carbon-market share |
Price per tCO2e in USD |
Examples of REDD+ projects in Central Africa |
|---|---|---|---|
|
Verified Carbon Standard |
81% |
4.8 |
|
|
Gold Standard |
19% |
12.2 |
|
|
Climate, Community and Biodiversity Standards |
less than 1% |
5.4 |
|
|
Plan Vivo |
less than 1% |
7 |
|
Note: A distinction is generally made between the voluntary carbon market, which is open to all companies wishing (but not obliged) to offset their activities, and the compliance carbon market, which makes offsetting mandatory for the most polluting companies in signatory countries to the Kyoto Protocol.
Source: Authors’ compilation based on Tsayem Demaze, Sufo-Kankeu and Sonwa (2020), “Analysing the Narrative and Promises of ‘Avoided Deforestation’ Implementation in Central Africa”, www.cifor.org/publications/pdf_files/articles/ASufoKankeu2001.pdf; and Eba’a Atyi et al. (2022), Les forêts du bassin du Congo : état des forêts 2021, www.cifor.org/publications/pdf_files/Books/Etat-des-forets-2021.pdf.
The social impact of policies for ecosystem preservation is taken into account inconsistently. Logging is one of the main sources of employment in the region’s rural areas, where it helps improve local populations’ income. In Central Africa, forestry directly and indirectly employs over 200 000 people (ATIBT, 2020). In Gabon, the forestry sector is the country’s largest private employer, and the second largest employer after the government. In addition, the forests of Central Africa are culturally significant for indigenous peoples, who sometimes use forest species in traditional rituals. The establishment of protected areas may limit indigenous peoples’ cultural practices, harming hunter-gatherers and transhumant and nomadic populations. Arbitration should be used to compensate local populations who have to give up some of their land-use rights in order to protect environmental services (Lescuyer et al., 2008).
The development of sustainable activities, such as ecotourism or regenerative agriculture, is limited by insecurity and the lack of infrastructure. The number of visitors to the region’s protected reserves remains low due to poor infrastructure and a lack of skills in the tourism sector. In addition, security problems have had serious repercussions on tourist visits to Waza National Park in Cameroon and Virunga National Park in the Democratic Republic of the Congo (Doumenge et al., 2021).
Implementing regenerative agricultural practices requires support from governments, agribusinesses or non-governmental organisations (NGOs) to train local producers. The Nestlé Group has committed to investing USD 1.2 million over five years to promote regenerative agriculture throughout its supply chain by providing technical assistance, investment support and premiums for regenerative agriculture products. In Chad, Moët Hennessy Louis Vuitton (commonly known as LVMH) partnered with the Circular Bioeconomy Alliance (CBA) to launch a regenerative agroforestry project alongside 500 local cotton producers (CBA, 2022).
Central African governments have several policy levers to reconcile monetisation and natural ecosystem preservation
Improving evaluation of natural capital values to inform investors and stakeholders
Improving natural capital evaluation
National policies to mobilise sustainable investment will be more effective if they are based on reliable estimates of natural capital. A lot of data already exist on global ecosystems, but policy makers need to better understand their economic value for investors, both for their own planning and to promote these resources to partners. Developing and reporting reliable estimates of renewable resource wealth will help decision makers increase their transparency and credibility, while identifying gaps in the data that are most relevant to them.
Central African governments can build on existing international efforts to develop natural capital accounts. The World Bank includes estimates of renewable and non-renewable natural capital in its accounting published in The Changing Wealth of Nations 2021 (World Bank, 2021). However, systematic natural resource accounting at the national level is less common. Natural capital accounts for the United States date back to only 2016, while European countries have focused on ecosystem accounts in only the last decade (Bagstad et al., 2021). Gabon is one of ten countries to adhere to the Gaborone Declaration for Sustainability in Africa, one of the main commitments of which is to integrate the value of nature into national accounting and development (Gaborone Declaration for Sustainability in Africa, 2012). The System of Environmental Economic Accounting concept and methodology are based on the System of National Accounts. To date, only two Central African countries (Burundi and Cameroon) feature among the 92 countries from around the world that have implemented the System of Environmental Economic Accounting (UN, 2022b).
Better accounting of renewable natural capital leads to better evaluation of the value of ecosystem services and improved arbitrations on the impact of certain economic activities. Natural resource accounting also draws attention to environmental issues and can enhance efforts to identify greener investment opportunities, as well as helping investors estimate and promote the sustainable nature of their investments. It can also improve evaluation of the losses caused by illegal exploitation of natural resources (illegal mining, poaching, unregulated fishing and environmental degradation). In the Central African Republic, for example, a field survey revealed that over 95% of gold production is not officially documented (USAID, 2019).
Taking into account current climatic and biological knowledge
Evaluating the value of natural capital is largely dependent on scientific knowledge, which must be kept up to date. Climate scientists are constantly collecting new temperature and atmospheric readings that feed into climate models, while refining their understanding of the mechanisms behind global warming. In addition, approximately 18 000 species are discovered each year and most remain unknown to science. The value of an ecosystem therefore also depends on the evaluation’s timing.
New discoveries in biology continue to have important implications for estimates of the value of natural capital. The Congo Basin’s peatlands and their potential for carbon sequestration have been only internationally recognised since 2017 (Brown, 2017). Similarly, the carbon-sequestration services that elephants provide in African rainforests have only recently come to light: by promoting the growth of larger trees, they help increase forest biomass. In 2020, the IMF (Chami et al., 2020) estimated the total value of carbon-capture services provided by African forest elephants at over USD 150 billion (based on USD 25 per metric tonne of carbon). In other words, the services of a single forest elephant would be worth USD 1.75 million.
Leveraging new technologies and computer infrastructure to access and share data
To meet the growing demand for environmental data, new technologies are needed to increase data generation and analysis. The United Nations Conference on Trade and Development calls for a “data revolution” to improve the mobilisation and accreditation of unofficial sources that can complement traditional data sources (Africanews, 2022; IHSN, 2003). A recent survey of conservation-technology users highlighted the three most important new tools for conservation: artificial intelligence, environmental DNA and networked sensors (Speaker, 2021). Outside Africa, Uruguay provides an example of using new technologies in the context of Sovereign Sustainability-Linked Bonds to better assess natural capital, track sustainability efforts and mobilise sustainable financing, using satellite imagery and remote sensing mapping tools (Ministry of Economy and Finance of Uruguay, 2022).
Integrating the value of natural ecosystems into local, national and regional institutions
Developing a natural ecosystem co-management system, assigning appropriate roles to local, national and international actors
Isolated communities can participate in local natural ecosystem management and benefit financially as a result. This could mean obtaining a share of carbon credits or exclusive rights to certain forest products. For example, a REDD+ initiative in Mai N’dombe Province in the Democratic Republic of the Congo relies on local farmers to plant trees and set aside land to reverse local forest degradation. Over 15 000 locals were involved in the initial project consultations. Some 3 772 local farmers have received payments from international donors through the Forest Carbon Partnership Facility in exchange for their services to preserve ecosystems, including planting 1.3 million acacia trees and restoring over 4 000 ha of forest (World Bank, 2018). In 2018, the Nachtigal hydroelectric power plant construction project in Cameroon introduced compensation payments for populations who lost access to forest land due to flooding from the dam.
Special attention could be given to integrating indigenous interests into land ownership. The land rights of local populations remain a sensitive issue when it comes to preserving the ecological sustainability of forest cover. For example, local farmers reported losing access to their fields when Total established a 40 000 ha acacia plantation on the Batéké Plateau in Congo (Quashie-Idun and Howard, 2022). Implementing procedural manuals – including, for example, participatory mapping – can help identify indigenous peoples’ lands. In addition, legal recognition of forced labour and land expropriation cases, as well as the imposition of dissuasive sanctions, should be strengthened in the region.
Central African governments are integrating local and indigenous interests into laws on natural ecosystem management. Act No. 2021/014 of 9 July 2021 to govern access to genetic resources in Cameroon guarantees “the involvement of indigenous people and local communities in the sharing of benefits arising from the use of genetic resources or associated traditional knowledge”. The Central African Republic was the first African country to ratify International Labour Organization (ILO) Convention No. 169 in 2010 (ILO, 2023). This convention gives indigenous communities the right to be consulted prior to any natural resource exploration or exploitation being undertaken on their lands. In 2010, this same country was also one of the first to pass a law protecting indigenous peoples’ rights (IWGIA, 2011). The publication of regular reports by local institutions and NGOs could improve monitoring of the implementation of regulations and imposition of sanctions, if necessary.
Joining international efforts to create certifications for sustainable investments, while identifying cases of greenwashing
International institutions are taking steps to address fraudulent environmental claims that may dilute demand or erode support for sustainable investments. The United Nations Secretary-General has called for “zero tolerance” for greenwashing (UN, 2022). In 2021, the European Commission examined the environmental claims of a selection of websites and concluded that half made baseless claims (European Commission, 2021a). The OECD advises companies to avoid greenwashing, emphasising the importance of producing credible corporate transition plans (OECD, 2022c).
As certifications increase, standards will evolve. In 2022, Europe reached an agreement on a draft regulation prohibiting companies in the European Union (EU) from participating in value chains that may contribute to deforestation (Oeschger, 2022; European Commission, 2021b). As a result, more sustainability certifications will be required for Central African forest industries to participate in global value chains (AUC/OECD, 2022, Chapter 4). The EU’s Forest Law Enforcement, Governance and Trade Action Plan sets out a stricter certification mechanism to discourage illegal logging (Eba’a Atyi et al., 2022). This programme promotes the legal timber trade by proposing that timber-producing countries outside the EU sign Voluntary Partnership Agreements, giving them privileged access to EU markets. It also prohibits operators in Europe from placing illegally harvested timber on the EU market. Five of the ten countries that have signed agreements with the EU are in Central Africa: Cameroon, the Central African Republic, Congo, the Democratic Republic of the Congo and Gabon (VPA Africa – Latin America Facility, 2023).
Promoting new financing mechanisms to monetise natural ecosystems
Central African governments can seek new opportunities in financial instruments. For example, the Bank for International Settlements has proposed adding mitigation outcome interests to green bonds (BIS Innovation Hub, 2022). This mechanism tracks and finances the environmental commitments attached to green bonds. When green bonds are purchased, mitigation outcome interests must be repaid in mitigation outcome units or carbon credits. Internationally recognised memoranda of understanding will need to be developed, based on real assets. Increased trade in these instruments may increase demand for Central African forests to be preserved.
Diaspora support programmes can increase flows and broaden the funding base for natural ecosystems. Migrant remittances represent a limited source of financing, accounting for around 1% of Central Africa’s GDP over the 2015-20 period. However, they could be further mobilised towards productive and sustainable investments, particularly through information, co-financing and technical assistance programmes established by international partners and host countries. For example, France has created the MEET Africa platform, which provides technical assistance for diaspora business creation, co-financed by the EU and the French Development Agency (Meet Africa, 2022). In 2022, the government of Cameroon announced that it had established a fund to support entrepreneurship among young people in the diaspora (Investir au Cameroun, 2022).
Governments can encourage financial innovation by creating an enabling environment, providing seed funding and incorporating these innovations into their programmes and investments. Carbon footprint and biodiversity impact considerations can be integrated into national planning, pursuing synergies with private actors. Governments can mobilise catalytic finance to create demand by using green finance for their own budgets and by moving away from investments in environmentally harmful activities. Linking carbon credits to large infrastructure projects can add a green component to substantial investments or intra-regional projects, which can be certified through African mechanisms such as the Programme for Infrastructure Development in Africa quality label.
International co-operation can help local institutions benefit from carbon credits. For example, the Africa Carbon Markets Initiative (ACMI) launched at COP 27 aims to support the growth of voluntary carbon markets, mobilise USD 6 billion and create 30 million jobs by 2030. Gabon and Burundi are signatories (ACMI, 2022). At the regional level, COSUMAF joined the World Bank’s Sustainable Banking and Finance Network in 2022, which proposes innovative and stable sustainable finance mechanisms, such as green and blue bond issuance (COSUMAF, 2022).
When debt renegotiations are necessary, future sustainable investments should be encouraged. Globally, the total nominal value of debt relieved through debt-for-nature swaps is about USD 3.7 billion, of which only USD 318 million is in Africa. In Central Africa, only Cameroon benefited from this type of initiative in 2006. The African Development Bank (AfDB, 2022) notes that implementing this type of initiative can be difficult – particularly in the Democratic Republic of the Congo – mainly because of governance problems. Directly allocating some resources to independent conservation funds – such as the Okapi Fund, the Democratic Republic of the Congo’s first private conservation trust – may be an alternative.
References
ACMI (2022), Africa Carbon Markets Initiative (ACMI): Roadmap Report, Sustainable Energy for All (SEforALL), Africa Carbon Markets Initiative, www.seforall.org/publications/africa-carbon-markets-initiative-roadmap-report.
AfDB (2022), Debt-for-Nature-Swaps: Feasibility and Policy Significance in Africa’s Natural Resources Sector, African Development Bank, Abidjan, Côte d’Ivoire, www.afdb.org/en/documents/debt-nature-swaps-feasibility-and-policy-significance-africas-natural-resources-sector.
Africanews, “RDC’s government confirms general census is going ahead”, Africanews, www.africanews.com/2022/01/10/rdc-s-government-confirms-general-census-is-going-ahead/, (accessed 10 January 2022).
Africa Regenerative Agriculture Study Group (2021), Regenerative Agriculture: An opportunity for businesses and society to restore degraded land in Africa, International Union for Conservation of Nature (IUCN), Gland, www.iucn.org/sites/default/files/2022-06/regnererative_agriculture_in_africa_report_2021.pdf.
Afrimag (2022), Le Gabon émettra des green bonds de 200 millions de dollars, https://afrimag.net/le-gabon-emettra-des-green-bonds-de-200-millions-de-dollars/.
Angelsen, A. et al. (2019), REDD+: la transformation. Enseignements et nouvelles directions, Center for International Forestry Research (CIFOR), Bogor, www.cifor.org/knowledge/publication/7447.
ATIBT (2020), Rapport d’activité 2020, Association Technique Internationale des Bois Tropicaux, Nogent-sur-Marne, www.atibt.org/files/upload/Activity_report/ATIBT-RAPPORT-ACTIVITE-2020.pdf.
AUC/AfDB/ECA (2019), Africa Regional Integration Index Report 2019, African Union Commission, Addis-Ababa; African Development Bank, Abidjan; United Nations Economic Commission for Africa, Addis-Ababa, www.integrate-africa.org/fileadmin/afdb/Documents/ARII-FR-Report2019.pdf.
AUC/OECD (2022), Africa’s Development Dynamics 2022: Regional Value Chains for a Sustainable Recovery, African Union Commission, Addis Ababa/OECD Publishing, Paris, https://doi.org/10.1787/f92ecd72-fr.
Bagstad, K. J. et al. (2021), “Lessons learned from development of natural capital accounts in the United States and European Union”, Ecosystem Services, vol. 52, https://doi.org/10.1016/j.ecoser.2021.101359.
BIS Innovation Hub (2022), Project Genesis 2.0: Smart Contract-based Carbon Credits attached to Green Bonds, BIS Innovation Hub, Hong Kong, www.bis.org/publ/othp58.pdf.
Bouscasse et al. (2011), Economic valuation of wetlands services - Methodological lessons, « Études et documents » collection of the Service de l’Économie, de l’Évaluation et de l’Intégration du Développement Durable (SEEIDD) of the Commissariat Général au Développement Durable (CGDD), Paris, France, https://hal.inrae.fr/hal-02596502.
Brienen, R. et al. (2015), “Long-term decline of the Amazon carbon sink”, Nature, vol. 519, pp. 344–348, https://doi.org/10.1038/nature14283.
Brimont, L. (2016), “La performance des projets REDD+ : prédire le pire et promettre le meilleur?”, Institut du développement durable et des relations internationales (IDDRI), 28 September 2016, www.iddri.org/fr/publications-et-evenements/billet-de-blog/la-performance-des-projets-redd.
Brown, G. (2017), “World’s largest tropical peatland found in Congo basin”, The Guardian, 11 January 2017, www.theguardian.com/environment/2017/jan/11/worlds-largest-peatland-vast-carbon-storage-capacity-found-congo.
CBA (2022), “CBA and LVMH announce major new project”, Circular Bioeconomy Alliance, 7 November 2022, https://circularbioeconomyalliance.org/sustainable-cotton-growing-in-africa/.
CDB (2010), Plan stratégique pour la diversité biologique 2011-2020 et les Objectifs d’Aichi, Convention sur la diversité biologique, Montreal, www.cbd.int/doc/strategic-plan/2011-2020/Aichi-Targets-FR.pdf.
Centre d’analyse stratégique (2009), Rapport d’activité, http://archives.strategie.gouv.fr/cas/system/files/rapport_annuel_d_activite_2009_0.pdf.
CGDEV (2022), How Much Should the World Pay for the Congo Forest’s Carbon Removal? Center for Global Development, Washington, DC, www.cgdev.org/sites/default/files/how-much-world-pay-congo-forest-carbon-removal.pdf.
Chami, R. et al. (2020), “Le travail de l’ombre des éléphants”, Finance & Development, December 2020, vol. 57, No. 004, International Monetary Fund (IMF), Washington, DC, www.imf.org/external/pubs/ft/fandd/fre/2020/12/pdf/how-african-elephants-fight-climate-change-ralph-chami.pdf.
Climate Bonds Initiative (2022), Climate Bonds Interactive Data Platform (database), www.climatebonds.net/market/data/.
COSUMAF (2022), “La Cosumaf rejoint le Réseau banque et finance durables du Groupe de la World Bank”, Press release, Commission de surveillance du marché financier de l’Afrique centrale, https://cosumaf.org/actualite/la-cosumaf-rejoint-le-reseau-banque-et-finance-durables-du-groupe-de-la-banque-mondiale/.
CPI (2022), Landscape of Climate Finance in Africa, Climate Policy Initiative, San Francisco, www.climatepolicyinitiative.org/wp-content/uploads/2022/09/Landscape-of-Climate-Finance-in-Africa.pdf.
Dasgupta, P. (2021), The Economics of Biodiversity: The Dasgupta Review, HM Treasury, United Kingdom, www.gov.uk/government/publications/final-report-the-economics-of-biodiversity-the-dasgupta-review.
Doumenge, C. et al. (2021), “Ecotourism and protected areas in Central Africa: a future in common”, in State of protected areas 2020, OFAC-COMIFAC and International Union for Conservation of Nature (IUCN), Gland and Yaoundé, www.observatoire-comifac.net/publications/edap.
Eba’a Atyi, R. et al. (2022), Les forêts du bassin du Congo : état des forêts 2021, Center for International Forestry Research (CIFOR), Bogor, www.cifor.org/publications/pdf_files/Books/Etat-des-forets-2021.pdf.
European Commission (2021a), “Screening of websites for ‘greenwashing’: half of green claims lack evidence”, Press release, European Commission, https://ec.europa.eu/commission/presscorner/detail/en/ip_21_269.
European Commission (2021b), “Questions and Answers on new rules for deforestation-free products” European Commission, https://ec.europa.eu/commission/presscorner/detail/en/qanda_21_5919.
FAO (2021a), Food and agriculture data (FAOStat) (database), www.fao.org/faostat/en/#home (accessed 18 November 2021).
FAO (2021b), Global Forest Resources Assessments 2020: Main Report, Food and Agriculture Organization of the United Nations, Rome, https://doi.org/10.4060/ca9825fr.
fDi Intelligence (2022), fDi Markets (database), www.fdiintelligence.com/fdi-markets (accessed August 2022).
Forests News (2020), “Tracking REDD+: A story of remuneration and rewards for avoided deforestation in Central Africa?”, Forests News, Center for International Forestry Research (CIFOR), https://forestsnews.cifor.org/REDD+.
Gaborone Declaration for Sustainability in Africa (2012), “Ecosystem Valuation and Natural Capital Accounting”, Gaborone Declaration for Sustainability in Africa, www.gaboronedeclaration.com/nca.
Hubau, W. et al. (2020), “Asynchronous carbon sink saturation in African and Amazonian tropical forests”, Nature, No. 579, pp. 80-87, https://doi.org/10.1038/s41586-020-2035-0.
IEA (2021), GHG Emissions from fuel combustion (summary) (database), International Energy Agency, Paris, http://dotstat.oecd.org/Index.aspx?DataSetCode=GHG# (accessed 23 September 2022).
IHSN (2003), “General Population and Housing Census 2003”, International Household Survey Network, https://catalog.ihsn.org/catalog/4083/study-description.
ILO (2023), “Ratifications of C169 - The Indigenous and Tribal Peoples Convention (No. 169), 1989”, Normlex (database), International Labour Organisation, Geneva, www.ilo.org/dyn/normlex/en/ (accessed 13 February 2023).
IMF (2022a), World Economic Outlook, October 2022 (database), International Monetary Fund, Washington, DC, www.imf.org/en/Publications/WEO/weo-database/2022/October.
IMF (2022b), IMF Balance of Payments and International Investment Position Statistics (BOP/IIP) (database), International Monetary Fund, Washington, DC, https://data.imf.org/?sk=7A51304B-6426-40C0-83DD-CA473CA1FD52.
IMF (2022c), IMF Investment and Capital Stock Dataset (ICSD) (database), International Monetary Fund, Washington, DC, https://data.imf.org/?sk=1CE8A55F-CFA7-4BC0-BCE2-256EE65AC0E4.
IMF/World Bank (2023), List of LIC DSAs for PRGT-Eligible Countries as of February 28, 2023, International Monetary Fund, Washington, DC, www.imf.org/external/Pubs/ft/dsa/DSAlist.pdf.
Investir au Cameroun (2022), “Entrepreneuriat : le Cameroun lance des consultations pour la création d’un fonds d’appui aux jeunes de la diaspora”, Investir au Cameroun, 14 October 2022, www.investiraucameroun.com/gestion-publique/1410-18579-entrepreneuriat.
IWGIA (2011), “Congolese Law on indigenous peoples’ rights translated into English”, International Work Group for Indigenous Affairs, 31 October 2011, www.iwgia.org/en/republic-of-congo/1452-congolese-law-on-indigenous-peoples-rights-transla.html.
Kikstra, J. S. et al. (2021), “The social cost of carbon dioxide under climate-economy feedbacks and temperature variability”, Environmental Research Letters, vol. 16, n° 9, DOI: 10.1088/1748-9326/ac1d0b.
Lescuyer, G., A. Karsenty and R. Eba’a Atyi (2008), “A New Tool for Sustainable Forest Management in Central Africa: Payments for Environmental Services”, in The Forests of the Congo Basin – State of the Forest 2008, Publications Office of the European Union, Luxembourg, pp. 127-139, https://data.europa.eu/doi/10.2788/32456.
Ligodi, P. (2022), “RDC: les ONG de défense de l’environnement demandent des sanctions après l’audit de l’IGF”, Radio France internationale, 10 April 2022, www.rfi.fr/fr/afrique/rdc-ong-environnement-sanctions.
Meet Africa (2023), www.meetafrica.fr/en/ (accessed 13 February 2023).
Ministry of Economy and Finance of Uruguay (2022), Uruguay’s Sovereign Sustainability-Linked Bond (SSLB) Framework, Ministry of Economy and Finance of Uruguay, Montevideo, http://sslburuguay.mef.gub.uy/innovaportal/file/30690/20/uruguay_sslb_framework__2.pdf.
National Intelligence Council (2021), Climate Change and International Responses Increasing Challenges to US National Security Through 2040, National Intelligence Council, Office of the Director of National Intelligence, Washington, DC, NIC-NIE-2021-10030-A, www.dni.gov/files/ODNI/documents/assessments/NIE_Climate_Change_and_National_Security.pdf.
Ngounou, B. (2022), “Gabon : le pays obtient la certification au crédit carbone de la CCNUCC”, Afrika21, 1 November 2022, www.afrik21.africa/gabon-le-pays-obtient-la-certification-au-credit-carbone-de-la-ccnucc/.
Njoroge, J. (2022), “Gabon’s Carbon Credit Sale - Silver Bullet for Economic Revival?”, The Exchange Africa, 1 November 2022, https://allafrica.com/stories/202211020075.html.
OECD (2022a), “Aid (ODA) disbursements to countries and regions”, Development Assistance Committee (database), https://stats.oecd.org/Index.aspx?DataSetCode=TABLE2A (accessed 10 September 2022).
OECD (2022b), States of Fragility 2022, OECD Publishing, Paris, https://doi.org/10.1787/c7fedf5e-en.
OECD (2022c), OECD Guidance on Transition Finance: Ensuring Credibility of Corporate Climate Transition Plans, Green Finance and Investment, OECD Publishing, Paris, https://doi.org/10.1787/7c68a1ee-en.
OECD et al. (2022), Latin American Economic Outlook 2022: Towards a Green and Just Transition, OECD Publishing, Paris, https://doi.org/10.1787/3d5554fc-en.
OECD/ATAF/AUC (2022), Revenue Statistics in Africa 2022, OECD Publishing, Paris, https://doi.org/10.1787/ea66fbde-en-fr.
Oeschger, A. (2022), “EU Paves Way for Landmark Deforestation-free Products Regulation”, SDG Knowledge Hub - International Institute for Sustainable Development, 8 December 2022, https://sdg.iisd.org/news/eu-paves-way-for-landmark-deforestation-free-products-regulation/.
Quashie-Idun, S. et E. Howard (2022), “How are we going to live? Families dispossessed of their land to make way for Total’s Congo offsetting project”, Unearthed, 12 December 2022 https://unearthed.greenpeace.org/2022/12/12/total-congo-offsetting-land-dispossessed/.
Roxburgh, T. et al. (2020), Global Futures: Assessing the Global Economic Impacts of Environmental Change to Support Policy-Making, January 2020, www.wwf.org.uk/globalfutures.
Speaker, T. (2021), “A global community-sourced assessment of the state of conservation technology”, Conservation Biology, vol. 36, No. 3, https://doi.org/10.1111/cobi.13871.
TI (2020), Governance Assessment : Central African Forest Initiative (CAFI) & DRC’s National REDD+ Fund (FONAREDD), Transparency International, Berlin, https://images.transparencycdn.org/images/2020_Report_GovernanceAssessmentCAFI_English.pdf.
TI (2016), REDD+ and corruption risks for Africa’s Forests: Case studies from Cameroon, Ghana, Zambia and Zimbabwe, Transparency International, Berlin, https://images.transparencycdn.org/images/2016_REDDCorruptionRisksAfrica_EN.pdf.
Tsayem Demaze, M., R. Sufo-Kankeu and D.J. Sonwa (2020), “Analysing the Narrative and Promises of ‘Avoided Deforestation’ Implementation in Central Africa”, International Forestry Review, vol. 22, Issue. 2, www.cifor.org/publications/pdf_files/articles/ASufoKankeu2001.pdf.
UN (2022a), World Population Prospects 2022, Online Edition (database), Department of Economic and Social Affairs United Nations, Population Division, United Nations, New York, https://population.un.org/wpp/Download/Standard/Population/.
UN (2022b), “2022 Global Assessment Results”, System of Environmental-Economic Accounting (database), United Nations, New York, https://seea.un.org/content/2022-global-assessment-results-1.
UN (2022c), Le SG réclame une « tolérance zéro » pour l’écoblanchiment, www.un.org/fr/delegate/le-sg-r%C3%A9clame-une-%C2%AB-tol%C3%A9rance-z%C3%A9ro-%C2%BB-pour-l%E2%80%99%C3%A9coblanchiment.
UN (2021), “Gabon receives payment for reducing CO2 emissions”, Office of the Special Adviser on Africa, United Nations, New York, www.un.org/osaa/news/gabon-receives-payment-reducing-co2-emissions.
UN (2005), “Global Assessment Reports”, Millennium Ecosystem Assessment, United Nations, New York, www.millenniumassessment.org/fr/Global.html.
UNCTAD (2022), “The Impact on Trade and Development of the War in Ukraine: UNCTAD Rapid Assessment – 16 March 2022”, United Nations Conference on Trade and Development, Genève, https://unctad.org/system/files/official-document/osginf2022d1_en.pdf.
UNEP-WCMC/IUCN (2023), World Database on Protected Areas (database), UN Environment Programme World Conservation Monitoring Centre (UNEP-WCMC), Cambridge, UK/International Union for Conservation of Nature (IUCN), Paris, France, https://doi.org/10.34892/6fwd-af11 (accessed February 13, 2023).
USAID (2019), “Key findings of research on the artisanal gold sector in the Central African Republic”, The United States Agency for International Development, Washington, DC, www.land-links.org/wp-content/uploads/2020/05/USAID-AMPR-Summary-of-Gold-Sector-Findings_clean_FINAL.pdf.
VPA Africa-Latin America Facility (2023), https://flegtvpafacility.org/countries/ (accessed 13 February 2023).
Watson, C. et L. Schalatek (2020), “Climate Finance Thematic Briefing: REDD+ Finance”, Heinrich-Böll-Stiftung Washington, DC and Overseas Development Institute, London, https://climatefundsupdate.org/wp-content/uploads/2020/03/CFF5-2019-ENG-DIGITAL.pdf.
World Bank (2022a), World development indicators (database), World Bank, Washington, DC, https://datatopics.worldbank.org/world-development-indicators/ (accessed 12 April 2022).
World Bank (2022b), Commodity Markets Outlook: Pandemic, war, recession: Drivers of aluminum and copper prices (October), World Bank, Washington, DC, https://openknowledge.worldbank.org/handle/10986/38160?locale-attribute=fr.
World Bank (2022c), Carbon Pricing Dashboard (database), World Bank, Washington, DC, https://carbonpricingdashboard.worldbank.org/map_data.
World Bank (2021), The Changing Wealth of Nations 2021: Managing Assets for the Future, World Bank, Washington, DC, http://hdl.handle.net/10986/36400.
World Bank (2018), “Mai Ndombe Redd+ Initiative in DRC”, Fact Sheet, World Bank, Washington, DC, www.banquemondiale.org/fr/country/drc/brief/fact-sheet-mai-ndombe-redd-initiative-in-drc.
World Bank-KNOMAD (2022), Remittances (database), The Global Knowledge Partnership on Migration and Development (KNOMAD), World Bank, www.knomad.org/data/remittances (accessed 19 December 2022).
Yonga, R. (2014), Guide des Fonds Souverains Africains, African Markets, www.african-markets.com/pdf/fr/Guide_des_Fonds_Souverains_Africains_FR.pdf.