Ben Westmore
OECD
Alvaro Leandro
OECD

Ben Westmore
OECD
Alvaro Leandro
OECD
The American middle class has shrunk in size since 1970 according to most definitions. This “hollowing” out of the United States income distribution could result in disillusionment, diminished political engagement, and declining trust in institutions. The American middle class faces two major challenges, among others. First, child care costs in the United States are high and availability is low. Improving enrolment in child care has the potential to reverse the fall in female labour market participation since the financial crisis and result in improved well-being and economic growth. Public funding for child care programmes should be raised, and programme eligibility should be widened to benefit middle-income parents. Second, the climate transition will entail major changes to middle-class lifestyles. Reductions in US household emissions from housing and transportation will be key to achieving the overall emission reduction targets, and may prove costly. Workers in carbon-intensive sectors of the economy and households living in regions that rely on carbon-intensive activities will be affected as resources shift to greener sectors. A national climate strategy should be developed that explicitly takes into account emissions inequalities and the redistributive effects of climate policies. Active labour market policies will be key to achieving a just transition, and existing home weatherisation programmes should be expanded to cover the middle-class.
Disposable incomes of the US middle class have stagnated relative to those of higher- and lower-income households. Over the past few decades, the US income distribution has become more polarised, or more “hollowed out”, as the share of households in the middle class has steadily fallen. The same has occurred, and to an even greater extent, with the distribution of wealth.
At the same time, the middle class has faced rising costs of living. The costs of important components of the middle class consumption basket, such as housing, quality education, health care, child care and energy, have steadily risen. These rising costs, coupled with stagnating incomes, have resulted in increases in household indebtedness, which can have important consequences in terms of disincentivising enrolling in education, investment in health care and financial stability.
The presence of a strong and prosperous middle class supports a healthy economy and society through their investments in health and education, and their support for quality institutions and public services. Across countries, the middle class tends to invest heavily in their own education and that of their children, thus increasing human capital accumulation. Countries with a strong middle class also tend to enjoy high rates of entrepreneurship and innovation, which contribute to stronger economic growth. On the other hand, a shrinking middle class and the perception that the American Dream is reserved only for a select few can lead to disillusionment, diminished political engagement, populism, declining trust in institutions and political instability.
Unprecedented government support during the COVID-19 pandemic prevented a collapse in the incomes of low- and middle-income households despite large employment losses. As government support fades, inequality could rise as disparities across occupations, industries and regions are no longer compensated by fiscal policy. Many households have also reported struggling both financially and psychologically through the pandemic, faced with difficulties keeping up with mortgage, medical and energy bills.
This chapter discusses how the US middle class has fared over the last decades, the growing polarisation of income and wealth, and two major challenges that the US middle class faces going forward; the high cost and low availability of child care and the climate transition. While these are not the only challenges faced by the middle class, they are pressing issues that are a focus of the current administration with important implications for families and the economy as a whole. All else equal, middle-class family incomes would have been flat or possibly even falling had it not been for the rise in female labour market participation that occurred between 1970 and 2000. This rapid increase in participation highlighted the importance of accessible and affordable child care alternatives. Policies that improve access to child care have the potential to reverse the fall in female labour market participation since the financial crisis and result in improved well-being and higher economic growth. The climate transition will entail major changes to middle-class lifestyles. Reductions in US household emissions from housing and transportation, which account for a large part of total greenhouse gas emissions, will be key to achieving the overall emission reduction targets, and may prove costly for households. Workers in carbon-intensive sectors of the economy and households living in regions that rely on carbon-intensive activities will be affected as resources shift to greener sectors.
Countries with a strong a prosperous middle class tend to enjoy higher levels of wellbeing and trust in institutions, greater political stability, better governance, and lower crime rates (OECD 2019). A healthy middle class enhances political stability, which in turn is conducive to investment and economic growth (Alesina and Perotti, 1996). The middle class is also an important source of investment in education: in the presence of liquidity constraints, a wealthier middle class can afford to invest in quality education while a more financially constrained middle class would not be able to (Perotti, 1993; Thorson, 2014). This results in faster human capital accumulation and better economic prospects for the country as a whole (Brueckner et al., 2017). A strong middle class can also be a major source of tax revenue as well as a source of demand for quality public services, regulations and rule of law, which are public goods that benefit the country as a whole (Birdsall, 2016). It is also a source of entrepreneurship and innovation (van Stel et al., 2005; OECD, 2010).
Studies show that growing inequality can result in disillusionment, lower political engagement, nationalist sentiment and higher crime incidence (Bettiza, 2010; Stiglitz, 2012; Kelly, 2000; Kuziemko et al, 2015). The same may be true of growing polarisation and a shrinking middle class (OECD, 2019). Public trust in government is near an all-time low in the United States, as shown in Figure 3.1 (Pew Research Center, 2021; Gould and Hijzen, 2016). It was also low compared to other countries at the onset of the COVID-19 pandemic, with only 36.3% of American respondents to an OECD survey saying they had confidence in their government in 2019 (see Figure 3.2).
Public trust in government (% of Americans who say they can trust the government to do what is right “just about always” or “most of the time”)
% of survey respondents saying they have confidence in their national government, 2019
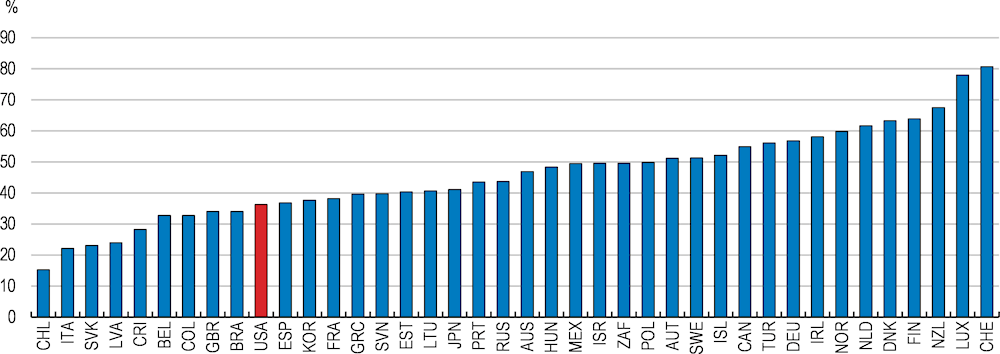
Source: OECD (2022), Trust in government (indicator). doi: 10.1787/1de9675e-en (Accessed on 09 March 2022).
According to data compiled by the Congressional Budget Office (CBO, 2021), growth in incomes of the US middle class has lagged those of higher- and lower-income households during the last decades after accounting for taxes and transfers. Earnings at the top of the income distribution have risen rapidly, driven by increases in labour, business and capital income and capital gains and a downwards trend in taxes. Incomes at the bottom of the distribution have benefited from declines in taxation and increases in means-tested transfers such as Medicaid. Meanwhile, the incomes of the middle class have not kept up despite a falling tax burden and a gradual increase in transfers (see Figure 3.3). From 1979 to 2018, the average income after taxes and transfers rose by 53% for the middle three quintiles of the income distribution, while it rose 91% and 120% for the lowest and highest quintiles, respectively (while this result is sensitive to the definition of the middle class, disposable income growth has been sluggish for the middle class under most common definitions thereof and this chapter shows a rising measure of income polarisation which is independent of any definition). Moreover, Boushey and Vaghul (2016) and Sawhill and Guyot (2020) estimate that a large part of the growth in middle class incomes has been due to the rise in earnings and hours worked of middle class women, without which middle class real income growth would have been almost flat over the past 40 years. The rising contribution of women to family incomes has been accompanied by a family “time squeeze” as the average middle class couple now works 600 hours more per year than in 1975 and the proportion of dual-earning couples has risen from 50% to 70% (Sawhill and Guyot, 2020).
Cumulative growth in average income by income quintile, 1979-2018
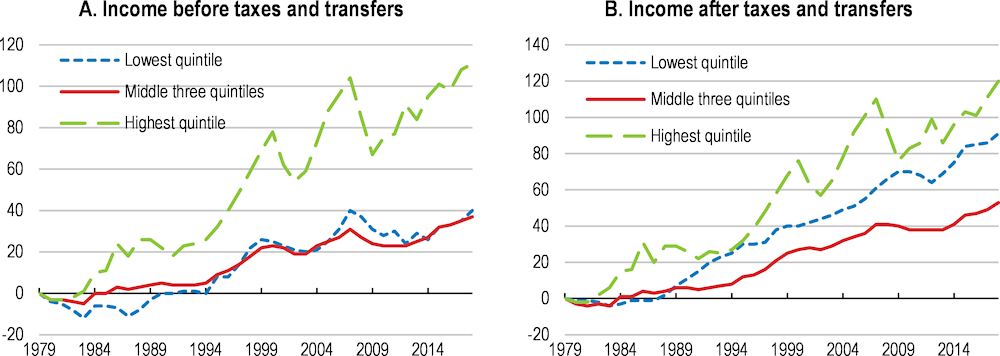
Note: Real incomes in 2018 dollars using the Bureau of Economic Analysis's price index for personal consumption expenditure. Incomes are adjusted for household size using a square root equivalence scale. Taxes and transfers include federal taxes (individual income tax, payroll taxes, corporate income tax and excise taxes) and means-tested transfers (Medicaid and CHIP, SNAP, SSI and other transfers).
CHIP = Children’s Health Insurance Program; SNAP = Supplemental Nutrition Assistance Program; SSI = Supplemental Security Income.
Source: Congressional Budget Office.
The Biden administration’s actions to improve competition in the labour market are welcome. There is mounting evidence of labour market concentration in particular industries and locations leading to lower pay and fewer benefits for workers (Azar et al 2020 and Treasury 2022). In addition, non-compete agreements, non-disclosure agreements and other practices that limit labour market competition have become common in certain industries and can result in reduced labour market mobility and wages. There is also evidence of the growing use of worker misclassification, when a company misclassifies a worker as an independent contractor when the worker should be an employee to reduce costs and avoid certain legal obligations. The Biden administration has proposed a number of measures on these issues, including encouraging the Federal Trade Commission to consider banning or limiting the use of non-compete agreements, scaling back occupational licensing and directing a government-wide effort to improve labour market competition. These measures can help improve competition in the labour market, raise productivity growth by improving labour reallocation, raise investment incentives and help foster a stronger middle class.
Sluggish middle-class income growth has been accompanied by rising costs of core components of the middle-class consumption basket. The real national average price of housing, measured as the Case-Shiller National Home Price Index, is now above the peak it reached in 2006 when house prices subsequently declined steeply amid the subprime mortgage crisis. While the share of final consumption expenditures on housing in the United States is below the OECD average, the share for the US middle class is high and has been rising in recent years. The cost of housing, which includes mortgage interest and charges, property taxes, and rent, accounted for 36% of yearly expenditures for the typical middle-class household in 2020, up from 30% in 1985 (Consumer Expenditure Survey, BLS). While this rise may partly reflect shifting preferences and the natural decrease in the proportion spent on food and other necessities as household incomes rise, it has been accompanied by a significant increase in housing-related debt (shown below in Figure 3.6). While soaring house values have benefitted home-owners, those who do not own a house now face much higher costs than previous generations. Total housing debt has also risen along with house prices, although it still remains 14% below its peak in 2008 (see the section below on the trends in the distribution of net wealth in the United States).
The cost of healthcare has also outpaced middle-class incomes, as the prices of drugs, medical services and health insurance have all risen. This partly reflects increased market concentration in these sectors that has contributed to rising price markups (see Chapter 2). In 2020, middle-class households spent almost 10% of their total expenditure on out-of-pocket health care expenses (including co-payments for medical services, drugs, and insurance premiums and deductibles), double the share they spent in 1985. Not only do elevated prices inflict a significant costs on families, they can also lead to worse health outcomes: in 2018, close to half of Americans skipped medical care because of high costs (NORC and West Health Institue, 2018). This can have generational impacts and result in lower health and economic mobility (Krondstat 2008, Fletcher and Jajtner 2019).
The net costs of tertiary education in the United States have remained high despite a rise in financial aid for students. The average tuition and fees for a bachelor’s degree in public institutions in the United States is high compared to other OECD countries (Figure 3.5), and these costs are even higher for private institutions. According to the College Board (2021), the average price of private non-profit four-year colleges (including published tuition and fees) rose from US$19,360 to US$38,070 between 1991 and 2021, both in 2021 dollars, a real increase of more than 95%. The average cost of public four-year colleges rose from US$4,160 to US$10,740 in the same time period, and that of public two-year colleges rose from US$2,310 to US$3,800, in 2021 dollars. At the same time, the average amount of grant aid for colleges has also risen, resulting in relatively stable net tuition and fees. The share of college students receiving direct public financial support is higher than 85%, among the highest in OECD countries. Nevertheless, the real average total cost of attendance (which includes accommodation, living expenses, books and supplies, etc) net of grant aid has risen for all types of colleges (by 9.8% between 2006 and 2021 for public four-year institutions, and by 4.3% for private nonprofit four-year institutions).
These high costs of higher education have led to an increase in college debt, with total student loan debt reaching US$1.6 trillion in Q2 2022 according to the Federal Reserve Bank of New York. Student loan debt now accounts for more than 10% of total outstanding household debt in the United States, up from 3% in 2003, and more than 30% of outstanding debt for individuals between 18 and 29 years old. Before the student loan repayment moratorium which was introduced during the pandemic in the CARES Act and extended until the end of 2022, student loans were the loan type with the highest delinquency rates. High costs have also led some individuals, particularly but not only poorer and credit constrained individuals, to forgo higher education altogether, resulting in lower capital accumulation in aggregate and lower economic mobility (Chakrabarty et al 2020, Mankiw, Romer and Weil 1992, Barrow and Lee 2010, Boushey and Hersh 2012). Low- and middle-income individuals are significantly less likely to be enrolled in college than higher-income individuals in the United States (Chetty et al, 2017). According to the U.S. Department of Education, 50 percent of high-scoring students from middle-income backgrounds do not pursue a college degree, compared to only a quarter of high-scoring high-income students (Department of Education, 2005). Additionally, Bailey and Dynarski (2011) show that college completion rates have risen faster for the top income quartile than for the rest of the income distribution.
The Biden administration announced in August 2022 that it would provide student debt loan relief. Under this plan, the Department of Education will provide up to US$10,000 in debt cancellation to recipients of student loans held by the Department of Education, with a further US$10,000 for Pell Grant recipients (Pell Grants are subsidies by the federal government for undergraduate students with exceptional financial need). This debt relief will only be available for borrowers earning less than US$125,000 a year (or US$250,000 for married couples). Additionally, the plan also includes measures to limit student debt repayments to 5% of discretionary income and to forgive loan balances after 10 years of payments for borrowers with original loan balances of US$12,000 or less. This plan will bring significant relief to indebted students and could increase both geographic and economic mobility (Di Maggio, Kalda and Yao, 2020). These measures, however, do not directly address the drivers of the high cost of tertiary education in the US and rising indebtedness. High costs have been attributed to a variety of factors, including declines in state-level investment and an elevated college wage premium (Webber, 2017; Gordon and Hedlund, 2020).
Annual average tuition fees charged by public institutions to national students, by level of education (2019/2020)
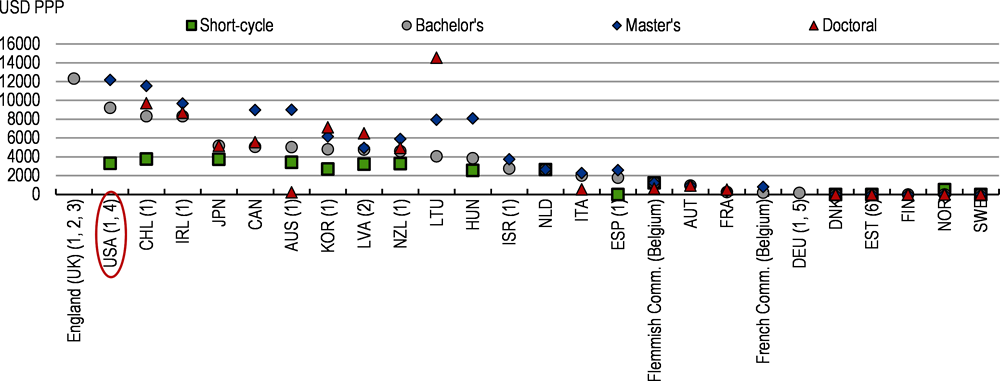
1. Reference year: calendar year 2018 for Australia and Germany and 2019 for Chile, Israel, Korea and New Zealand; academic year 2018/19 for England (UK), Estonia, Spain and the United States and 2020/21 for Finland and Ireland.
2. Government-dependent and independent private institutions are combined.
3. Government-dependent private institutions instead of independent private institutions.
4. Government-dependent private institutions instead of public instituions.
5. Tuition fees for foreign students typically refer to tuition fees for out-of-state national students. However, in a minority of institutions, tuition fees can be lower for out-of-state national students.
6. Public and government-dependent private institutions combined.
Source: OECD (2021).
While the high costs of health care, higher education and housing in the United States have received much attention, reported child care costs are also very high in the United States by international comparison, and have risen significantly in recent years. Additionally, financial aid for child care is very limited, with only a fraction of eligible households receiving public aid despite it being targeted towards the poorest households (see section 3.2). Both poor and middle-class families with young children spend significant amounts of their disposable income on child care, which has led the Biden administration to propose a programme that would cap household spending on child care to 7% of income. Energy costs have also risen since the late 1990s, although they have been volatile due to swings in demand and supply (OECD 2022). The climate transition, the distributional consequences of which have not yet been extensively examined, will impose further costs on US households and represents a new major challenge for the middle class. The implications of the rising costs of child care and the climate transition for the middle-class are discussed in Sections 3.2 and 3.3.
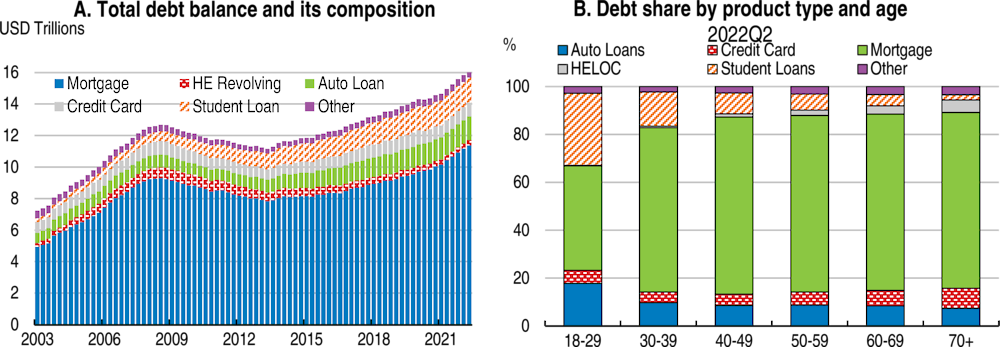
Source: Federal Reserve Bank of New York, Quarterly Report on Household Debt and Credit 2022:Q2.
Low wage growth, rising costs, and foregone education and medical care, among other factors, have all coincided with a rise in income and wealth inequality and low and stagnant intergenerational mobility in the United States in recent decades (Piketty and Saez 2003, CBO 2021, Piketty, Saez and Zucman 2018, Chetty et al 2014a and 2014b, Chetty et al 2017, Boushey and Hersh 2012). Labour market mobility has fallen as accessing quality jobs and earnings growth opportunities has become more difficult, leading to a deterioration of the “job ladder” (Causa, Luu and Abendschein 2021, Haltiwanger and Spletzer 2020, Azzopardi et al 2020). Inter-regional migration has also fallen, partly due to rising housing costs, with implications for regional inequality and economic mobility (Cavalleri, Luu and Causa 2021, Molloy and Smith 2019). Additionally, business dynamism has declined and between-firm inequalities have risen (Autor et al 2017, Gutiérrez and Philippon 2017, Akcigit and Ates 2021).
Low intergenerational mobility and rising income inequality have been accompanied by a rise in the polarisation of the United States income distribution, or a “hollowing out” of the middle class (see also OECD 2019). A measure of polarisation of the US household income distribution, calculated using household-level data from the Bureau of Labor Statistics’ Current Population Survey, has steadily risen since 1970 (see Table 3.1 and Figure 3.7). During the period between 1970 and 2020, the polarisation index rose more than 35%, while the Gini coefficient rose 30% (see Box 3.1 for an explanation of the polarisation index). This result is consistent with the description in Pew Research Center (2020) of a falling share of US aggregate income held by middle-income households since 1970. Alichi, Mariscal and Muhaj (2017) also show that income polarisation varies significantly across states and is greater in southern and coastal states than in the middle of the country.
Other measures reiterate that the relative size of the middle class has shrunk. The share of households earning between 67% to 200% of median income (the definition taken by Pew Research Center 2020) fell from 61% in 1970 to 50% in 2020, equivalent to roughly 14 million fewer middle-class households in 2020 household population numbers (there are 127 million households according to the 2020 Census). Taking the definition of households earning between 75% to 150% of median income, the middle class has shrunk from 43% of US households to 33% between 1970 and 2020. While this is partly the result of a rising share of upper-income households, the share of lower-income households has also risen, which suggests that the middle class has “shrunk from both sides”. According to research using linked parent-child tax records data, intergenerational mobility has not improved since 1971, and the probability of reaching the top income quintile has remained broadly constant for the children of parents from all income quintiles (Chetty, 2014a). While there are a variety of factors behind rising earnings inequality and polarisation in the United States, including globalisation, low real minimum wages and the diminished role of collective bargaining, rapid technological developments and automation have been identified as possibly the most important factors (Acemoglu and Restrepo, 2017, 2021; Alichi, Mariscal and Muhaj, 2017; Rusticelli et al, 2018). As technology advances, the premium on skills increases and the proportion of tasks that can be performed by capital expands, reducing demand for low-skilled labour (IMF, 2017). Acemoglu and Restrepo (2021) estimate that over half of the changes in the US wage structure over the past four decades are explained by the declining earnings of workers specialised in routine tasks in industries experiencing rapid automation.
Measures of inequality and polarisation
|
|
1970 |
1980 |
1990 |
2000 |
2010 |
2020 |
|---|---|---|---|---|---|---|
|
Inequality |
||||||
|
Gini |
0.346 |
0.349 |
0.383 |
0.424 |
0.436 |
0.445 |
|
P90/10 |
6.2 |
6.5 |
7.8 |
8.0 |
9.7 |
9.7 |
|
P90/50 |
1.2 |
1.2 |
1.3 |
1.4 |
1.4 |
1.5 |
|
Polarisation |
||||||
|
Household share(%) in income range: |
||||||
|
67%to200% of median income |
61% |
60% |
56% |
54% |
50% |
50% |
|
75%to150% of median income |
43% |
41% |
37% |
37% |
34% |
33% |
|
Range of income divided by median covering middle: |
||||||
|
40% to 60% of households |
0.303 |
0.324 |
0.353 |
0.375 |
0.408 |
0.401 |
|
30% to 70% of households |
0.634 |
0.665 |
0.750 |
0.784 |
0.849 |
0.842 |
|
20% to 80% of households |
1.052 |
1.101 |
1.238 |
1.299 |
1.392 |
1.401 |
|
Median / mean |
0.847 |
0.864 |
0.833 |
0.768 |
0.761 |
0.743 |
|
Polarisation index |
0.299 |
0.312 |
0.348 |
0.364 |
0.436 |
0.445 |
Note: Pre-tax income. Calculated with survey data from the Annual Social and Economic Supplement of the Current Population Survey. The sample was restricted to households with a household head between 24 and 64 years old and annual household income above US$1000. Household income was size-adjusted using the OECD equivalence scale.
Source: Annual Social and Economic Supplement of the Current Population Survey.
Income polarisation index and income gini coefficient, 1970-2020
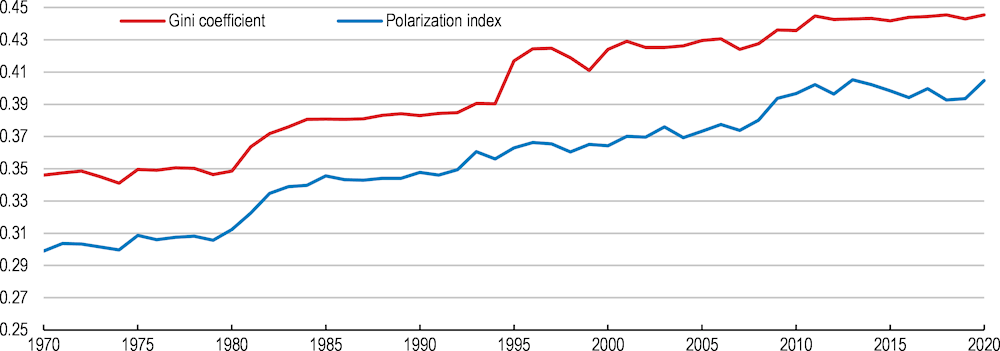
Note: Calculated with pre-tax income data from the Annual Social and Economic Supplement of the Current Population Survey. The sample was restricted to households with a household head between 24 and 64 years old and annual household income above $1000. Household income was size-adjusted using the OECD equivalence scale.
Source: Annual Social and Economic Supplement of the Current Population Survey.
While the relative size of the US middle class is small compared to other OECD countries, other countries have also experienced a growing polarisation of incomes and a shrinking middle class (see Figure 3.8). In Germany, for example, the proportion of the population earning between 75% and 200% of median income has shrunk by 5.7 percentage points since 1990, compared to 2.6 percentage points in the United States (OECD, 2021d).
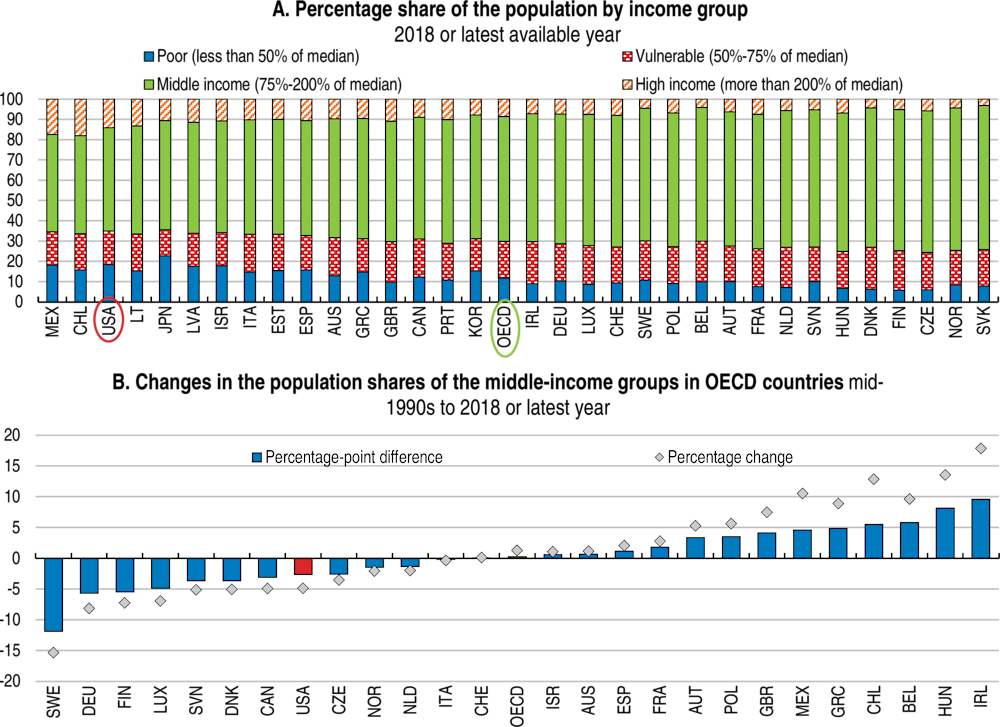
Note: Results refer to the year 2018, except for the United States (2019), Belgium, Canada, Chile Israel, Switzerland (all 2017), Austria, the Czech Republic, Denmark, Estonia, Finland, Greece, Italy, Norway, Poland, Spain (all 2016), Hungary, Slovenia (2015), Australia (2014), Japan, Luxembourg (2013), and Korea (2012). In Panel A, the OECD average gives the unweighted average over the 33 countries included in the figure. In Panel B, OECD refers to the unweighted average across 26 countries with available data.
Source: OECD calculations based on data from the LIS Cross-National Data Center, except for France, Latvia, Portugal and Sweden, which are based on data from the European Union Statistics on Income and Living Conditions (EU-SILC).
Net wealth inequality is greater than income inequality in the United States, and has been growing more rapidly in recent decades (Pew Research Center 2020). The same is true of net wealth polarisation. The share of US aggregate wealth held by middle-income households (defined as those earning between two-thirds and double the median income) has fallen from 32% in 1983 to 17% in 2016, while the share of wealth held by upper-income households rose from 60% to 79%. The net wealth polarisation index, calculated using household-level data from the Survey of Consumer Finances (see Figures 3.9), rose sharply in the aftermath of the financial crisis as middle-income households that are more dependent on home equity were more affected by the crash in house prices than upper-income households that benefited more greatly from the stock market recovery after the recession (Pew Research Center, 2020; OECD, 2021h).
Wealth polarisation index and wealth gini coefficient, 1989-2019
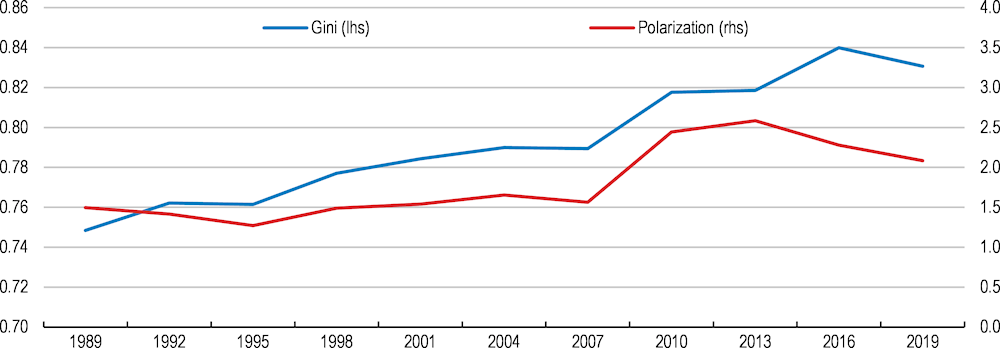
Note: Calculated with household data from the Survey of Consumer Finances. The sample was restricted to households with a household head between 24 and 64 years old.
Source: Survey of Consumer Finances.
Racial and ethnic inequality is an important component of overall income and wealth inequality in the United States. According to data from the Census Bureau, Black-headed households are significantly over-represented in the bottom-half of the income distribution, and under-represented particularly at the very top of the distribution: in 2019, only 5% of Black-headed households had incomes higher than US$200,000, whereas 10% of all US households were in this category. The results are broadly similar for Hispanic-headed households (Congressional Research Service, 2021). Additionally, the average white family has eight times the wealth of the average Black family and five times the wealth of the average Hispanic family, and wealth inequality has not improved in recent years (Bhutta et al, 2020). This inequality in wealth is related to lower access to housing and education, lower participation in retirement accounts and emergency savings accounts, and the lower prevalence of inheritances or gifts in Black and Hispanic families (ibid.).
Since the 1980s, a growing number of studies have mentioned the phenomenon of a “disappearing middle class” or a “hollowing out” or “polarisation” of the income distribution (Causa et al, 2014). Levy and Murnane (1992) noted that standard inequality measures cannot distinguish polarisation, which they define as a distribution in which observations move from the middle of the income distribution towards both tails, from other forms of inequality. In Wolfson (1994, 1997), the author defined the conceptual differences between polarisation and inequality and constructed a comparable index that measures the polarisation of a given distribution. The author also showed, using data on Canadian incomes, that “the divergence between polarization and inequality is not merely a theoretical curiosity; it occurs in practice as well”.
Wolfson (1994, 1997) defined a more polarised income distribution as one that is more spread out from the middle and with a tendency toward bimodality (a grouping of observations at both higher and lower levels of income). The figure below illustrates the difference between polarisation and inequality. It shows two hypothetical income distribution density functions: The first is a uniform density, shown by a dashed line; the second, shown by a black line, shows a clearly more bimodal and polarised distribution density that is the result of a set of progressive mean-preserving transfers. While the distribution has become more polarised, these transfers have been designed so that the resulting distribution is more equal under any inequality measure that is consistent with the Lorenz criterion, such as the Gini coefficient. This is therefore an example in which polarisation and inequality go in different directions.
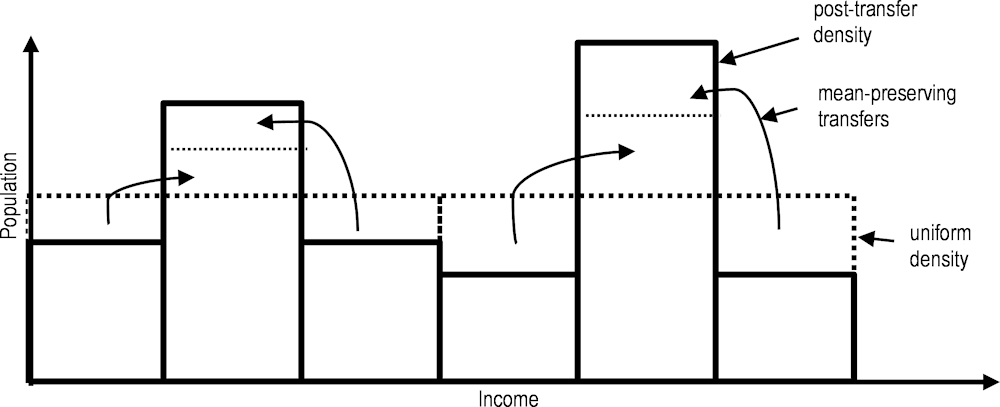
Source: Wolfson (1994)
Wolfson (1994) built an index that measures the polarisation of a distribution based on the Lorenz Curve of the income distribution, which shows the cumulative proportion of income held by the bottom x% of people (or households, depending on the unit of observation). Specifically, the polarisation index constructed by Wolfson is a function of the area between the Lorenz Curve and the tangent at the 50th population percentile (the median), which is shown as the shaded area in the figure below. Income distributions that have a higher concentration of the population in the middle of the distribution will result in a Lorenz Curve that is closer to the median tangent and lower polarisation. The polarisation index can be written as follows:
The polarisation index P has a minimum of zero for a perfectly equal distribution and a maximum of one for a perfectly bimodal distribution with half the population at zero income and the other half at twice the median income. However, P can take values higher than one if negative values are considered (this is the case when we calculate the polarisation of the distribution of net wealth of the United States, where a significant part of the distribution has negative net wealth).
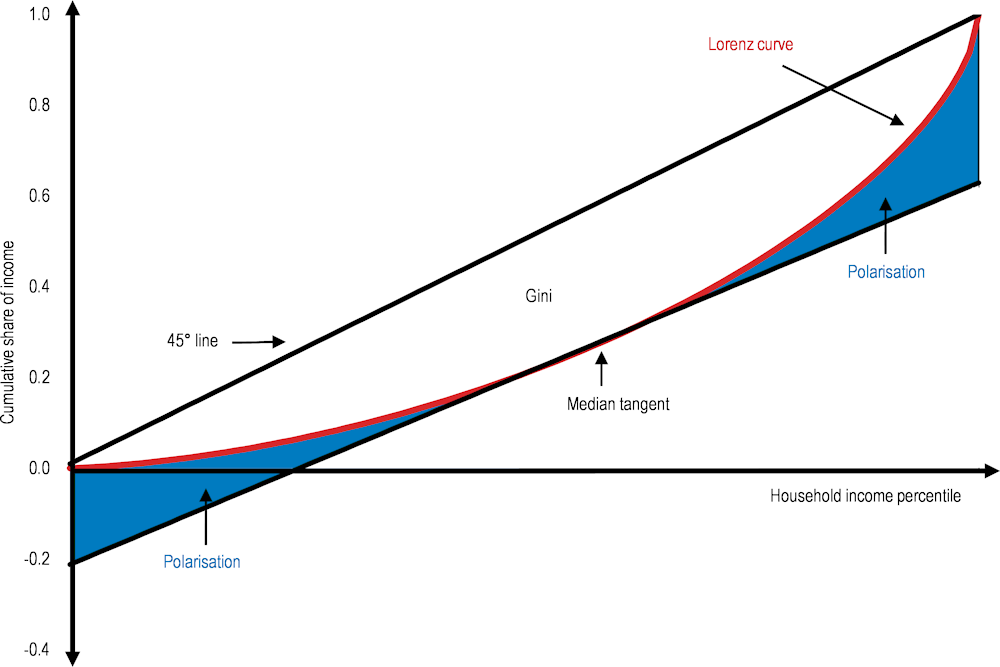
Source: Wolfson (1994)
While the COVID-19 crisis impacted lower-wage US households the most, the middle class was also significantly affected (see Stantcheva 2022 for a survey of the literature on the impact of the COVID-19 crisis on inequality). Employment losses in the United States were concentrated in low- to mid-wage sectors and occupations in food services, recreation, accommodation and health services. According to data collected by the Bureau of Labor Statistics, employment in leisure and hospitality decreased by close to 50% by mid-April 2020 compared to the beginning of the year. Employment losses were also severe in retail, transportation, education and health services. As a result, employment rates decreased by 37% by mid-April among workers in the bottom wage quartile and 23% among workers in the two middle wage quartiles (those earning between US$27,000 and US$60,000 a year), while employment losses for high-income workers were much more modest (-13% by mid-April) according to the Opportunity Insights Economic Tracker. Data on employment by level of education show a similar pattern: the employment-to-population ratio for workers with less than a high school diploma fell more sharply than that for high-school graduates, which in turn fell more than that for those with a bachelor’s degree and higher. Employment rates also recovered more quickly for those with a bachelor’s degree and higher.
Despite significant employment losses at the bottom and middle of the income distribution, disposable incomes actually rose on average for these same households on account of the unprecedented fiscal response from US federal and state governments (Blanchet, Saez and Zucman, 2022; see Figure 2.17 in Chapter 2). The CARES Act passed by Congress in March 2020 provided a US$1,200 cash payment to every tax-filing adult (with an additional US$500 per child), expanded tax credits (the expanded child tax credit and the expanded earned income tax credit for adults with children) and expanded unemployment benefits. As a result, the average disposable income of the households in the bottom 50% of the income distribution rose by more than 45% in April 2020 (Figure 3.10). These cash payments and extended unemployment benefits also benefited the middle class, whose average income rose more than 20% in April 2020. With expanded unemployment benefits extended and new rounds of cash payments introduced (US$600 in January 2021 and an additional US$1400 in March 2021), the disposable incomes of households at the bottom and middle of the income distribution remained higher in December 2021 than pre-pandemic. This was despite an incomplete labour market recovery, with more than 3 million fewer jobs than before the COVID-19 crisis. In fact, the Urban Institute’s Supplemental Poverty Measure fell significantly in 2020 (Urban Institute 2021).
Average real monthly income of the bottom 50% and middle 40% of households, decomposed
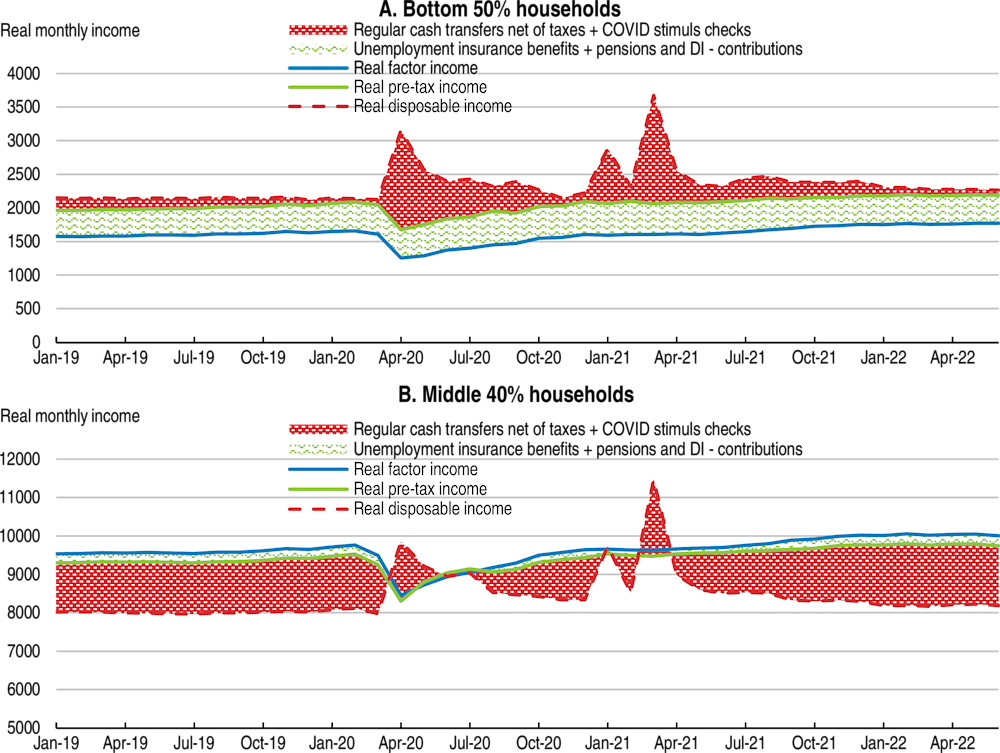
Note: In 2021 dollars. Factor income is income from labour and capital. Pre-tax income is factor income after net pension, unemployment and disability insurance benefits (net of contributions). Disposable income is pre-tax income minus taxes, plus all transfers (e.g. food stamps and COVID stimulus checks). Transfers net of taxes, shown as the red area, are positive when disposable income is above pre-tax income and negative when it is below. Likewise, net pension, unemployment and disability insurance benefits, shown as the green area, are positive when pre-tax income is above factor income, and negative when it is below.
Source: Realtime Inequality.
As government support fades, inequality could rise again as disparities across occupations, industries and regions resurface (Stantcheva, 2022). There is also evidence that the pandemic had an unequal impact on education and learning as schools closed and learning moved online. According to data from Opportunity Insights, participation in online math coursework was significantly more impacted for lower- and middle-income students than for higher-income students (Bacher-Hicks et al 2021 show similar findings). The unequal loss of learning could have longer-term impacts for inequality and for the productivity of the US economy as a whole (Psacharopoulos et al, 2020; Fuchs-Schündeln et al 2020).
US households on average have seen their wealth rise since the pandemic, but wealth gains during the pandemic were particularly strong at the top of the wealth distribution, resulting in higher wealth concentration (Blanchet, Saez and Zucman, 2022). While real wealth per household rose 25% on average between the end of 2019 and the end of 2021, the average real wealth of households rose 32% for the top 0.1% of households, resulting in a 1.2 percentage point increase in the share of wealth of the top 0.1%, to 19.9% of total wealth. The rise in wealth concentration during the pandemic was comparable if not larger than the rise that occurred during the Great Recession. However, since the beginning of 2022, corrections in equity and bond markets have reversed the differences in average real wealth growth between groups, as wealthier households hold a larger proportion of their wealth in financial assets.
Average real wealth growth, by wealth group
Surveys conducted since the start of the COVID-19 pandemic also show that middle-income families struggled both financially and psychologically in the United States as in other OECD countries (Household Pulse Survey; Pew Research Center, 2020b; OECD, 2021f; OECD Risks That Matter 2020 Survey). According to the Household Pulse Survey, roughly 30% of middle-income households reported feeling anxious and 20% reported feeling depressed through the pandemic. Over 60% of middle-income households also reported having trouble paying bills, including medical bills, energy bills, and rent or mortgage, despite the abundant fiscal support. A survey by the Pew Research Center reported that 12% of middle-income respondents were not able to afford food or had to get food from food banks or charitable organisations (Pew Research Center, 2020b). More recently, the steep rise in energy and food prices following Russia’s invasion of the Ukraine has put further strain on household finances. According to the National Energy Assistance Directors Association, more than 20 million American families (about one in six) are behind on their utility bills, and the average amount owed has increased from about US$403 in December 2019 to US$792 in August 2022.
While the pandemic has highlighted the important impacts the lack of child care (which in this report refers to care for children aged 18 months to 3 years old) can have on labour market participation, access to child care in the United States and its affordability were already low by international standards before the COVID-19 crisis, especially for low- and middle-income families. Expanding access to child care and making it more affordable can have many benefits for families and the economy as a whole.
Improving access to child care can have strong multigenerational benefits. For children, attending high quality early childhood education contributes to better outcomes later in life. Early childhood is a critical time for the development of the human brain, which reaches 90% of its adult size by the age of six (Stiles and Jernigan, 2010; Shonkoff and Phillips, 2000). Early learning can therefore have important longlasting effects on future educational attainment, employment, health, earnings and wellbeing, with larger effects for children from disadvantaged socioeconomic backgrounds(see OECD 2018 for a survey of the literature). However, ensuring that early care and education is of high quality is integral, given past evidence of low-quality early care being associated with small or even slightly negative benefits (Britto, Yoshikawa and Boller, 2011; Howes et al., 2008).
For parents, easy access to affordable child care can boost lifelong earnings. Lack of access can result in parents (most often mothers) leaving the labour force, reducing working hours, or postponing education or training (Gould and Blair 2020; OECD, 2017, 2011; UNICEF, 2019, Olivetti and Petrongolo 2017, Gurrentz 2021, Malik 2018). Improving access to child care can therefore result in higher labour force participation (see Figure 3.12) and human capital accumulation in the country as a whole and consequently higher potential growth and fiscal revenues. Making child care more affordable can also have significant positive impacts on fertility (Browne and Neumann, 2017; Blau, 2001; see Baker, Gruber, and Milligan, 2008 for an impact study of Quebec’s Family Policy), an important consideration given the burgeoning pressures of an ageing population (see Macroeconomic Policy Insights chapter).
Improving affordability and enrolment in child care in the United States would contribute to higher labour force participation, especially for women. Enchautegi et al (2016) find that higher public expenditures on child care subsidies increased employment rates for eligible mothers. Several studies based on survey data also suggest a link between child care and maternal employment in the United States (Schochet, 2019; Morrissey, 2016). The lack of access to child care during the COVID-19 crisis seems to have weighed on labour force participation. Caregiving burdens contributed substantially to low labour force participation, with the increase in nonparticipation for caregiving reasons accounting for a large part of the decline in labour force participation among women and men to a lesser extent, based on self-reported data in the Current Population Survey (Montes, Smith and Leigh, 2021).
Labour market participation of women whose youngest children are under age 3 years and enrolment rates in formal
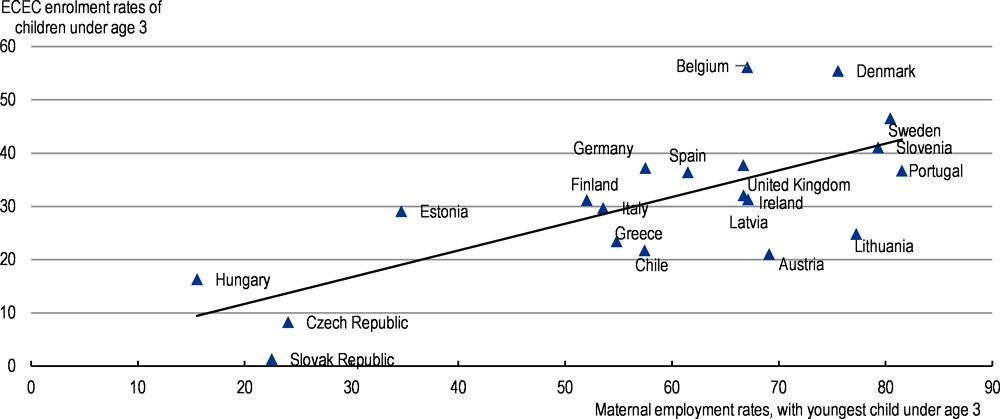
Note: Data generally include children enrolled in ECEC (ISCED Level 0) and other registered ECEC services (ECEC services outside the scope
of ISCED Level 0 because they are not in adherence with all ISCED criteria). Data for Denmark, Finland and Spain include only ISCED Level 0.
Employment rates refer to women aged 25-54 years whose youngest children are aged 0 to 2 years.
Source: OECD Family Database, http://www.oecd.org/els/family/database.htm.
The availability of child care centers in the United States is low and child care costs are high by international comparison, which results in low enrolment. According to an analysis of child care supply at the census tract level (Center for American Progress, 2018), 51% of Americans live in a “child care desert”, meaning areas with little or no licensed child care centers. While rural areas are more likely to have insufficient child care provision (59% are child care deserts), many urban neighborhoods also lack sufficient child care (56%), with child care deserts being more common in lower-income areas.
For most families, child care costs relative to earnings in the United States are among the highest in OECD countries, after accounting for child care benefits and tax deductions (OECD 2020a, see Figure 3.13). While the average net cost of child care in the OECD for a family with two median earners and two children is 17.5% of earnings, the corresponding figure is around 35% in the United States, making child care one of the main expenses for these families after mortgage or rent. In 2016, the cost of full-time child care from birth to four years old in the United States was higher than the cost of in-state college tuition and 85% of median rent (Schulte and Durana, 2016). However, among the countries with high costs, the United States (along with Canada) provides an exceptional amount of support for eligible single parents with low earnings, resulting in zero net costs of child care for these families after accounting for benefits and tax deductions. Therefore, assuming that these families receive the benefits they are eligible for (which is often not the case due to insufficient funding as explained in section 1.2.3), high child care costs are primarily a challenge for low-income two-earner families and middle income families. Child care costs as a percent of household income also vary greatly across states: according to Schulte and Durana (2016), child care costs are highest in terms of household income in West Virginia, and lowest in North Dakota.
Typical net childcare costs for two children in full-time care, 2019, in % of women’s median full-time earnings, by family type and in-work earnings
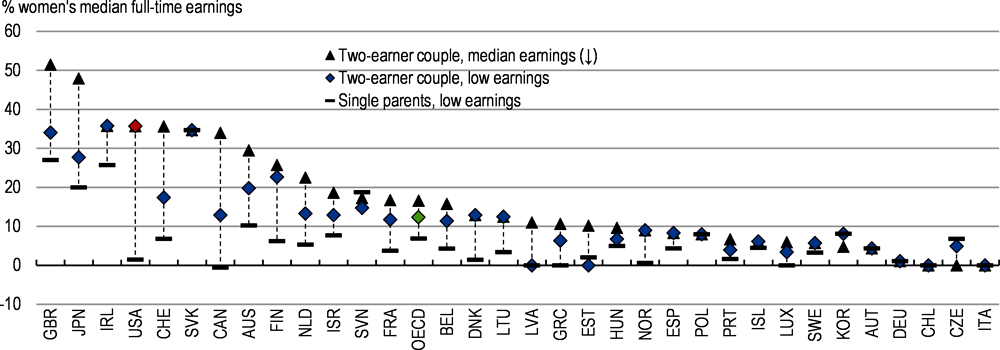
Note: Data reflect the net cost (gross fees less childcare benefits/rebates and tax deductions, plus any resulting changes in other taxes and benefits following the use of childcare) of full-time care in a typical childcare centre for a two-child family, where both parents are in full-time employment and the children are aged 2 and 3. 'Full-time' care is defined as care for at least 40 hours per week. Low earnings refer to the 20th percentile, and median earnings to the 50th percentile, of the full-time gender-specific earnings distribution. Two earners are assumed for couples, male and female. For single parents, women’s earnings distribution is assumed. In countries where local authorities regulate childcare fees, childcare settings for a specific sub-national jurisdiction is assumed. For Korea, the results refer to 2018; for Chile to 2015. For Mexico, Turkey and New Zealand information on childcare fees is not available. For Japan, data reflect the situation before the expansion of free ECEC to all children aged between 3 and 5, and to infants aged 2 and under from low-income families, in October 2019.
Source: OECD (2020), from OECD Tax and Benefit Models, 2019. http://oe.cd/TaxBEN.
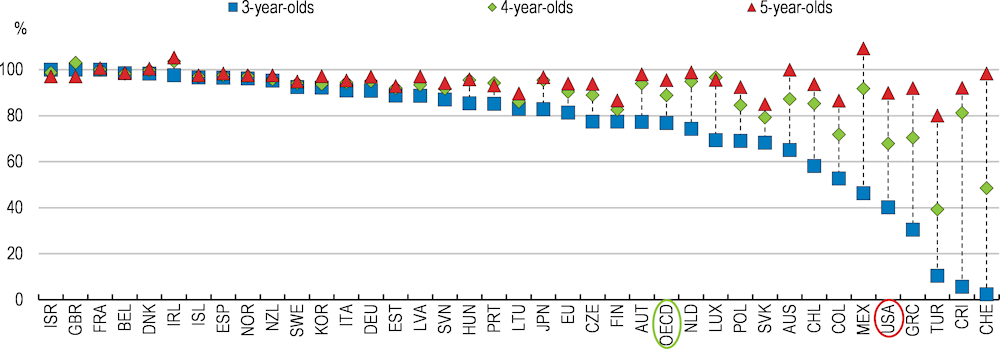
Percent of children enrolled in early childhood education and care (ISCED 2011 level 0) or primary education (ISCED 2011 level 1), 3-, 4- and 5-year-olds, 2018 or latest available year
Note: Data forGreece, New Zealand, and Poland refer to 2017. Data include children enrolled in early childhood education and care (ISCED 2011 level 0) and primary education (ISCED 2011 level 1). For Greece, data include only part of the children enrolled in Early childhood development programmes (ISCED 01). Potential mismatches between the enrolment data and the coverage of the population data (in terms of geographic coverage and/or the reference dates used) may affect enrolment rates. See OECD Education at a Glance 2019 Indicator B2 (http://www.oecd.org/education/education-at-a-glance-19991487.htm) for more details.
Source:OECD Education at a Glance 2020: OECD Indicators.
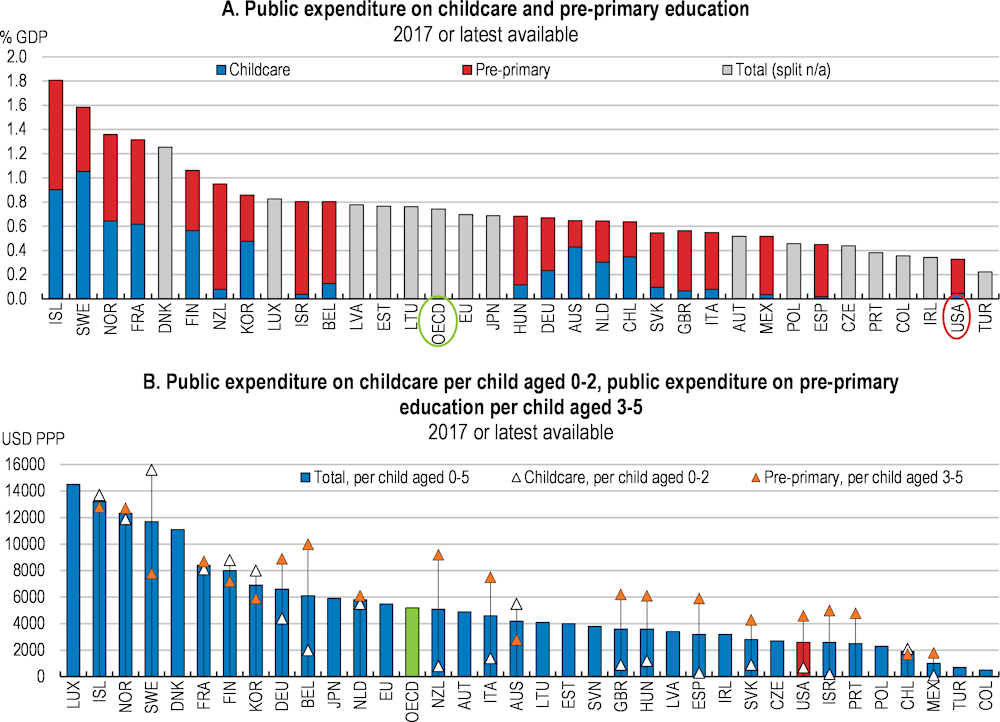
As in other countries, staff salaries represent the largest cost to child care providers in the United States. Regulations that vary by state typically require low children-to-staff ratios, which translates into high labour costs. For example, Early Head Start programmes serving a majority of children under 3 years old must have two teachers for no more than eight children or three teachers with no more than nine. For older children, the average children-to-staff ratio in pre-school programmes in the United States, at around 10-to-1, is below the OECD average (OECD, 2020b). While these and other regulations (including health and safety standards, for example) contribute to the high costs of child care in the United States, these are not significantly more stringent than in other countries and are in most cases appropriate to ensure minimum quality. However, the United States stands out as one of the countries with the least public expenditure on child care, which results in the comparatively very high costs for American households (see section 3.2.3 below).
The lack of availability and affordability of child care in the United States has resulted in low enrolment. Enrolment rates for children between 3 and 5 years old (the ages at which children in the United States typically join preschool) is below the OECD average and has not improved since 2005 (see Figure 3.14). While there is no available internationally-comparable data for enrolment rates of children below the age of 3, enrolment rates at age 3 in the United States (40% in 2018) are significantly below those at ages 4 and 5, and well below the OECD average (77% in 2018). Separate data from the Early Childhood Program Participation Survey shows that 52% and 56% of 1 and 2 year-olds respectively attend nonparental child care programmes at least once a week in the United States, compared to 68% and 77% for 3 and 4 year-olds respectively (NCES, 2018). This data also shows that attendance rates by household income level fall slightly for families living above the poverty line before rising for higher-income households, possibly reflecting the drop-off in eligibility for state- and federally-funded programmes for middle-income families.
Low access to child care adds to the parental burden in the United States, which is the only country among 45 countries covered by OECD data without national mandated paid maternity and parental leave (although some states have state-mandated paid leave plans, including California, New Jersey, New York, Rhode Island, Washington and the District of Columbia). This is an additional strain for parents with children too young to be eligible for child care. According to the Bureau of Labor Statistics, only 23% of US workers had access to paid family leave benefits in 2021 (up from 9% in 2008), mostly through employer-sponsored benefit plans, while 89% had access to unpaid family leave benefits. Across the OECD, mothers were entitled to a total of 51.5 weeks of paid leave on average in 2020, with average payment rates ranging from 25% to 100% of earnings, while total paid leave reserved for fathers averaged 8.7 weeks. In Canada, for example, the government mandates both the length of parental leave as well as the benefits parents receive, with parents being entitled to 15 weeks of maternity leave (for the mother), and an additional 40 weeks of parental leave shared by the parents, with a 55% benefit payment rate. Paid leave for mothers can improve their health and well-being and boost female employment, while paternity leave can help reduce the burden on mothers and improve health and development outcomes for children (OECD 2017d). Unlike fathers, mothers in the United States experience long-term earnings penalties when a child is added to their household, leading to a gender-earnings gap that persists for at least a decade (Kleven et al, 2019).
Yearly public investment in child care in the United States is 0.05% of GDP, or US$700 per child, among the lowest in the OECD (see Figure 3.15). State and federal funding for child care consists of programmes targeted specifically at children from low-income families that provide child care assistance through subsidies or grant-funded care slots. Early Head Start, a programme introduced in 1994 and administered by the Department of Health and Human Services, serves low-income families with children under three. Through this programme, local public agencies, school systems and private entities receive grants from the federal government to operate centre-based, home-based and family child care services that must adhere to Head Start Program Performance Standards relating to staff qualifications, staff-child ratios, training and professional development.
States also provide financial assistance for child care to low-income families through block grants from the Child Care and Development Fund (CCDF), created in 1996. State programmes can set stricter income levels for eligibility than the federal limit (85% of state median income), as well as different parent co-payment amounts, provider reimbursement levels, and other requirements.
Coverage of the existing policies is inadequate. Only 15% of federally-eligible children – and 23% of state-eligible children – received child care subsidies in 2017 according to the Department of Health and Services (Chien, 2021). In other words, funding for existing programmes is insufficient to cover even the eligible population, despite the fact that eligibility for these programmes is targeted towards children from poorer families. In 2021, funding for the CCDF was US$5.9 billion (0.03% of 2019 GDP) after it was increased by US$85 million in response to COVID-19, while the allocation for Head Start, which includes Early Head start, was US$10.7 billion (0.05% of GDP). For most families, the only direct source of government support for child care is the child and dependent care tax credit, which benefits higher earners most.
To reach middle class families that face significant costs of child care, public funding for child care would have to be significantly increased, possibly by raising funding for the CCDF and Early Head Start as well as the levels of income eligibility. Countries that have succeeded in providing affordable child care on a wide scale have invested substantial public resources. Sweden, for example, spends 1.1% of GDP on child care. A variable fee system depending on income that would cap family copayments at a certain proportion of income for middle-income families and that would ensure no copayments for low-income families could be used to avoid regressive effects. In states that do not participate in the expanded federal programme, funding could be directed at localities by expanding Early Head Start. A similar plan was recently proposed by the administration as part of the Build Back Better agenda. The Congressional Budget Office estimated that this plan, which expands the eligibility to subsidised child care to families earning up to 250% of the state median income and provides free preschool to all children regardless of family income, would add US$752 billion to the deficit over ten years, or slightly more than 0.3% of GDP per year. A recent study estimated that such a plan would raise full-time employment by 10 percentage points while also reducing family expenditures on child care services (Borowsky et al, 2022).
Note: In some countries local governments play a key role in financing and providing childcare services. Such spending is comprehensively recorded in Nordic countries, but in some other (often federal) countries it may not be fully captured by the OECD social expenditure data.
Source: OECD Social Expenditure Database.
Given the importance of the quality of child care, regulations should ensure minimum quality standards and a tiered quality rating system consistent across states could be established. Child care licensing, regulations and quality rating systems and their coverage differ from state to state, with some states requiring child care providers to participate in rating systems while others do not. Establishing minimum federal standards for the provision of child care (similar to Head Start Performance Standards) would ensure that all child care providers meet minimum standards set at the federal level. In addition, the Quality Rating and Improvement System (QRIS), a rating system for child care providers, could be revised and harmonised across all states, and data collection could be improved to monitor child care quality. In Australia, the National Quality Framework, established in 2012 and replacing 9 separate regulatory frameworks, includes laws and regulations that apply in every state and territory as well as a National Quality Standard against which care providers are continuously assessed and given ratings by state and territory agencies. A national body, Australian Children’s Education and Care Quality Authority, is responsible for overseeing the national framework.
The new programmes in the United States could also prioritise grants and contracts with child care centers to provide slots for children over direct subsidies to families. Grants and contracts in which providers are paid based on enrollment rather than attendance would make revenue more predictable and funding more stable, resulting in better outcomes for children and parents (Krafft et al, 2017; Forry and Hofferth, 2011). The significant increase in public investment in child care should also be accompanied by provider- and state-level systems capacity building to ensure the delivery of quality programmes.
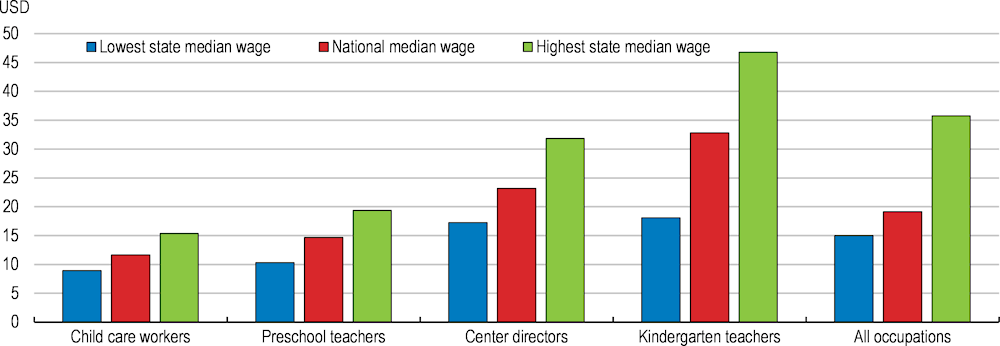
Special attention should also be given to raising child care worker salaries. Child care workers in the United States are poorly paid compared to teachers of older children (see Figure 3.16), and in many cases their low income qualifies them for public financial assistance (Department of Health and Human Services and Department of Education, 2016). In fact, child care workers show high rates of utilisation of public income support programmes such as the Federal Earned Income Tax Credit (EITC), Medicaid, the Children’s Health Insurance Program (CHIP), the Supplemental Nutrition Assistance Program (SNAP), and Temporary Assistance for Needy Families (TANF). In 2019, the 1.1 million people employed in the child care sector earned a median wage of US$11.65 per hour (Center for the Study of Child Care Employment, 2021). Of these 1.1 million people, 90% were women, of whom 40% were women of colour and were paid less on average (Austin et al, 2019). Low wages and insufficient benefits have led to high rates of yearly turnover in the industry, recently reaching 40% according to Joughin (2021) (Porter, 2012, reported 30% average yearly turnover). High turnover rates can affect the quality of child care given the importance of developing relationships between workers and children for their cognitive, social and emotional development. Very low wages can also have a detrimental impact on the quality of care given, as economic insecurity can have a psychological toll on workers that may affect their well-being and behaviour at work.
Median hourly wage by occupation and in the highest/lowest earning states, 2019
Source: Center for the Study of Child Care Employment (University of California, Berkeley) and Occupational Employment Statistics Survey (Bureau of Labor Statistics).
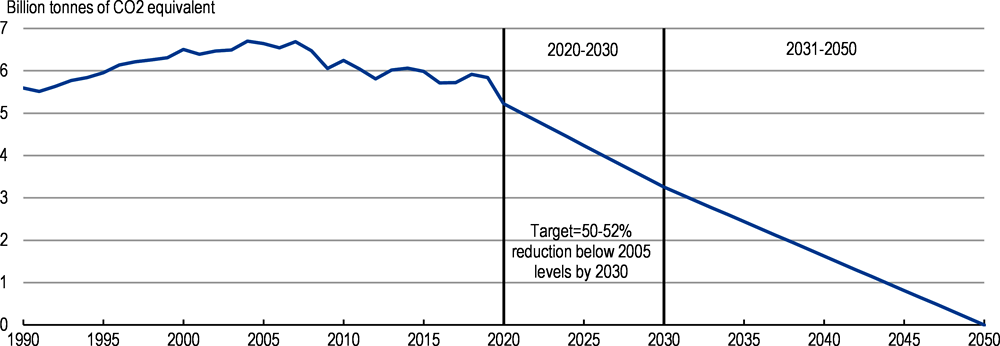
The administration has announced ambitious policy targets for reducing greenhouse gas emissions. The 2030 Nationally Determined Contribution is to reduce greenhouse gas emissions by 50-52% below 2005 levels (Figure 3.17). In addition, the United States has committed to a goal of achieving net zero greenhouse gas emissions by no later than 2050. These targets imply that the pace of carbon cuts needs to accelerate significantly, a considerable endeavour that will have large macroeconomic and redistributive consequences. Greenhouse gas emissions per capita in the United States are among the highest in the OECD (Figure 3.18). The pace of the transition towards net zero emissions and the ambition of the policies required to achieve it will inevitably have important economic implications for different households, regions and industries. The transition entails a large reallocation of jobs and capital from high-carbon to low-carbon activities, which has already started to occur. Housing and transportation, which account for a large part of US greenhouse gas emissions, will have to rapidly decarbonize. In the absence of compensation measures, improving the energy efficiency of their housing and transportation will entail significant costs for middle class households.
The administration has noted that all viable routes to net zero emissions involve five key transformations: i) decarbonise electricity (a goal of 100% carbon pollution-free electricity by 2035 is also in place), ii) electrify end uses and switch to other clean fuels areas where electrification presents technology challenges, iii) improving energy efficiency, iv) reduce methane and other non-CO2 emissions and v) scale up CO2 removal (United States Department of State and the United States Executive Office of the President, 2021). To achieve these emission reduction targets, a well-balanced policy mix of regulatory measures, investment and pricing is needed, as well as structural reforms promoting growth and the reallocation of resources.
Total greenhouse gas emissions, required trajectory to achieve net zero by 2050
Note: A projection is shown for 2021 data given the lag in data availability.
Source: OECD, Environment Statistics (Air and Climate) - GHG emissions database; OECD calculations.
Total greenhouse gas emissions including LULUCF, tonnes of CO₂ equivalent per capita, 2020
To achieve climate goals, greenhouse gas emissions will have to fall significantly in all sectors of the US economy. Accounting both direct and indirect emissions associated with electricity use, the industrial sector is the largest contributor to greenhouse gas emissions in the United States (the largest sources of emissions in this sector are the substitution of ozone depleting substances and the production of cement, iron, steel and metallurgical coke). Decarbonising this sector will require improving energy efficiency, fuel switching and a higher use of recycling. The most carbon intensive parts of the industrial sector may suffer job losses, the implications of which are discussed in Section 3.3.3. The household sector will also have to significantly reduce emissions. In 2020, residential greenhouse gas emissions accounted for 15% of total emissions (see Figure 3.19), while transportation accounted for 27%, slightly below emissions from industry and due in large part to emissions from light-duty vehicles used by most American households as well as from air transport. While decarbonising electricity production will significantly contribute to reducing emissions in the residential and commercial sectors, increasing the energy efficiency of commercial and residential buildings will be important. Finally, emissions from agriculture, which have not fallen since the 1990s, will also have to be reduced to alleviate the burden of the transition on other sectors.
US greenhouse gas emissions with electricity-related emissions distributed to economic sectors
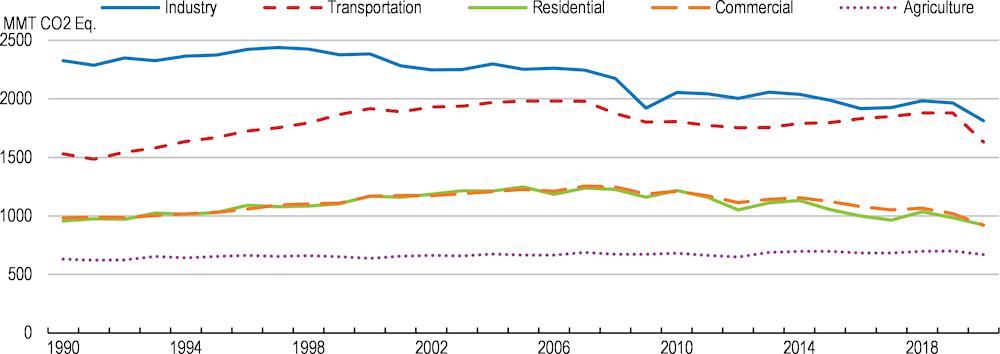
Note: Emissions and removals from Land Use, Land Use Change, and Forestry are excluded from figure above. Excludes U.S. Territories.
Source: EPA (2022).
Total greenhouse gas emissions in the United States have steadily fallen since their peak in 2004 (see Figure 3.17). This decline has been driven by a shift in the energy mix from coal and oil towards natural gas (which emits around 50% less CO2 than coal according to the US Energy Information Administration), as well as a growing but still low share of the energy supply generated from renewables such as wind and solar. The shift towards natural gas was driven by the shale revolution, which was made possible by technological breakthroughs in hydraulic fracturing and horizontal drilling and has resulted in a significant increase in production. Despite the increase in power generation from renewables in the last decade, the United States is still highly dependent on fossil fuels to cover its primary energy demand. Fossil fuels accounted for 82% of total primary energy supply in 2018, the eleventh-highest share among International Energy Agency (IEA) member countries (IEA, 2019; Figure 3.20).
The growing share of natural gas and renewables in the US energy mix has resulted in a steady reduction in emissions intensity (see Figure 3.21 Panel A). Nevertheless, emissions intensity remains high by international comparison and will have to come down considerably for the United States to achieve its targets of emissions reduction (Figure 3.21 Panel B). To achieve this, the energy mix will have to significantly shift away from fossil fuels and towards lower-emission sources of energy. Additionally, the energy efficiency of different sectors of the economy such as industry, housing and transportation will have to be greatly increased (see Figure 3.19).
Breakdown of total primary energy supply in IEA member countries, 2020
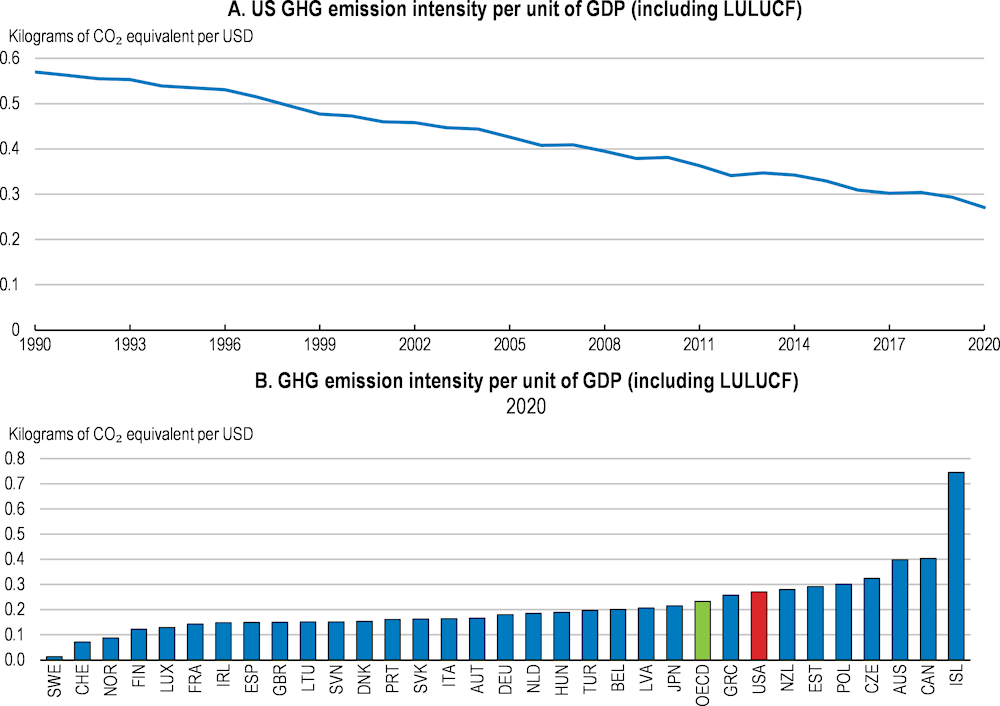
Note: Emission intensities per unit of GDP reflect the economy’s efficiency in decoupling emissions from output, considering countries’ different levels of economic development and growth. The indicator is expressed in tonnes of CO2-equivalent per unit of GDP in thousand US$ at 2015 prices and PPPs and as % change. Data refer to net annual greenhouse gas emissions (CO2, CH4, N2O, HFCs, PFCs, SF6, NF3), including emissions and removals from LULUCF.
Source: OECD, "Air and climate: Greenhouse gas emissions by source", OECD Environment Statistics (database).
The climate transition has the opportunity to spur economic growth and improve well-being (OECD, 2017b). Mitigation policies and greater regulatory and tax certainty can act as long-term signals and encourage investment and innovation. Public investment in green and climate-resilient infrastructure and reforms that improve resource allocation will promote more sustainable growth. The considerable increase in private and public spending on clean energy technologies needed to achieve net zero emissions can stimulate output and create a large number of jobs, particularly in engineering, manufacturing and construction (IEA, 2021). Decisive climate mitigation and adaptation policies will also help prevent damages from climate change that pose an important threat to economic growth and well-being, including damages from flooding of coastal regions and extreme weather events as well as heat waves and poor air quality, which disproportionately affect more socially vulnerable populations in the United States (EPA, 2021).
As in other OECD countries, the United States has managed to achieve a decoupling of emissions from economic growth (see Figure 3.22). OECD-wide evidence indicates that implementing stringent environmental policies has had limited aggregate effect on economic performance so far despite achieving significant environmental benefits (OECD, 2021b). However, environmental policies generate winners and losers as capital and labour is reallocated from high-emission to low-emission industries and firms. They can also have important socio-economic impacts: as labour will need to be reallocated across sectors, some workers may be left behind; households will also have to change their behaviour and potentially spend significant amounts of their wealth on new more energy-efficient vehicles, appliances and home refurbishments.
Total growth over the period 1990-2019
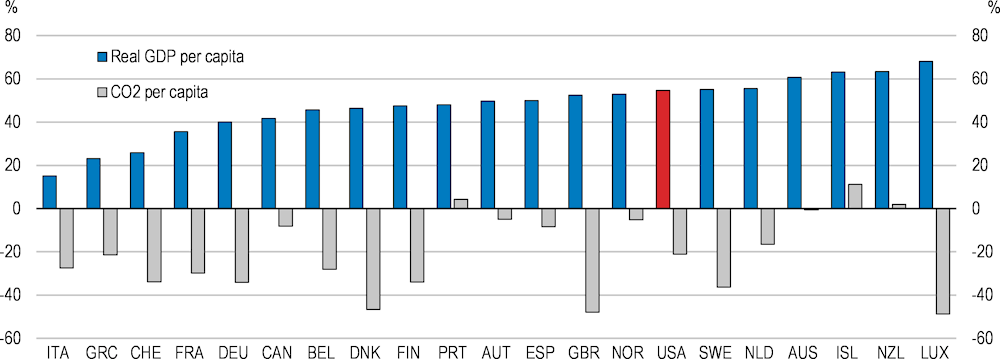
Note: 1991-2019 for Germany. CO2 emissions exclude land use, land use change and forestry and are consumption-based: emissions caused in the production of imported goods are included while emissions embedded in exports are excluded.
Source: OECD, Economic Outlook database; Our World in Data.
Climate policies that do not take into account within-country emissions inequalities and the redistributive effects of these policies are unlikely to find public support and may fail as a result, as illustrated by the Yellow Vests movement in France in 2018 and recent protests over fuel tax hikes in Ecuador and Chile in 2019. Global emissions inequalities (i.e., the inequality of greenhouse gas emissions between individuals at the world level) are mainly accounted for by emissions inequality within countries (World Inequality Report, 2022). Within-country emissions inequalities now account for nearly two thirds of global emissions inequality, up from 37% in 1990 (Chancel, 2021).
In the US, poorer households contribute significantly less to total emissions than richer households. This should be reflected in the design of carbon reduction policies, ensuring that poorer households do not disproportionately carry the costs. Doing so can ensure that climate policies are seen as fair and can gain public support. Figure 3.23 shows the extent of estimated emissions inequality in 2019. The average per capita emissions of the top 10% by income were 74.7 tonnes of CO2 equivalent per person per year, more than 3.4 times larger than the average per capita emissions of the middle 40% (22 tonnes), defined here as the population earning more than the bottom 50% but less than the top 10%, and more than 7.5 times larger than the emissions of the bottom 50% (9.7 tonnes). Using population forecasts, the pledge by the United States to reduce emissions by 50-52% by 2030 can be translated into per capita emissions: to achieve the target, average per capita emissions, which were 22.1 tonnes per year in 2019, will have to fall to 10 tonnes per capita per year. In the United States, the bottom 50% by income is already below the 2030 per capita target, while the top 10% would have to cut emissions by close to 90% to reach the per capita target, and the middle 40% by around 50%.
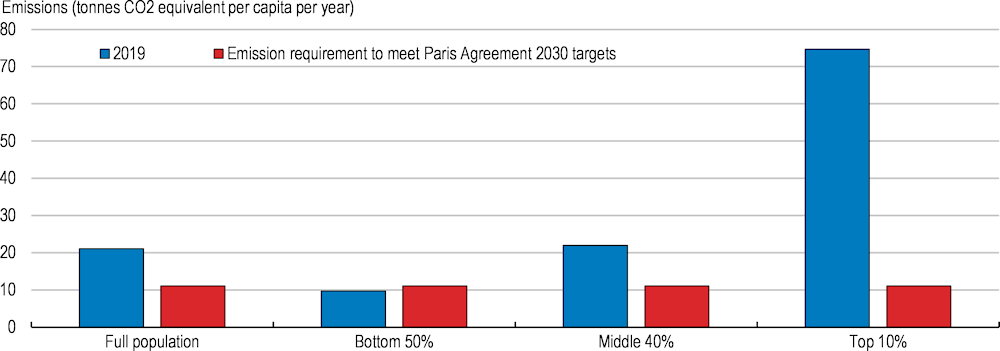
Note: Individual carbon footprints include emissions from all greenhouse gases stemming from domestic consumption, public
and private investments as well as imports and exports of carbon embedded in goods and services traded with the rest of the world.
Modeled estimates based on the systematic combination of national accounts, tax and survey data, input-output models and energy
datasets. Emissions are split equally within households.
Source: World Inequality Report 2022 and Chancel (2021).
Uncompensated climate policies can be costly for lower- and middle-income households (OECD, 2022). The extent of the distributional effects of different policies depends on the consumption baskets of different groups, their sensitivity to prices, and how higher costs pass through to the rest of the economy (Reguant, 2019; Zachmann, Fredriksson and Claeys, 2018). For example, low-income households spend a higher share of their incomes on electricity, and their price elasticity is low given the inability to afford more energy-efficient appliances. As a result, an uncompensated carbon price in the electricity sector may have regressive effects and affect low-income households more severely. On the other hand, higher-income households use air travel more often than average, likely resulting in a progressive effect of carbon pricing on air transport. This is particularly relevant in the US context, given that changes to carbon pricing policies are one of the potential paths for achieving emission reduction targets at least economic cost. At present, only 11% of emissions from the United States are priced at or above EUR120 per tonne of CO2, a central estimate of the carbon costs in 2030 (Figure 3.24), and this is entirely due to high fuel excise taxes in some states. Outside of the road sector, tax rates on energy use are effectively zero (OECD, 2019). This partly reflects the fact that the United States does not levy a carbon tax and there is no federal emissions trading system for CO2 emissions, though there are subnational systems.
Looking forward, a range of policies aimed at further emission mitigation are likely to be needed. These could include renewable energy incentives, further government support for R&D for transformative technologies, as well as a range of investments to help reduce emissions across the economy (including in transportation, power, the building sector and industrial sectors). Some of the measures included in the recent Infrastructure Investment and Jobs Act and Inflation Reduction Act were an example of the latter. The Inflation Reduction Act expands clean energy tax credits for wind, solar, nuclear, clean hydrogen, clean fuels and carbon capture, including production tax credits as well as investment tax credits (see Box 2.8 in Chapter 1). In addition, making greater use of pricing mechanisms could promote behavioural change and innovation, with a first step being more uniform pricing of emissions across sectors. While not without limitations, the Pan-Canadian Approach to Carbon Pollution Pricing is an example of such an approach in a federal country (Box 3.2). Pricing should be calibrated to reflect the externalities of different activities. The Inflation Reduction Act introduced a methane waste emissions charge for oil and gas facilities reporting methane emissions greater than 25,000 metric tons of CO2 equivalent gas per year. This charge is the first federal fee on any kind of greenhouse gas emissions.
Carbon pricing, percentage of emissions priced at or above the benchmark, 2018
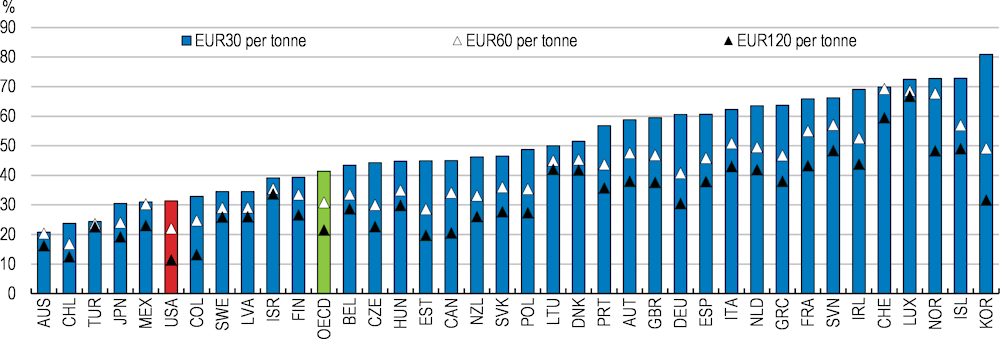
Note: The first benchmark, EUR 30 per tonne of CO2, is an historic low-end price benchmark of carbon costs and a minimum price level to start triggering meaningful abatement efforts. The second benchmark, EUR 60 per tonne of CO2, is a forward looking 2030 low-end and mid-range 2020 benchmark. The third benchmark, EUR 120 per tonne of CO2, is a central estimate of the carbon costs in 2030.
Source: OECD Effective Carbon Rates 2021.
Canada’s federal structure and assignment of responsibilities make it imperative for the federal, provincial and territorial governments to work closely together to translate international climate commitments into domestic action. The 2016 Pan-Canadian Framework on Clean Growth and Climate Change represents a nationwide strategy for achieving this. Carbon pricing is a foundation of the framework, with the other pillars being complementary mitigation action across sectors; adaptation and climate resilience; and clean technology, innovation and jobs.
A form of carbon pricing applies across the country using a benchmark approach. Since 2019, provinces and territories have had to implement their own carbon pricing scheme, taking the form of either a carbon tax, a cap-and-trade system, credit trading programmes for large emitters or a hybrid approach. Each carbon pricing system must meet the benchmark set by the federal government. In 2021, the government released an update to the benchmark, with the minimum national carbon pollution price to rise from CAD 50 per tonne in 2022 to CAD 170 per tonne in 2030 (Government of Canada, 2021).
For any jurisdiction that lacks a system aligned with the benchmark, a federal carbon pricing backstop system applies in the form of a fuel charge, an output-based pricing system for large emitters, or both. The direct revenue remains in, or is returned to, the jurisdiction in which it originates. One of the drawbacks of the original framework prior to the recent update to the benchmark is that provincial and territorial carbon pricing systems differed widely in terms of emission coverage, effective carbon price and cost burden on industry.
Source: OECD (2021c); Government of Canada (2021).
Since climate mitigation policies that seek to reduce personal emissions can prove individually costly (e.g. carbon taxes, or regulations that require purchasing a new, more energy-efficient vehicle or appliances, or retrofitting housing), revenue-recycling schemes using revenue raised from carbon pricing policies have emerged as a possible solution to increase the public acceptability of these policies and to avoid imposing excessive costs on less wealthy households. Switzerland offers a good example of an effective carbon tax that gained public support through a combination of lump-sum rebates, and transparent revenue use and flexiblity, although an increase in this tax was recently rejected (see Box 3.3 below). A new OECD survey conducted in the United States as well as in Denmark, France, Germany and the United Kingdom investigates the public acceptability of different climate adaptation policies and revenue-recycling schemes. As in the other surveyed countries, a significant majority of surveyed Americans (76%) agree that climate change is an important problem, but respondents disagreed on the policies to address it, with only 36% supporting a tax on flying or on fossil fuels (see Box 3.4). A majority of respondents also underestimate the necessary policy stringency to reduce emissions and are unwilling to forego certain comforts. However, careful explanation of the mechanisms of climate change or of specific policies have a positive impact on the acceptability of mitigation policies. Efforts should be made to narrow knowledge and information gaps, engage with stakeholders and interest groups transparently in the design of climate policy packages, and address perceptions of distributional fairness through public outreach campaigns.
In 2008, Switzerland introduced high carbon pricing on heating fuels to reach its annual carbon targets. The price was set at CHF 96/tCO2 in 2018 (around 104 US$/tCO2) and has risen to CHF 120/tCO2 in 2022 (around 130 US$/tCO2). In 2018, 75% of CO2 emissions from energy used were priced by the Swiss carbon tax, its emissions trading system, or the fuel excise, and 69% of them at a rate exceeding EUR 60/tCO2 (OECD, 2019).
The federal government adopted a number of measures to address distributional and competitiveness concerns (OECD, 2021e). Eligible firms can be exempted if they commit to undertake specific abatement measures or targets. About two-thirds of the tax revenue was redistributed through a lump-sum rebate of social security contributions of around EUR 80 per person and reimbursement of firms proportional to their wage bill. The remaining third of tax revenue is earmarked for retrofitting works and the development of sustainable heating fuels.
The level of the carbon tax is set every year depending on the country’s climate performance and its success in meeting interim annual objectives, adding another incentive for abatement. In June 2021, a federal vote rejected increasing the maximum tax rate up to CHF 210/tCO2 (EUR 194/tCO2) and broadening the tax base.
Source: OECD (2021)
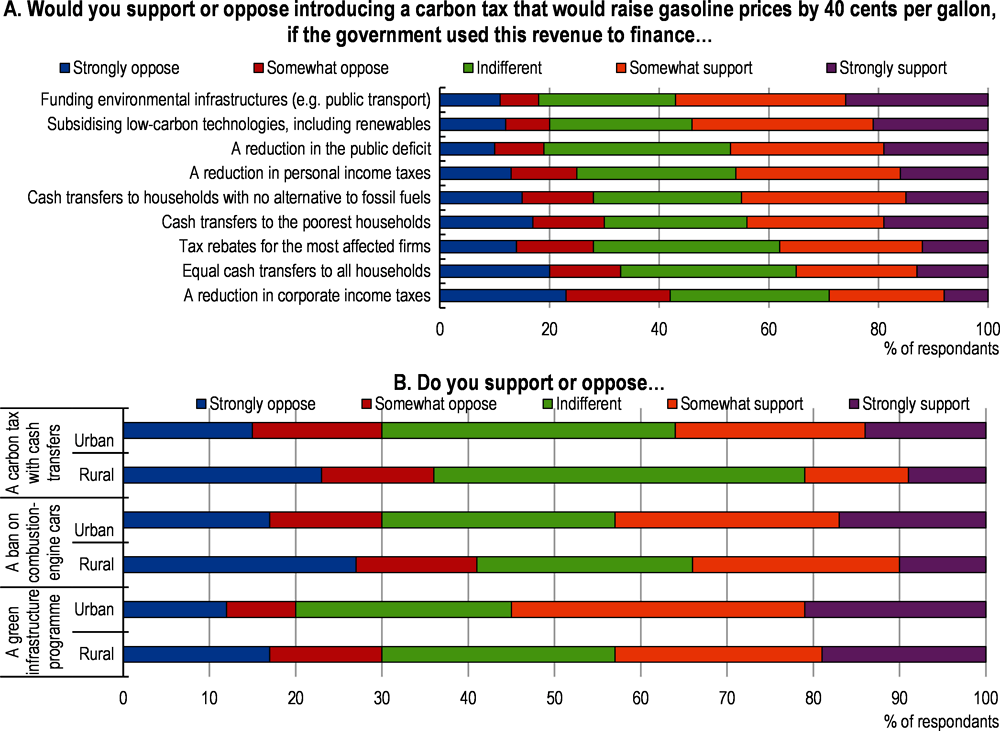
The OECD led a survey in 2021 on the acceptability of climate policies in the United States, Denmark, France, Germany and the United Kingdom. The survey sample includes 2,218 respondents in the United States, representative along gender, age, income, region and rural/urban dimensions.
The survey results suggest that Americans are generally less favourable towards climate mitigation policies than respondents from the four other surveyed countries, although this depends on the specific policies that are proposed (Figure 3.25). For example, there seems to be little opposition to a carbon tax that would raise gasoline prices by 40 cents per gallon if the revenue is used to fund infrastructure investment, to subsidise low-carbon technologies, or to reduce the deficit (Figure 3.26). However, respondents from rural areas are consistently more opposed than urban respondents to climate mitigation policies including a carbon tax with cash transfers, a ban on combustion-engine cars and a green infrastructure programme.

Source: Boone, L., Dechezleprêtre, A., Fabre, A., Kruse, T., Planterose, B., Sanchez-Chico, A., and Stantcheva, S. (forthcoming),
Understanding public acceptability of climate change mitigation policies across OECD and non-OECD countries, OECD publishing, Paris.
United States, 2021
Source: Boone, L., Dechezleprêtre, A., Fabre, A., Kruse, T., Planterose, B., Sanchez-Chico, A., and Stantcheva, S. (forthcoming),
Understanding public acceptability of climate change mitigation policies across OECD and non-OECD countries, OECD publishing, Paris.
Revenue raised from carbon pricing policies could be recycled by increasing investment in green infrastructure and clean technologies, a measure that a majority of US households surveyed by the OECD would support (see Figure 3.26 Panel A). Part of the revenues could also be recycled via tax cuts or lump sum transfers for the most vulnerable households, to help with the transition and raise the social acceptability of these measures. Different revenue-recycling measures accompanying climate policies such as emissions pricing can have different distributional effects. Lump-sum (or fixed) transfers are less redistributive than targeted transfers, but the latter can also be harder and costlier to administer. The distributional effects of revenue-recycling through tax cuts can also be different depending on the taxes that are reduced. Recycling revenue through capital tax cuts is highly regressive and inefficient (Goulder at al, 2019), while reducing labour taxes can be progressive given the larger share of labour income for lower- and middle-income households compared to high-income households (see Figure 3.27 for a recent analysis based on US survey data). While some revenue-recycling measures may be more efficient than others in terms of emissions reduction, recent studies suggest that the tradeoff between equity and efficiency may not be large, with the choice of revenue-recycling schemes having less of an effect on efficiency than on their distributional impacts (García-Muros, Morris and Paltsev, 2022).
In the following sections, the distributional impacts of climate policies are discussed in the context of the labour reallocation arising from the transition from fossil fuel to renewable energy production and lowering emissions in the household sector (as regards housing and transport energy efficiency), with a focus on the US middle class.
% change in income across income quintiles, United States, 2015
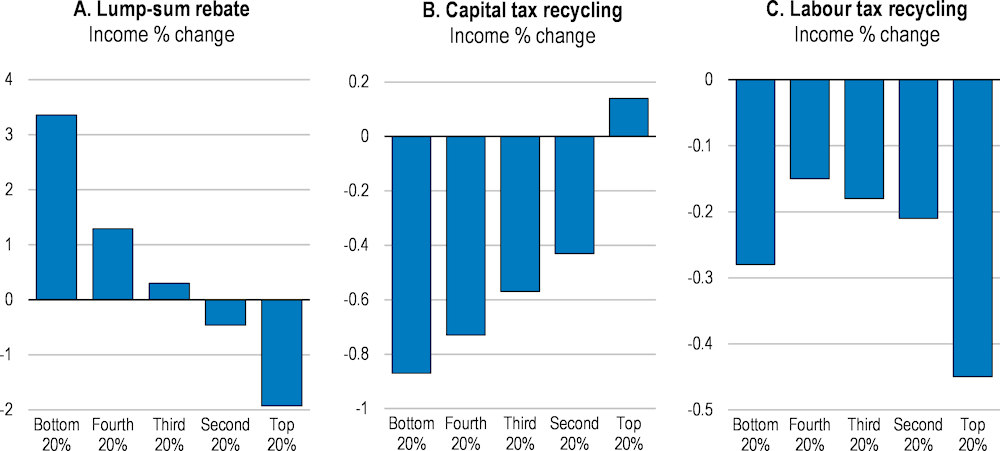
Note: The y-axis represents the percentage change in income, omitting the environmental benefit of the carbon tax from reduced greenhouse gas and air pollution.
Source: Williams, Burtraw and Morgenstern (2015).
Job losses or income losses in carbon intensive parts of the economy is another channel through which climate policies can have regressive effects (i.e. “source-side” income effects; OECD, 2022). These consequences are expected to be shouldered by labour more than capital through wage reductions and job losses (OECD, 2012), especially by lower-skilled and lower-wage workers (Chateau, Bibas and Lanzi, 2018; Marin and Vona, 2019).
Certain jobs and sectors will be particularly impacted by the climate transition (Chateau et al, 2018; CBO, 2010). The shift in resources from high-emission to low-emission industries may involve significant economic and welfare costs given that the skills required for brown jobs are not completely transferrable to those required for green jobs (ILO, 2011). Some green jobs require higher levels of education, work experience and on-the-job training, and use higher levels of cognitive and interpersonal skills (Consoli et al, 2016; Vona et al, 2018). High-emission jobs also tend to be geographically concentrated, and the climate transition will therefore have outsized impacts on particular regions heavily dependent on these jobs and industries for income, revenue and investment, reducing their capacity to finance structural adjustment programmes to reduce the negative welfare effects of the transition (Morris, Kaufman and Doshi, 2019; Elgouacem et al., 2020). It is also unclear to what extent green jobs can be created in the most affected regions. For example, renewable power generation facilities have to be placed near the natural resource they exploit, unlike fossil fuel power plants (OECD, 2017b). Recent research using online job postings data encouragingly suggests that new solar and wind energy jobs tend to be located in counties with high shares of employment in fossil fuel extraction, which should lessen the amount of geographical reallocation needed during the climate transition (Curtis and Marinescu, 2022). The same study also indicates these jobs are created in higher-paying occupations, with higher pay premiums for jobs with low educational requirements.
Under the IEA’s Sustainable Development Scenario, which assumes that the US pledge of net zero emissions by 2050 is achieved in full, oil and natural gas consumption is set to decline by almost half by 2040, US coal consumption is set to fall by 90% during the same period due to its high emission intensity and substitutability (Raimi, 2021; IEA, 2021). Coal consumption and employment in the coal industry has already fallen significantly due to increased automation and the emergence of low-cost alternatives (Coglianese et al, 2020), with national coal-related employment declining from 170,000 in 1985 to 50,000 in 2020 (BLS, 2020), with significant economic impacts in the regions where these jobs were most concentrated (See Box 3.5 on the decline of coal-related employment in the Appalachian region). These jobs can be considered as middle class jobs given that they offer higher pay than regional averages (Raimi, 2021). Coal-related employment is so important in certain US counties that the share of total employment can reach more than 15% and the share of total wages sometimes reaches more than 30%, as is the case in Wyoming County in West Virginia, for example.
To facilitate the reallocation of workers in highly carbon intensive sectors, barriers to labour mobility should be reduced. Rationalising obsolete occupational licensing systems throughout the economy can help improve labour mobility. Regional and sectoral mobility could also be promoted through a subsidy covering the cost of occupational licensing for workers that lose their jobs in brown industries and wish to work in green industries. Furthermore, the federal government should provide fiscal incentives for states and localities to relax land use restrictions and promote multi-use zoning in order to ensure flexibility of housing supply in those regions with an increasing share of employment opportunities. By supporting housing supply, this will also promote affordable housing options.
Place-based policies are also essential, given evidence that labour mobility in places that experience economic shocks has tended to be low (Autor, Dorn and Hanson, 2021; CEA, 2022). These place-based policies will require the Federal Government to form partnerships with local communities to identify their needs and to take local conditions into account. Current resources from the Federal Government for these place-based policies are low and should be raised to avoid over-stretching state and local governments, where the majority of spending for these policies currently occurs (Bartik, 2020). The Inflation Reduction Act makes progress on this issue by including bonus tax credits for clean energy production and investments in communities with historic or current dependence on fossil fuels. Public expenditure on active labour market policies is low in the United States and should be increased, with a focus on job placement and cost-effective retraining policies. One example of such policies was recently legislated as part of the Inflation Reduction Act, which includes US$200 million in grants for training contractors involved in installation of home energy efficiency and electrification improvements. Local R&D, economic development and improvements in social conditions through higher quality healthcare and transport policies can help sustain economic growth and living standards in the most affected regions. Ensuring that unemployment insurance systems in those regions are efficient and provide adequate protection will be essential. Local governments should be empowered to design and develop local training programmes given the large variation in industrial structure and employment opportunities across regions. A number of OECD countries have established “just transition” authorities involving a variety of stakeholders from different levels of government, academia and the private sector to help plan for the climate transition. In Germany, a “Coal Commission” (the Commission on Growth, Structural Change and Employment) was established to propose policies for a just transition for coal regions and employees. This Commission was composed of representatives from the energy sector, trade unions, industries, citizen initiatives and NGOs.
The Appalachian coal region is a mountainous region covering Alabama, Eastern Kentucky, Maryland, Ohio, Pennsylvania, Tennessee, Virginia, and West Virginia. Appalachia was the United States’ primary coal-producing region from the 1800s through the 1970s. Due to reductions in the cost of natural gas and a regulatory environment that increased the cost of coal-generated electricity, coal production fell by more than 65 percent in the region between 2005 and 2020. Losses in coal production were highly concentrated in the Central Appalachian Coal Basin in southern West Virginia and eastern Kentucky (Bowen et al, 2020). During the same time, employment in the coal industry fell by 54 percent, with losses also concentrated in Central Appalachia, with heavier losses in counties more reliant on the coal industry. In Mingo County, West Virginia, for example, coal mining employment fell from 1,400 people in 2011 to 500 in 2016 (Morris, Kaufman and Doshi, 2019). There is also evidence of labour market spillovers from mining to the broader economy (Houser et al, 2017). Given their heavy reliance on the coal industry, these counties have experienced large declines in county government revenue. In Boone County, West Virginia, for example, the number of mines declined from 31 in 2012 to 11 in 2017, and coal production fell 70 percent during this period. As a result, county property tax revenue declined by 50 percent, and total revenue declined by 28 percent. The fall in revenue in this county has resulted in school closures and other spending cuts on solid waste programmes, for example.
While there have been a number of local policy responses to the rapid decline of the coal industry in this region (Stroud et al, 2013), they have not been particularly successful. The large size of the Appalachian region and the fact that it covers a wide number of states and localities required a unified regional transition strategy that was lacking. There was no overall strategy for the transition and almost no pre-emptive planning (Sheldon, Junankar and Pontello, 2018). Additionally, support for innovation, education and training was insufficient, hindering re-skilling and the development of new employment opportunities in the region.
In contrast, the widely-regarded success of the transition from coal in the Ruhr region in Germany was driven by high engagement from federal and state governments, long-term top-down planning, collaboration between different levels of government and industries, investment in infrastructure, innovation, higher education and training, and substantial compensation for those leaving the labour market (Botta, 2018; Sheldon, Junankar and Pontello, 2018). In particular, older workers in the coal industry received early retirement payments as a form of transitional assistance for a maximum of five years until they were eligible for pension benefits. There was a strong emphasis on preventing lay-offs and therefore considerable investment in re-training younger workers (OECD, 2017c). Those who were able to relocate were hired mainly by small and medium sized companies in the electrical and metallurgical industry, in the services sector or by municipal fire brigades.
Given the differentiated impacts that the climate transition will have across regions and industries and its redistributive effects, a long term climate transition strategy developed at the federal level and involving state and local stakeholders that takes emissions inequalities and the redistributive and regional effects of climate mitigation policies into account will be crucial. While the Long-Term Strategy of the United States report is an appropriate first step, a more detailed plan will be necessary. The National Climate Task Force established by the Biden administration, which currently includes representatives from federal agencies and offices, could be expanded to include representatives from state and local governments, labour unions, advocacy groups, business and scientists. State-level climate transition plans could be coordinated at the federal level and feed into the national climate strategy, similar to the National energy and climate plans (NECPs) in the European Union.
In the long run, the national education system should be structurally adapted to prepare for the increased demand for green skills. This can be achieved by collaborating with the private sector to anticipate the green skills that will be crucial in a decarbonised economy and reviewing school curricula, and by surveying industry employment needs regularly as is done in the context of the Energy & Employment Report conducted by the National Association of State Energy Officials. Efforts should also be made to improve the collection of granular data on the occupational exposure to green technologies and production methods in order to identify the skills that are most needed to perform green tasks (see for example Vona et al, 2018). These could inform the curricula in universities, but also in vocational and on-the-job training courses.
Reductions in US household emissions from housing and transportation will be key to achieving the overall emission reduction targets. After distributing emissions related to electricity into end-use categories (i.e., after allocating emissions from electric power to the economic sectors in which the electricity is used), the residential and transportation sectors currently account for 15% and 27% of greenhouse gas emissions in the United States, respectively (EPA, 2022). Of greenhouse gas emissions from transportation, 57% is related to light-duty vehicles of the sort used by US households.
Greenhouse gas emissions from homes are composed of direct and indirect emissions. Direct emissions arise from fossil fuel combustion for heating and cooking (mainly from natural gas and petroleum products), leaks from refrigerants and waste management, while indirect emissions are due to the consumption of electricity and the fossil fuels used to generate it. While total emissions from homes have been decreasing since the mid-2000s (see Figure 3.19), most of this reduction has been due to falling indirect emissions as electricity production has shifted towards cleaner sources and more energy-efficient appliances have been adopted by households.
Indirect emissions related to the consumption of electricity generated from fossil fuels accounted for more than 60% of residential emissions in 2020 (EPA, 2022). Deep cuts in emissions from the residential sector can therefore only be achieved by combining production-side and consumption-side strategies. While increasing the energy efficiency of homes on the consumption side will be important to achieve climate goals, significant emissions reductions can also be achieved on the production side by further greening the power grid (Goldstein, Gounaridis and Newell, 2020). The US Energy Information Agency estimates that carbon fees could significantly reduce CO2 emissions from the electric power sector (EIA, 2021), and recent studies suggest that carbon pricing has had a significant effect on power sector decarbonisation in the United Kingdom (Leroutier, 2022)
Middle income households predominantly own and live in single family homes (Census, 2021). They are also more likely to live in older and leakier houses that predate modern residential building energy codes (Berkeley Lab, 2011). Such codes, which establish minimum energy efficiency requirements for new construction and renovations, were first enacted in the late 1970s and contain energy and water efficiency requirements for newly constructed buildings and alterations to existing buildings. These codes, however, are adopted and updated at the state level, resulting in a large variation in stringency across states (see Figure 3.28). Only a handful of states have adopted building energy codes that are up to date by international standards (California, Washington, and Vermont), while 8 states do not have a state-wide code (Alaska, Colorado, Kansas, Mississippi, Missouri, North Dakota, South Dakota and Wyoming). While it would be desirable for lagging states to update or establish more stringent residential building energy codes, it is unclear how much can be achieved at the federal level apart from incentivising these changes through conditional funding. There is also conflicting evidence on the size of the effect of these building energy codes on actual emissions, with some studies pointing to significantly larger effects than others (PNNL, 2021; Levinson, 2016). In addition, some studies have found that these building codes may have regressive effects (Bruegge, Deryugina and Myers, 2019). The Inflation Reduction Act includes US$1 billion in grants to state and local governments to adopt the latest building energy codes and to implement more stringent zero-energy codes for buildings with net zero energy consumption over the course of the year.
Status of State Residential Energy Code Adoption, 2022
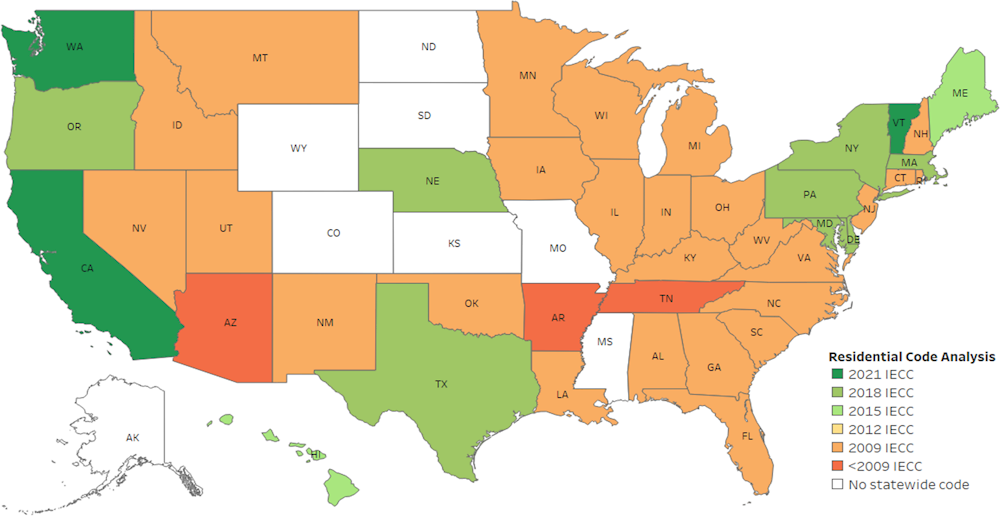
Note: Updated as of January 2022. IECC: International Energy Conservation Code. While some states adopt IECC codes directly, these international codes are amended in some states.
Source: Department of Energy, Office of Energy Efficiency & Renewable Energy.
Further reducing emissions from housing will require building more energy-efficient “green” housing and retrofitting existing homes to improve insulation and to make heating, cooling, ventilation, lighting and refrigeration systems more energy efficient. Additionally, appliances and electronics will also have to be replaced by more energy-efficient appliances. Studies show that the potential from building energy efficiency retrofits to reduce electricity use can be large, especially for the older building stock, and can result in significant job-creation (Deutsche Bank Climate Change Advisors and Rockefeller Foundation, 2012). The electrification of end-uses and switching to cleaner fuels when electrification is not possible can also be an important factor to reduce total emissions.
While improving the energy efficiency of homes will ultimately reduce energy costs for households and protect them from volatile and rising energy prices, home retro-fitting and the purchase of new and more efficient appliances can be costly upfront, especially for low- and middle-income households (DOE, 2012). Low- and middle-income households may also not have access to credit in order to invest in these home improvements. While lower-income households qualify for the Weatherization Assistance Program and the Low Income Home Energy Assistance Program, which offer energy efficiency measures at no cost to eligible households, middle-income households are not eligible for these programmes. However, the high correlation between household income and residential emissions suggests that the US households responsible for higher greenhouse gas emissions will be more financially capable to bear the costs of deep home retro-fitting (Goldstein, Gounaridis and Newell, 2020).
For households less financially capable of bearing the costs of deep home retro-fitting, financial support from governments, possibly partly financed by carbon pricing or carbon levies on certain activities, could be expanded. This could be achieved through an expansion of existing programmes such as the Weatherization Assistance Program or the Low Income Home Energy Assistance Program to cover middle-income households. A sliding scale of household contributions depending on income could be introduced to avoid any regressive effects and reduce the cost of these programmes. These subsidies could be administered through a refundable tax credit or direct cash transfers. In France, for example, a cash transfer (MaPrimeRénov’) has recently replaced a previously-existing tax credit for home retro-fitting. France has also outlawed the rental of extremely energy-inefficient housing starting in 2025, and plans to outlaw the rental of housing rated F or G according to its energy efficiency rating system starting in 2028. Although the relative stock of rentals is smaller in the United States, a similar policy could provide a strong incentive for energy efficient retrofits. Preferential lending mechanisms in the United States, such as Fannie Mae’s Green Financing Loans for multi-family buildings or the Federal Housing Administration’s Energy Efficient Mortgage Insurance, can also provide additional financing for investments in energy efficiency improvements. These programmes should be expanded to increase the total amount of financing of home improvements. As part of the Inflation Reduction Act, low- and middle-income households now benefit from up to US$14,000 in direct consumer rebates to purchase heat pumps, other energy efficient home appliances, and for upgrading home electric systems to support electrification. The legislation also extends and increases the existing tax credit for energy efficiency enhancing home improvements.
Given the long average lifespan of new homes, design and construction decisions such as heating systems, building material, and housing size and type are crucial for the decarbonisation of the housing stock. Therefore, updated building energy codes accompanied by the relaxation of regulatory deterrents to new housing, at both local and federal levels, can ensure that the housing stock becomes progressively more energy-efficient. Land-use policies should also be reviewed given that they also play an important role in shaping urban form, which has direct as well as indirect environmental implications.
Transportation was the second largest contributor to total greenhouse gas emissions in the United States in 2020, accounting for 27% of total greenhouse gas emissions, only slightly below the industrial sector (EPA, 2022). Within this sector, light duty vehicles, which include passenger cars and light duty trucks, were by far the largest category, with 57% of greenhouse gas emissions from transportation. Aviation accounted for 8% of transport emissions.
The stock of electric vehicles in the United States reached 1.7 million in 2020 (IEA, 2021b), and EVs represented 2% of total car sales. However, alignment with emissions targets will essentially require all new light-duty vehicles to be zero-emissions (i.e. electric and fuel cell) in the 2030s (IEA, 2021b). The federal target is for EVs to make up 50 percent of light-duty vehicle sales by 2030 (Executive Order on Strengthening American Leadership in Clean Cars and Trucks). Meanwhile, a number of states, including California, Massachusetts and the state of Washington, have announced more ambitious targets. In California, regulators recently approved a rule banning the sale of gas-powered cars by 2035, with intermediate sales share targets for zero emission vehicles of 35 percent in 2026 and 68 percent in 2030).
Regulatory frameworks and subsidies have enabled strong growth in EV sales in some countries in recent years. Many countries have tightened fuel economy standards and strengthened purchase incentives for EVs, and more than 20 countries have announced targets to phase out internal combustion vehicles over the next 10-30 years (see Figure 3.30). Additionally, as of April 2021, 70 subnational and city governments had announced 100% zero-emission vehicle targets or the phaseout of internal combustion engine (ICE) vehicles before 2050.
Governments with official targets to 100% phase out sales or registrations of new internal combustion engine cars by a certain date
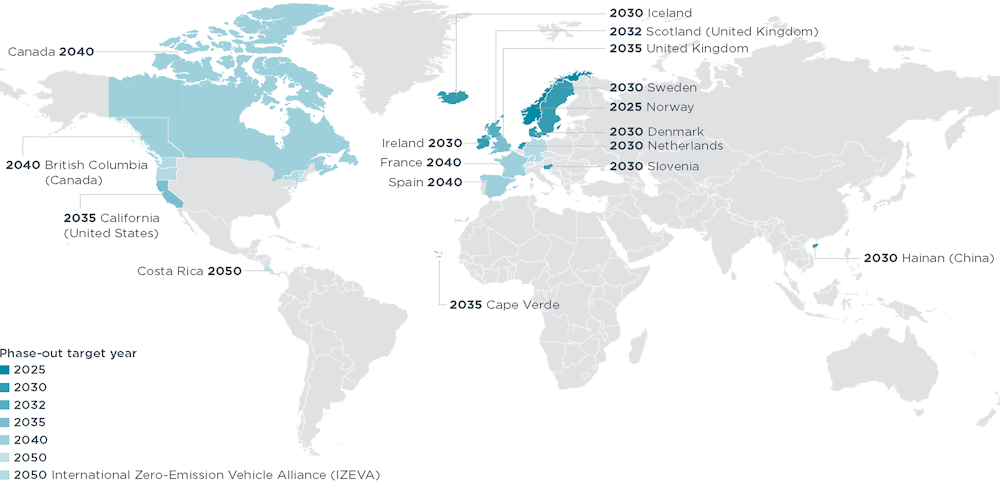
Source: International Council on Clean Transportation.
Policies to incentivise purchases of electric vehicles include differentiated taxation of vehicle registration, fiscal incentives for vehicle purchases, as well as complementary measures that enhance the value proposition of driving electric cars, such as preferential parking rates, road toll rebates and low-emission zones. The Inflation Reduction Act has introduced changes to the existing non-refundable federal tax credit of up to US$ 7500 for the purchase of an electric car in the United States. Due to a manufacturer’s phase-out cap, vehicles were no longer eligible once the producing company had sold more than 200,000 EVs, resulting in only 30% of EVs sold in the United States benefitting from federal tax credits in 2021. The manufacturer’s phase-out cap has now been eliminated by the Inflation Reduction Act. The Act also modified the conditions to access the tax credits: it has introduced household income limits and added car eligibility restrictions based on the price of the car, location of battery component assembly and production and the geographic origin of the critical minerals contained in the battery. Finally, the Inflation Reduction Act introduced new tax credits for second-hand and commercial clean vehicles, which are targeted towards low- and middle-income families.
There also exist a number of tax credits and purchase incentives in many US states. In California, families making less than 300% of the poverty rate are eligible for larger rebates, while the Cash for Clunkers program offers an additional $1,500 to low-income families retiring an old high-emissions vehicle. Increasing the taxation of gasoline and diesel will also reduce demand for internal combustion engine vehicles, while revenues could be used to compensate low- and middle-income households that are likely to be disproportionally affected, as well as to fund public transport infrastructure and reduce public transit fares. Given the relative inelasticity of demand for gasoline and diesel, another possible way to incentivise the production and demand for clean transportation technologies is through a “feebate” programme, which imposes fees on inefficient technologies and provides a rebate on efficient vehicles.
Greenhouse gas vehicle emissions standards in the United States are not as stringent as in other OECD countries and should be tightened to encourage the production of electric vehicles. The latest revision of fleet-wide standards by the Environmental Protection Agency envisages a tightening from 181 grams of CO2 per mile in 2022 to 132 g/mile in 2026 for cars. In the EU, the fleet-wide targets for cars set in the latest regulation are 153 g/mile for the period 2020 to 2024, with a further 15% reduction from 2025 and 37.5% reduction from 2030 on. To incentivise innovation and given that the share of gasoline-powered vehicle sales will remain high over the short term, the tightening of emissions standards in the United States should be accelerated, and the rules should cover a longer time-horizon than 2022 to 2026, as directed in the recent executive order on “Strengthening American Leadership in Clean Cars and Trucks”. Manufacturers have also accumulated a large amount of compliance credits over the past decade under the Averaging, Banking and Trading programme, allowing them to currently underperform the prevailing standards (EPA, 2021b). This stock of tradeable credits should be taken into account when setting the new levels of emissions standards to avoid significant underperformance in the future.
Funding should also be increased for charging infrastructure and grid services along critical transport routes and urban areas to encourage EV adoption. In 2020, China led the world in the amount of publicly available EV chargers with around 800,000 chargers installed. In Europe, the stock of EV chargers reached 290,000, while in the United States the stock was still below 100,000 in 2020, with only 17,000 having a charging power over 22 kW (see Figure 3.31). Fast chargers are particularly important to enable long-distance journeys and to encourage households without access to private charging to switch to EVs. In 2021, the Biden administration released an EV Charging Action Plan to support the deployment of EV chargers around the United States. The Department of Energy and the Department of Transportation have established a Joint Office of Energy and Transportation with the aim of deploying up to 500,000 EV chargers. The Infrastructure Investment and Jobs Act passed in November 2021 also includes US$5 billion over five years to be spent on building charging stations. In addition, the Inflation Reduction Act included measures to incentivise the development of alternative fuelling stations by extending the Alternative Fuel Refueling Property tax credit, which provides tax credits of up to US$1,000 for households to install charging stations, and up to US$100,000 for businesses. Particular attention should be given to ensure access to EV chargers for households that do not own a house with easy charging solutions. Possible solutions include promoting right-of-way charging and updating building and zoning codes to require EV-ready new construction.
EV chargers, United States, 2015-2020
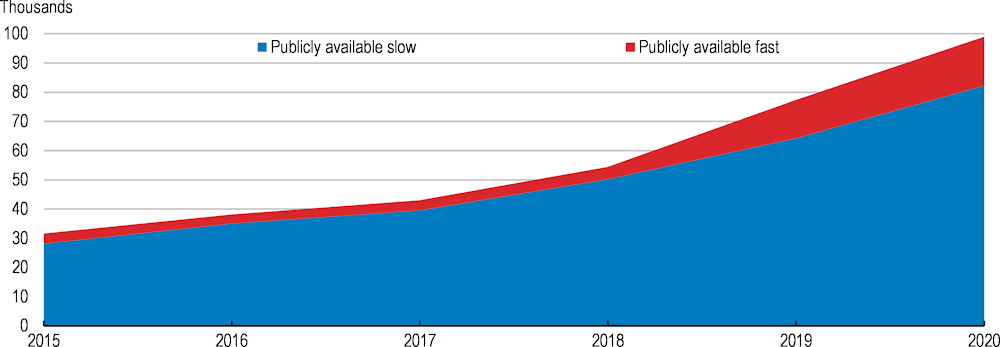
Note: Total stock of EV chargers. Fast chargers have a charging power above 22 kW. Slow chargers have a charging power below 22 kW.
Source: IEA Global EV Outlook 2021.
While widespread EV adoption will be important to reduce greenhouse gas emissions, improving public transportation networks and increasing the fleet of clean buses will also be crucial, especially for low- and middle-income households that cannot afford an electric vehicle or that do not own a house where they can install a charger. The Infrastructure Investment and Jobs Act raised funding for public transit to US$90 billion over the next five years to address a large repair backlog and replace deficient transit vehicles with zero emissions vehicles. A recent executive order also directs the federal government to purchase 100% zero-emission vehicles by 2035 for its fleet of cars and trucks. Investing in public transportation can encourage its adoption and reduce the use of greenhouse gas-emitting cars. However, public transport is generally a realistic alternative to cars only in compact urban areas with a high density of infrastructure services and shorter trip distances (OECD, 2022). Therefore, land use management and regulations can be an important tool to reduce transportation emissions by encouraging urbanisation, and these policies should be considered in an integrated manner.
Building a well-functioning public transportation system requires adequate regulatory power for authorities overseeing the sector, including for the setting of quality standards and the planning of network routes and services (OECD, 2021i). Additionally, while free public transportation or generalised subsidies are sometimes implemented to incentivise a shift from cars to public transportation, these policies are costly and also cause an undesired shift away from walking or cycling (ITF, 2017; Proost, 2018). Improvements in the quality of public transportation have been shown to cause larger modal shifts from cars to public transportation than generalised subsidies (UITP, 2014). These investments can be combined with targeted subsidies or differentiated fares to ensure affordability for lower-income users. Finally, while distance-based fares are seen as unfair given that they can penalise lower-income users living in the outskirts of urban areas and having to travel further, flat fares incentivise urban sprawl (ITF, 2018). This is a further reason to employ targeted subsidies in order to address equity concerns while preserving desired incentives.
|
MAIN FINDINGS |
KEY RECOMMENDATIONS |
|---|---|
|
Improving access to child care |
|
|
Enrolment in childcare in the United States is low compared to other advanced economies, especially for low and middle class households. Net childcare costs are among the highest in the OECD, and often exceed other essential costs of living such as housing and transportation, even for middle-income families. Total public investment in childcare is among the lowest in the OECD. Underfunding results in low participation in existing programmes relative to eligibility. |
Significantly increase public funding for childcare and expand the levels of income eligibility for public programmes. Establish system that would cap family copayments at a certain proportion of income for middle-income families and that would ensure no copayments for low-income families. Prioritise grants and contracts with child care providers over direct subsidies to families. |
|
Childcare quality across different centres is difficult to assess for families searching for care. . The high turnover rate of childcare staff, partly due to low pay, impacts quality given the importance of developing relationships between children and care-givers. |
Establish minimum federal standards for child care and implement a tiered quality rating system that is consistent across states and that accounts for differences across types of providers. Improve data collection to monitor childcare quality. Significantly raise wages for childcare workers by indexing them to local wage levels and reduce turnover. |
|
Supporting the middle class through the climate transition |
|
|
Total greenhouse gas emissions have steadily fallen since 2004, driven by a shift in the energy mix. Nevertheless, emissions intensity remains one of the highest in the OECD and needs to decline significantly to achieve emission reduction targets. Carbon pricing is lower than in other OECD countries. Outside of the road sector, tax rates on energy use are effectively zero. |
Make use of a broad range of climate mitigation policies to meet emission reduction targets, including regulation, public investment and carbon pricing. Recycle revenue raised from any carbon pricing policies by raising investment in green infrastructure and clean technology, and by compensating vulnerable households through targeted subsidies. |
|
Largely as the result of high social, geographic, and economic inequality in the United States, emissions inequality is high and climate policies can have differentiated effects across regions, industries and households. Careful explanation of the mechanisms of climate change or of specific policies seem to have a positive impact on the acceptability of mitigation policies. |
Develop a national climate strategy that explicitly takes into account emissions inequalities and the redistributive and regional effects of climate policies. Coordinate state-level climate transition plans that feed into the national climate strategy. Expand the National Climate Task Force to include representatives from state and local governments, labour unions, advocacy groups, business and scientists. Narrow knowledge and information gaps, engage with stakeholders and interest groups transparently in the design of climate policy packages, and address perceptions of distributional fairness through public outreach campaigns. |
|
Jobs in fossil fuel and energy intensive industries are geographically concentrated and are often held by middle class households. The climate transition entails a large reallocation of jobs and capital from high-carbon to low-carbon activities. The skills required in high carbon intensity jobs may be partly transferrable to jobs in low carbon intensity industries. However, the green transition may increase the future demand for new skills, including in science, technology, engineering and maths (STEM). |
Raise public expenditure on active labour market policies, with a focus on job placement and cost-effective retraining policies. Ensure that existing safety nets such as unemployment insurance are adequate in the states that will be most impacted by climate policies by expanding eligibility where needed. Provide fiscal incentives for states and localities to relax land use restrictions and promote multi-use zoning in order to increase housing supply in desirable locations. Promote regional and sectoral mobility through a subsidy covering the cost of occupational licensing for workers that lose their jobs in brown industries and wish to work in green industries. Empower local governments to design and develop local training programmes. Structurally adapt the education system to the increased demand for green skills. Continue surveying energy industry employment needs (as in the US Energy & Employment Report) and coordinating with the private sector. |
|
The residential sector accounts for 15% of total greenhouse gas emission in the United States. Reductions in household emissions will be key to achieving overall emission targets. Indirect residential emissions related to the consumption of electricity generated from fossil fuels accounted for more than 60% of residential emissions in 2020 and will be costly for households to reduce significantly. Residential building energy codes vary significantly across states, and some states do not have state‑wide codes. |
Expand existing weatherisation and retro-fitting programmes to cover middle-income households. Provide fiscal incentives for states to update their building energy codes. Consider outlawing the rental of extremely energy-inefficient housing. |
|
Transportation was the largest contributor to total greenhouse gas emissions in the United States in 2020, accounting for 27% of total greenhouse gas emissions. Alignment with emissions targets will essentially require all new light-duty vehicles to be zero-emissions in the 2030s. |
Accelerate the tightening of fuel efficiency and tailpipe CO2 standards. Provide tax credits and purchase incentives for electric vehicles targeted at low- and middle-income households. Increase funding for charging infrastructure and grid services along critical transport routes and urban areas. Improve the quality and availability of public transportation while ensuring any subsidies to encourage uptake are well targeted. |
Acemoglu, D. and P. Restrepo (2021), “Tasks, Automation, and the Rise in US Wage Inequality”, NBER Working Paper 28920.
Acemoglu, D. and P. Restrepo (2017), “Robots and Jobs: Evidence from US Labor Markets”, NBER Working Paper 23285.
Akcigit, U. and S. Ates (2021), “Ten Facts on Declining Business Dynamism and Lessons from Endogenous Growth Theory”, American Economic Journal: Macroeconomics, Vol. 13/1, pp. 257-298, http://dx.doi.org/10.1257/mac.20180449.
Alesina, A. and R. Perotti (1996), “Income distribution, political instability, and investment”, European Economic Review, Vol. 40/996, pp. 1203-1228,
Alichi, A., K. Kantenga and J. Solé (2016), “Income Polarization in the United States”, IMF Working Papers WP/16/121, International Monetary Fund.
Alichi, A., R. Mariscal and D. Muhaj (2017), “Hollowing Out: The Channels of Income Polarization in the United States”, IMF Working Papers WP/17/244, International Monetary Fund.
Austin, L. J. E., B. Edwards, R. Chávez, M. Whitebook (2019), “Racial Wage Gaps in Early Education Employment”, Center for the Study of Child Care Employment, University of California, Berkeley.
Autor, D., D. Dorn, L. F. Katz, C. Patterson and J. Van Reenen(2017), “Concentrating on the fall of the labor share”, American Economic Review: Papers & Proceedings, Vol. 107/5, pp. 180-185.
Autor, D., D. Dorn and G. Hanson (2021), “On the Persistence of the China Shock”, Brookings Papers on Economic Activity, BPEA Conference Drafts, September 2021.
Azar, J., I. Marinescu, M. Steinbaum and B. Taska (2020), “Concentration in US labor markets: Evidence from online vacancy data”, Labour Economics, Volume 66, October 2020.
Azzopardi , D., F. Fareed, M. Hermansen, P. Lenain and D. Sutherland (2020), “The decline in labour mobility in the United States: Insights from new administrative data”, OECD Economics Department Working Papers No 1644.
Bacher-Hicks, A., J. Goodman, and C. Mulhern (2021, January). Inequality in household adaptation to schooling shocks: Covid-induced online learning engagement in real time. Journal of Public Economics 193, 104345.
Baker, Michael, Jonathan Gruber, and Kevin Milligan. 2008. “Universal Childcare, Maternal Labor Supply, and Family Well-Being.” Journal of Political Economy 116, no. 4: 709–745. https://doi.org/10.1086/591908.
Barrow, R. and J.-W. Lee (2010) “Educational Attainment in the World, 1950-2010,” Vox, 2010, available at http://www.voxeu.org/index.php?q=node/5058.
Bartik, T. J. (2020), “Using Place-Based Jobs Policies to Help Distressed Communities”, Journal of Economic Perspectives, Volume 34, Number 3 Summer 2020, Pages 99–127.
Bassanini, A. and S. Scarpetta (2002), “Does human capital matter for growth in OECD countries? A pooled mean-group approach”, Economics Letters, Vol. 74/3, pp. 399-405, http://dx.doi.org/10.1016/s0165-1765(01)00569-9.
Bhutta, N., A. Chang, L. J. Dettling and J. W. Hsu (2020), “Disparities in wealth by race and ethnicity in the 2019 Survey of Consumer Finances”, FEDS Notes. Washington: Board of Governors of the Federal Reserve System, September 28, 2020, https://doi.org/10.17016/2380-7172.2797.
Birdsall, N. (2016), “Middle-Class Heroes”, Foreign Affairs, https://www.foreignaffairs.com/articles/2016-02-15/middle-class-heroes.
Blanchard, O. and L. Summers (1986). Hysteresis and the European Unemployment Problem. NBER macroeconomics annual 1, 15–78.
Blanchet, T., E. Saez and G. Zucman (2022), “Realtime Inequality: Preliminary Draft”.
Blau, David (2001), “The Child Care Problem: An Economic Analysis”, New York: Russell Sage Foundation.
BLS, Bureau of Labor Statistics (2021), “Current Employment Statistics (CES)”.
Borenstein, S. and J. B. Bushnell (2021), “Headwinds and Tailwinds: Implications of Inefficient Retail Energy Pricing for Energy Substitution”, NBER Working Paper 29118.
Borowsky, J., J. H. Brown, E. E. Davis, C. Gibbs, C. M. Herbst, A. Sojourner, E. Tekin and M. J. Wiswall (2022), “An equilibrium model of the impact of increased public investment in early childhood education”, NBER Working Paper 30140.
Botta, E. (2018), “A review of Transition Management strategies: Lessons for advancing the green low-carbon transition”, OECD Issue Paper
Boushey, H. and K. Vaghul (2016), “Women have made the difference for family economic security”, Washington Center for Equitable Growth.
Boushey, H. and A. S. Hersh (2012), “The American Middle Class, Income Inequality and the Strength of Our Economy”, Center for American Progress.
Bowen, E., Christiadi, J. Deskins and B. Lego (2021), “An Overview of Coal and the Economy in Appalachia: Fourth Quarter 2020 Update”, Bureau of Business and Economic Research).
Britto, P., H. Yoshikawa and K. Boller (2011), “Quality of early childhood development programs and policies in global contexts: Rationale for investment, conceptual framework and implications for equity”, Social Policy Report, Vol. 25/2, pp. 1-31.
Browne, J. and D. Neumann (2017), Childcare costs in 2015, OECD Tax wedge and effective tax rates on labour, OECD, Paris, https://taxben.oecd.org/tax-ben-resources/Childcare-costs-in-2015.pdf (accessed on 28 October 2019).
Brown, D. and W. Hunter (2004), “Democracy and Human Capital Formation”, Comparative Political Studies, Vol. 37/7, pp. 842-864, http://dx.doi.org/10.1177/0010414004266870.
Brueckner, M. et al. (2017), The Rise of the Middle Class and Economic Growth in ASEAN, The World Bank, http://dx.doi.org/10.1596/1813-9450-8068.
Bruegge, C., T. Deryugina and E. Myers (2019), “The Distributional Effects of Building Energy Codes”, Journal of the Association of Environmental and Resource Economists, Vol. 6/S1, pp. S95-S127, http://dx.doi.org/10.1086/701189.
Campbell, F. and C. Ramey (2010), “The Abecedarian Project”, in Reynolds, A. et al. (eds.), Cost effective programs in children’s first decade: A human capital integration, Cambridge University Press, New York.
Causa, O., S. Araujo, A. Cavaciuti, N. Ruiz, Z. Smidova (2014), “Economic Growth from the Household Perspective: GDP and Income Distribution Developments Across OECD Countries”, OECD Economics Department Working Papers No. 1111.
Cavalleri, M. C., N. Luu, O. Causa (2021), “Migration, housing and regional disparities: A gravity model of inter-regional migration with an application to selected OECD countries”, OECD Economics Department Working Papers No. 1691.
Center for the Study of Child Care Employment (2021), “The Early Childhood Educator Workforce”, Center for the Study of Child Care Employment, University of California, Berkeley.
CBO, Congressional Budget Office (2021), “The Distribution of Household Income, 2018”,
CBO, Congressional Budget Office (2010), How Policies to Reduce Greenhouse Gas Emissions Could Affect Employment, Economic and Budget Issue Brief, 5 May, Washington.
CEA (2022) “Economic Report of the President, 2022”, Council of Economic Advisers.
Chakravarty, S.R., and A. Majumder (2001): “Inequality, Polarization and Welfare: Theory and Applications,” Australian Economic Papers, 40, 1–13.
Chancel, L. (2021), “Global Carbon Inequality,1990-2019.” WID.world Working Paper 2021/21.
Chateau, J., R. Bibas and E. Lanzi (2018), “Impacts of Green Growth Policies on Labour Markets and Wage Income Distribution: A General Equilibrium Application to Climate and Energy Policies”, OECD Environment Working Papers, No. 137, OECD Publishing, Paris, https://dx.doi.org/10.1787/ea3696f4-en.
Chetty, R., N. Hendren, P. Kline, E. Saez and N. Turner (2014a), “Is the United States a Land of Opportunity? Recent Trends in Intergenerational Mobility”, American Economic Review: Papers & Proceedings 2014, 104(5): 141–147, http://dx.doi.org/10.1257/aer.104.5.141
Chetty, R., N. Hendren, P. Kline and E. Saez (2014b), “Where is the Land of Opportunity? The Geography of Intergenerational Mobility in the United States”,
Chetty, R., J. N. Friedman, E. Saez, N. Turner and D. Yagan (2017), “Mobility Report Cards: The Role of Colleges in Intergenerational Mobility”, NBER Working Paper 23618.
Chien, N. (2021), “Factsheet: Estimates of Child Care Eligibility and Receipt for Fiscal Year 2018”, U.S. Department of Health and Human Services, Office of the Assistant Secretary for Planning and Evaluation.
Coglianese, J., Gerarden, T. D., & Stock, J. H. 2020. The Effects of Fuel Prices, Environmental Regulations, and Other Factors on US Coal Production, 2008–2016. EJ 41.
College Board (2021), “Trends in College Pricing and Student Aid 2021”, New York: College Board.
Congressional Research Service (2021), “The U.S. Income Distribution: Trends and Issues”, Congressional Research Servie, updated January, 2021.
Curtis, E. M. and I. Marinescu (2022), “Green Energy Jobs in the US: What Are They, and Where Are They?”, NBER Working Paper No. 30332, August 2022.
Department of Energy (2012), “Cost Effectiveness of Home Energy Retrofits in Pre-Code Vintage Homes in the United States”, October 2012.
Department of Education: Mary Ann Fox, Brooke A. Connolly, and Thomas D. Snyder (2005), “Youth Indicators Trends in the Well-Being of American Youth”, Department of Education, 2005.
Di Maggio, M., A. Kalda and V. Yao (2020), “Second Chance: Life without Student Debt”, NBER Working Paper No. 25810, May 2019, Revised March 2020.
Easterly, W. (2001), “The Middle Class Consensus and Economic Development”, Journal of Economic Growth, Vol. 6/4, pp. 317-335, http://dx.doi.org/10.1023/A:1012786330095.
Enchautegui, M., N. Chien, K. Burgess, and R. Ghertner (2016), “Effects of the CCDF Subsidy Program on the employment outcomes of low income mothers”. Washington, DC: U.S. Department of Health and Human Services, Office of the Assistant Secretary for Planning and Evaluation. Available from https://aspe.hhs.gov/system/files/pdf/253961/EffectsCCSubsidiesMaternalLFPTechnical.pdf.
EPA (2022), “Draft Inventory of U.S. Greenhouse Gas Emissions and Sinks, 1990-2020”, United States Environmental Protection Agency.
EPA (2021), “Climate Change and Social Vulnerability in the United States: A Focus on Six Impacts”, U.S. Environmental Protection Agency, EPA 430-R-21-003.
EPA (2021b), “The 2021 Automotive Trends Report: Greenhouse Gas Emissions, Fuel Economy, and Technology since 1975”, United States Environmental Protection Agency, November 2021.
EIA (2021), “Analysis of Carbon Fee Runs Using the Annual Energy Outlook 2021”, US Energy Information Administration.
Esteban, J., C. Gradin, and D. Ray (2007), “Extensions of a Measure of Polarization, with an Application to the Income Distribution of Five OECD Countries,” The Journal of Economic Inequality volume 5, pages1–19 (2007)
Esteban, J. and D. Ray (1994), “On the Measurement of Polarization,” Econometrica, 62, 819–852.
Fletcher J. and K. M. Jajtner (2019), “Intergenerational Health Mobility: Magnitudes and Importance of Schools and Place”, NBER Working Paper 26442
Foster, J. E. and M. C. Wolfson (2010), “Polarization and the decline of the middle class”, The Journal of Economic Inequality volume 8, pages 247–273 (2010).
Forry, N. D. and S. L. Hofferth (2011), “Maintaining Work: The Influence of Child Care Subsidies on Child Care-Related Work Disruptions,” Journal of Family Issues 32 (3) (2011): 346–368
Fuchs-Schündeln, N., D. Krueger, A. Ludwig, and I. Popova (2020). The Long-Term Distributional and Welfare Effects of Covid-19 School Closures. NBER Working Paper 27773.
García-Muros, X., J. Morris and S. Paltsev (2022), “Toward a just energy transition: A distributional analysis of low-carbon policies in the USA”, Energy Economics Volume 105, January 2022.
Goldstein, B., D. Gounaridis and J. P. Newell (2020), “The carbon footprint of household energy use in the United States”, Proceedings of the National Academy of Sciences 117(32): 201922205, https://doi.org/10.1073/pnas.1922205117
Gordon, G., and Hedlund, A. (2016), “Accounting for the rise in college tuition”, Available at SSRN: http://dx.doi.org/10.2139/ssrn.3720860.
Gould, E. and B. Hunter (2020), “Who’s paying now? The explicit and implicit costs of current early care and education system”, Economic Policy Institute Report
Gurrentz, B. (2021), “Child Care Subsidies and the Labor Force Outcomes for Working Married Mothers”, Social, Economic and Housing Statistics Division of the U.S. Census Bureau, SEHSD Working Paper 2021-14.
Gutiérrez, G. and T. Philippon (2017), “Declining competition and investment in the US”, NBER Working Paper 23583, http://www.nber.org/papers/w23583.
Haltiwanger James Spletzer, J. (2020), Rising Between Firm Inequality and Declining Labor Market Fluidity: Evidence of a Changing Job Ladder.
Heckman, J. et al. (2010), “The rate of return to the HighScope Perry Preschool Program”, Journal of Public Economics, http://dx.doi.org/10.1016/j.jpubeco.2009.11.001.
Houser, Trevor, Jason Bordoff, and Peter Marsters. 2017. “Can Coal Make a Comeback?” Center on Global Energy Policy, Columbia SIPA
Howes, C. et al. (2008), “Ready to learn? Children’s pre-academic achievement in preKindergarten programs”, Early Childhood Research Quarterly, Vol. 23/1, pp. 27-50, http://dx.doi.org/10.1016/j.ecresq.2007.05.002.
IEA (2021), “Net Zero by 2050: A Roadmap for the Global Energy Sector”, IEA, Paris.
IEA (2021b), “Electric Vehicles”, IEA, Paris https://www.iea.org/reports/electric-vehiclesIEA (2019), “Energy Policies of IEA Countries: United States 2019 Review”
IMF (2017), “Technology and Future of Work” IMF Staff Note to Group of Twenty
ITF (2018), “The Social Impacts of Road Pricing: Summary and Conclusions”, ITF Roundtable Reports, No. 170, OECD Publishing, Paris, https://dx.doi.org/10.1787/d6d56d2d-en
ITF (2017), “Income Inequality, Social Inclusion and Mobility”, ITF Roundtable Reports, No. 164, OECD Publishing, Paris, https://dx.doi.org/10.1787/g2g7ae77-en.
Joughin, C. (2021), “Our Child Care System Is Not Meeting The Needs Of Families, Providers, or The Economy”, First Five Years Fund, https://www.ffyf.org/our-child-care-system-is-not-meeting-the-needs-of-families-providers-or-the-economy/
Kelly, M. (2000), “Inequality and Crime”, Review of Economics and Statistics, Vol. 82/4, pp. 530-539.
Kleven, H., C. Landais, J. Posch, A. Steinhauer and J. Zweimüller (2019), Child Penalties across Countries: Evidence and Explanations”, AEA Papers and Proceedings 2019, 109: 122–126.
Kraff C., E. E. Davis, and K. Tout (2017), “Child care subsidies and the stabilityand quality of child care arrangements,” Early Childhood Research Quarterly 39: 14–34
Kronstadt, J. (2008), “Health and Economic Mobility”, Urban Institute Research Report
Kuziemko, I., M. I. Norton, E. Saez and S. Stantcheva (2015), “How Elastic Are Preferences for Redistribution? Evidence from Randomized Survey Experiments”, American Economic Review, Volume 105, No. 4, April 2015.
Levinson, A. (2016), “How Much Energy Do Building Energy Codes Save? Evidence From California Houses”, American Economic Review 2016, 106(10): 2867–2894, http://dx.doi.org/10.1257/aer.20150102
Leroutier, M. (2022), “Carbon pricing and power sector decarbonization: Evidence from the UK”, Journal of Environmental Economics and Management, Volume 111, January 2022.
Levy, F. and R. J. Murnane (1992), “U.S. Earnings Levels and Earnings Inequality: A Review of Recent Trends and Proposed Explanations”, Journal of Economic Literature, September, Vol. XXX, No. 3, 1992.
Malik, R. (2018), “The Effects of Universal Preschool in Washington, D.C.”, Center for American Progress.
Mankiw, N. G., D. Romer and D. Weil (1992), “A Contribution to the Empirics of Economic Growth,” The Quarterly Journal of Economics 107 (2) (1992): 407-37.
Marin, G. and F. Vona (2019), “Climate policies and skill-biased employment dynamics: Evidence from EU countries”, Journal of Environmental Economics and Management, Vol. 98, p. 102253, http://dx.doi.org/10.1016/j.jeem.2019.102253.
Molloy, R. and C. Smith (2019), “U.S. Internal Migration: Recent Patterns and Outstanding Puzzles”, Prepared for Federal Reserve Bank of Boston conference, “A House Divided: Geographic Disparities in Twenty First Century America,” Boston, MA, October 4–5.
Montes, J., C. Smith, and I. Leigh (2021). "Caregiving for children and parental labor force participation during the pandemic," FEDS Notes. Washington: Board of Governors of the Federal Reserve System, November 05, 2021, https://doi.org/10.17016/2380-7172.3013.
Morrissey, T.W. (2017), “Child care and parent labor force participation: a review of the research literature”, Review of Economics of the Household 15, 1–24 (2017). https://doi.org/10.1007/s11150-016-9331-3
NORC (National Opinion Research Center at the University of Chicago)_and West Health Institute (2018), “Americans’ views of healthcare costs, coverage and policy”, NORC Issue Brief, March 2018.
NCES (2018), National Household Education Survey Programs of 2016: Public-Use Data Files, National Center for Education Statistics website, https://nces.ed.gov/pubSearch/pubsinfo.asp?pubid=2018104.
OECD (2022), “A Framework to Decarbonise the Economy”, OECD Economic Policy Paper No. 31.OECD (2021a), “Education at a Glance 2021”, OECD Publishing, Paris, https://doi.org/10.1787/b35a14e5-en.
OECD (2021b), Assessing the Economic Impacts of Environmental Policies, OECD, http://dx.doi.org/10.1787/bf2fb156-en.
OECD (2021c), “The inequalities-environment nexus”, OECD Green Growth Papers, 2021-01.
OECD (2021d), Is the German Middle Class Crumbling? Risks and Opportunities, OECD Publishing, Paris, https://doi.org/10.1787/845208d7-en.
OECD (2021e), “OECD Economic Surveys: Denmark 2021”, OECD Publishing, Paris, https://doi.org/10.1787/86f7b2d9-en
OECD (2021f), “Tackling the mental health impact of the COVID-19 crisis: An integrated, whole-of-society approach”, OECD Publishing, Paris.
OECD (2021g), “OECD Economic Surveys: Denmark 2021”, OECD Publishing, Paris.
OECD (2021h), “Inequalities in Household Wealth and Financial Insecurity of Households”, Policy Brief, Center on Well-being, Inclusion, Sustainability and Equal Opportunity (WISE), July 2021.
OECD (2021i), “Transport Strategies for Net-Zero Systems by Design”, OECD Publishing, Paris.
OECD (2020a), “Is Childcare Affordable?”, OECD Publishing, Paris.
OECD (2020b), “Education at a Glance 2020”, OECD Publishing, Paris,
OECD (2019), “Under Pressure: The Squeezed Middle Class”, OECD Publishing, Paris.
OECD (2018), Engaging Young Children: Lessons from Research about Quality in Early Childhood Education and Care, Starting Strong, OECD Publishing, Paris, https://dx.doi.org/10.1787/9789264085145-en.
OECD (2017), “Starting Strong 2017: Key OECD Indicators on Early Childhood Education and Care”, OECD Publishing, Paris
OECD (2017b), Investing in Climate, Investing in Growth, OECD Publishing, Paris, https://dx.doi.org/10.1787/9789264273528-en.
OECD (2017c), “Germany’s effort to phase out and rationalise its fossil-fuel subsidies”, OECD Publishing, Paris.
OECD (2017d), The Pursuit of Gender Equality: An Uphill Battle, OECD Publishing, Paris. http://dx.doi.org/10.1787/9789264281318-en.
OECD (2012), “The Jobs Potential of a Shift Towards a Low-Carbon Economy”, OECD Green Growth Papers, No. 2012/1, OECD Publishing, Paris, https://dx.doi.org/10.1787/5k9h3630320v-en.
OECD (2010), “The Emerging Middle Class in Developing Countries”, OECD, https://www.oecd.org/dev/44457738.pdf (accessed on 13 December 2018).
OECD (2003), The Sources of Economic Growth in OECD Countries, OECD Publishing, Paris, http://www.oecd.org (accessed on 1 March 2019).
OECD (1993), “Employment Outlook”, Paris: Organisation for Economic Cooperation and Development, 1993.
Olivetti, C., and B. Petrongolo (2017), “The Economic Consequences of Family Policies: Lessons from a Century of Legislation in High-Income Countries”, Journal of Economic Perspectives—Volume 31, Number 1—Winter 2017—Pages 205–230.
Perotti, Roberto (1993), “Political equilibrium, income distribution, and growth”, Review of Economic Studies, Sep.
Pew Research Center (2021), “Public Trust in Government:1958-2021”, https://www.pewresearch.org/politics/2021/05/17/public-trust-in-government-1958-2021/
Pew Research Center (2020), “Most Americans Say There Is Too Much Economic Inequality in the U.S., But Fewer Than Half Call it a Top Priority”
Pew Research Center (2020b), “Economic Fallout from COVID-19 Continues to Hit Lower-Income Americans the Hardest”, September 24, 2020.
Phelps, E. S. (1972). Inflation Policy and Unemployment Theory: The cost-benefit approach to monetary planning. Norton.
Piketty, Thomas, and Emmanuel Saez. 2003. “Income Inequality in the United States, 1913-1998.” Quarterly Journal of Economics 113 (1): 1–39.
Piketty, T., E. Saez and G. Zucman (2018) “Distributional National Accounts: Methods and Estimates for the United States”, The Quarterly Journal of Economics, Volume 133, Issue 2, May 2018, Pages 553–609, https://doi.org/10.1093/qje/qjx043
PNNL, Pacific Northwest National Laboratory (2021), “Impacts of Model Building Energy Codes – Interim Update”, PNNL-31437.
Porter, N. (2012), “High Turnover among Early Childhood Educators in the United States”, Child Research Net.
Pressman, S. (2007), “The Decline of the Middle Class: An International Perspective”, Journal of Economic Issues, Vol. 41, pp. 181-200, http://dx.doi.org/10.2307/25511161.
Proost, S. (2018), “Reforming private and public urban transport pricing”, International Transport Forum Discussion Papers, No. 2018/15, OECD Publishing, Paris, https://doi.org/10.1787/3567dda4-en.
Psacharopoulos, G., V. Collis, H. Patrinos, and E. Vegas (2020). Lost Wages: The COVID-19 Cost of School Closures. IZA Discussion Paper 13641.
Quah, D. (1996), “Twin Peaks: Growth and Convergence in Models of Distribution Dynamics,” Economic Journal, 106, 1045–1055.
Reguant, M. (2019), “The Efficiency and Sectoral Distributional Impacts of Large-Scale Renewable Energy Policies”, Journal of the Association of Environmental and Resource Economists, Vol. 6/S1, pp. S129-S168, http://dx.doi.org/10.1086/701190.
Rusticelli, E., D. Haugh, A. Arquie and L. Demmou (2018), “Going local: a regional perspective on how trade affects labour markets and inequality”, OECD Economics Department Working Papers No. 1530.
Sawhill, I. V. and K. Guyot (2020), “Women’s work boosts middle-class incomes but creates a family time squeeze that needs to be eased”, Brookings Institution. https://www.brookings.edu/essay/womens-work-boosts-middle-class-incomes-but-creates-a-family-time-squeeze-that-needs-to-be-eased/
Saez, Emmanuel, and Gabriel Zucman. 2016. “Wealth Inequality in the United States since 1913: Evidence from Capitalized Income Tax Data.” Quarterly Journal of Economics, 131(2): 519–578.
Schochet, L. (2019), “The Child Care Crisis is Keeping Women Out of the Workforce”, Center for American Progress Report. Available at https://www.americanprogress.org/article/child-care-crisis-keeping-women-workforce/.
Schulte, B. and A. Durana (2016), The New America Care Report, New America, https://www.care.com/media/cms/pdf/FINAL_Care_Report_09-27-2016.pdf.
Shonkoff, J. and D. Phillips (eds.) (2000), From Neurons to Neighborhoods: The Science of Early Childhood Development, National Academy Press, Washington, D.C., http://dx.doi.org/10.17226/9824.
Stantcheva, Stefanie. 2022. “Inequalities in the Times of a Pandemic," NBER working paper #29657.
Stiles, J. and T. Jernigan (2010), The basics of brain development, http://dx.doi.org/10.1007/s11065-010-9148-4.
Stroud, D., Fairbrother, P., Evans, C. and Blake, J. (2013), ‘Skill development in the transition to a “green economy”: A “varieties of capitalism” analysis’, Economic and Labour Relations Review, 25 (1): 10-27.
Thorson, G. (2014), The Rise of Inequality, the Decline of the Middle Class, and Educational Outcomes, Segovia, Spain.
Treasury (2022), “The state of labor market competition”, U.S. Department of the Treasury, March 2022.
UITP (2014), Better Public Transport Fare Policy for More Resilient Funding, policy brief, International Association of Public Transport, Brussels.
UNICEF (2019), “A World Ready to Learn: Prioritising quality early childhood education”, UNICEF Global Report.
Urban Institute (2021), “2021 Poverty Projections: Assessing the Impacts of Benefits and Stimulus Measures”, Urban Institute Research Report.
van Stel, et al. (2005), “The Effect of Entrepreneurial Activity on National Economic Growth”, Small Business Economics, Vol. 24, pp. 311–321, http://dx.doi.org/10.1007/s11187-005-1996-6.
Vona, F., G. Marin, D. Consoli and D. Popp (2018), “Environmental Regulation and Green Skills: An Empirical Exploration”, Journal of the Association of Environmental and Resource Economists, Volume 5, Number 4, October 2018.
Webber, D. A. (2017), “State divestment and tuition at public institutions”, Economics of Education Review, 60, 1-4.
Wolfson, M. C. (1994), “When Inequalities Diverge”, The American Economic Review, May, 1994, Vol. 84 No. 2, Papers and Proceedings of the Hundred and Sixth Annual Meeting of the American Economic Association (May, 1994), pp. 353-358
Wolfson, M. C. (1997), “Divergent Inequalities: Theory and Empirical Results,” Review of Income and Wealth, 43, 401–421.
Zachmann, G., G. Fredriksson and G. Claeys (2018), “The Distributional Effects of Climate Policies”, Bruegel Blueprint Series 28.