Four Latin American countries took part in the first cycle of PIAAC: Chile, Ecuador, Mexico and Peru. As middle-income countries which are only just beginning to experience the expansion in education that OECD countries enjoyed many decades ago, their results are lower than most other countries and economies taking part. In literacy, numeracy and problem solving they lie at or near the bottom of the rankings, and some do not have the basic skills necessary to take the assessment at all, unsurprising in a region with low information and communications technology (ICT) penetration. More highly educated adults do better, although even tertiary-educated adults in Latin America demonstrate lower proficiency than their OECD counterparts. Skills in these countries tend to change linearly with age, reflecting the very recent increases in upper secondary attainment. Gender gaps in skills are also wider among older age groups, but closing among the under-25s.
Skills in Latin America

1. Skills in Latin America: Results from PIAAC
Abstract
Introduction
Literacy and numeracy skills form the foundation for developing higher-order cognitive skills such as analytic reasoning and are essential for accessing and understanding specific knowledge domains. In addition to these core cognitive skills, the capacity to manage information and solve problems in technology-rich environments is becoming a necessity as ICT permeates the workplace, the classroom and lecture hall, the home, and social interactions more generally. As such, literacy, numeracy and problem solving are relevant skills across a range of life contexts, from education and work, to home, socialising and interacting with public authorities. Adults who are highly proficient in these skills are likely to be able to make the most of the opportunities created by the technological and structural changes currently transforming modern societies. Those who struggle to use new technologies are at greater risk of losing out.
To help better measure these key competencies globally, the OECD launched the Survey of Adult Skills, a product of the Programme for the International Assessment of Adult Competencies (PIAAC), whose first results were released in 2013. The PIAAC Survey measures the proficiency of working-age adults (16-65-year-olds) in the three key information-processing skills mentioned above: literacy, numeracy and problem solving in technology-rich environments (PSTRE). It was designed to provide insights into how well adult populations can perform the key skills society needs and how they use them at work and at home.
In total, 39 countries and economies participated in the first cycle of the PIAAC Survey, mostly high-income countries. However, the survey also included middle-income countries: four Latin American countries – Chile, Ecuador, Mexico and Peru – along with Indonesia, Kazakhstan and the Republic of Türkiye. PIAAC uses the methodology and taxonomy adopted by the World Bank (2019[1]) to classify countries by income levels.1
This chapter uses data from the first cycle of the PIAAC Survey, conducted between 2011 and 2018 (OECD, 2016[2]; 2019[3]), to report and evaluate the performance of the four participating Latin American countries, particularly the skill development of adults. It highlights the average proficiency levels of these countries in all three skills measured by the survey and compares their performance with other participating countries. The chapter also analyses the proficiency of different sub-groups of the population taking part, based on educational attainment, age, gender and socio-economic background. These results are contextualised according to these countries’ economic development and their levels of educational achievement.
Box 1.1. Survey of Adult Skills: Understanding the results
The results of the three assessed domains are reported using scales ranging from 0 to 500. Each of the three proficiency scales is divided into “proficiency levels”, defined by particular score-point ranges. Six proficiency levels are defined for literacy and numeracy (from below Level 1 to Level 5) and four for problem solving in technology-rich environments (from below Level 1 to Level 3).
The results for literacy and numeracy are presented in the form of mean proficiency scores for each country as well as the proportion of the population in each proficiency level. When it comes to assessing PSTRE, however, the share of the target population for which the results apply varies widely across countries/economies. This is due to the very different levels of familiarity with computer applications in the countries and economies participating in the Survey of Adult Skills. Proficiency scores relate only to the proportion of the target population in each participating country who were able to undertake the computer-based version of the assessment and thus meet the preconditions for displaying competency in this domain. In other words, the populations for whom proficiency scores for PSTRE are reported are not the same across countries. For this reason, the presentation of these results focuses on the proportion of the population at each proficiency level rather than comparing mean proficiency scores.
The proficiency levels are designed so that the scores represent degrees of proficiency in a particular aspect of the domain. Each level is associated with a certain number of items, with higher levels being associated with items of increasing difficulty. In other words, at each level, individuals can successfully complete certain types of tasks. For example, respondents scoring at Level 1 in literacy are likely to be able to successfully complete tasks that require reading relatively short texts to locate a single piece of information, which is identical to or synonymous with the information given in the question or directive and in which there is little competing information. Respondents reaching Level 5 in literacy are more likely to be able to complete tasks that involve searching for and integrating information across multiple, dense texts, constructing syntheses of similar and contrasting ideas or points of view, or evaluating evidence and arguments. These respondents can apply and evaluate logical and conceptual models, and evaluate the reliability of evidentiary sources and select key information. They are also aware of subtle, rhetorical cues and can make high-level inferences or use specialised background knowledge.
The purpose of described proficiency scales is to facilitate the interpretation of the scores assigned to respondents. Respondents at a particular level have demonstrated knowledge and skills associated with that level and also those required at lower levels. Thus, respondents scoring at Level 2 are also likely to be proficient at Level 1, with all respondents expected to answer at least half of the items at that level correctly
Source: OECD (2019[3]) Skills Matter: Additional Results from the Survey of Adult Skills, https://doi.org/10.1787/1f029d8f-en.
Skills proficiency across domains in Latin America
Proficiency in literacy
The Survey of Adult Skills defines literacy as the ability to understand, evaluate, use and engage with written texts in order to participate in society, achieve one’s goals, and develop one’s knowledge and potential. The term “literacy” in the Survey refers to reading written texts; it does not involve comprehending or producing spoken language or producing text (writing) (OECD, 2019[3]). In addition, given the growing importance of digital devices and applications as a means of generating, accessing and storing written text, reading digital texts2 is an integral part of literacy as measured in the Survey of Adult Skills.
On average, across all OECD countries participating in the Survey of Adult Skills, one in ten adults (10.0%) scored at Level 4 or higher and one in three (34.6%) scored at Level 3. Overall, almost half of all adults (44.6%) scored at the three highest levels (Level 3, 4 or 5). Below these levels, around one in three adults (34.3%) performed at Level 2 and around one in five adults at either Level 1 (15.0%) or below Level 1 (4.8%) (Figure 1.1).
In contrast, the results for Latin American participants show that less than one in eight adults performed at Level 3 or higher in Ecuador (5.2%), Mexico (11.7%) and Peru (6.1%). At 14.5%, Chile had a slightly higher percentage of adults who performed at the highest levels of proficiency in literacy (Figure 1.1). These countries were also among the countries and economies with the largest proportions of adults who scored at Level 1 or below. More than half of their populations scored at the lowest levels of proficiency in literacy: 71.2% in Ecuador, 70.2% in Peru, 53.4% in Chile and 50.6% in Mexico.
The average literacy score across the OECD countries and economies that participated in the assessment was 266 points, towards the top of Level 2 on the literacy scale. Among the Latin American countries however, the average proficiency of adults in Mexico was 222 points, in Chile it was 220 points, and in Peru and Ecuador 196 points, all substantially below the OECD average.
Figure 1.1. Literacy proficiency among adults
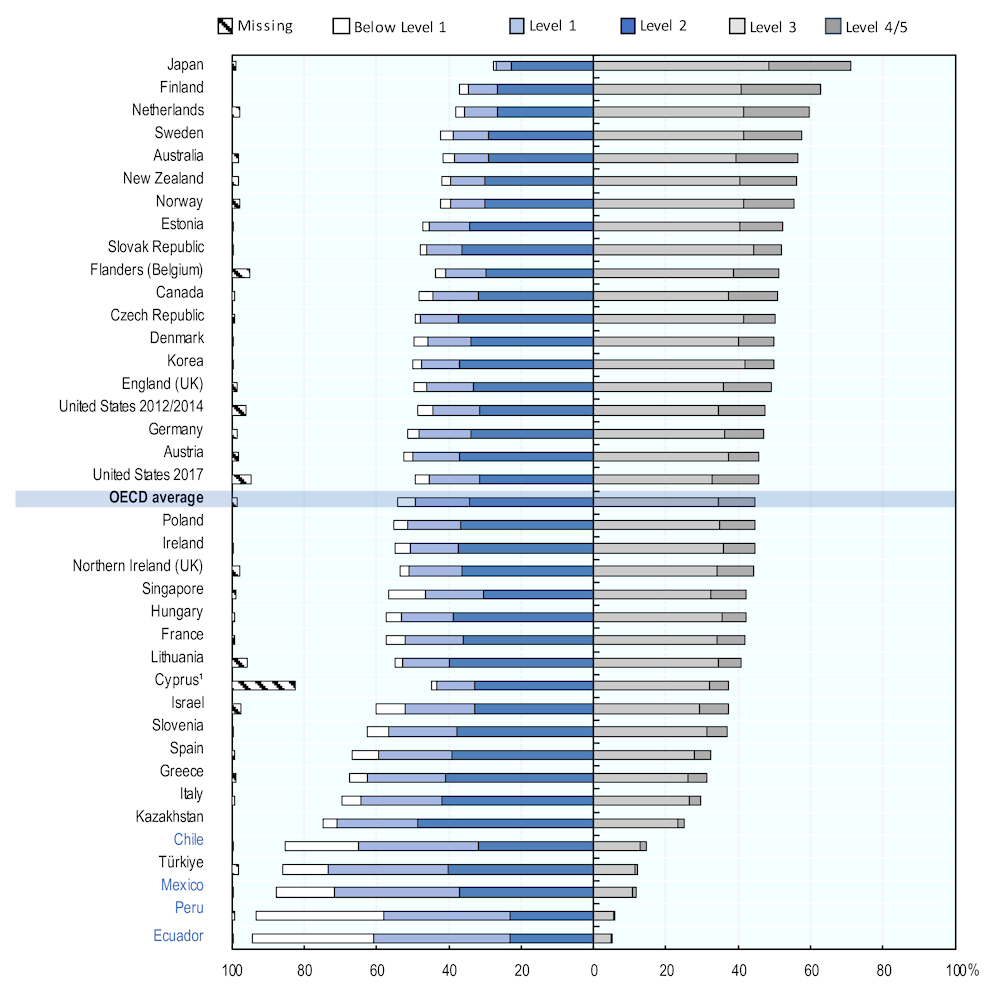
Notes: Adults in the missing category were not able to provide enough background information to impute proficiency scores because of language difficulties, or learning or mental disabilities (referred to as literacy-related non-response).
1. Note by the Republic of Türkiye:
The information in this document with reference to “Cyprus” relates to the southern part of the Island. There is no single authority representing both Turkish and Greek Cypriot people on the Island. Türkiye recognises the Turkish Republic of Northern Cyprus (TRNC). Until a lasting and equitable solution is found within the context of the United Nations, Türkiye shall preserve its position concerning the “Cyprus issue”.
Note by all the European Union Member States of the OECD and the European Union:
The Republic of Cyprus is recognised by all Members of the United Nations with the exception of Türkiye. The information in this document relates to the area under the effective control of the Government of the Republic of Cyprus.
Countries and economies are ranked in descending order of the combined percentages of adults scoring at Level 3 and at Level 4/5.
Source: OECD (2019[3]), Skills Matter: Additional Results from the Survey of Adult Skills, Figure 2.6, https://doi.org/10.1787/888934019951.
Figure 1.2. Distribution of literacy proficiency scores among 16-65-year-olds
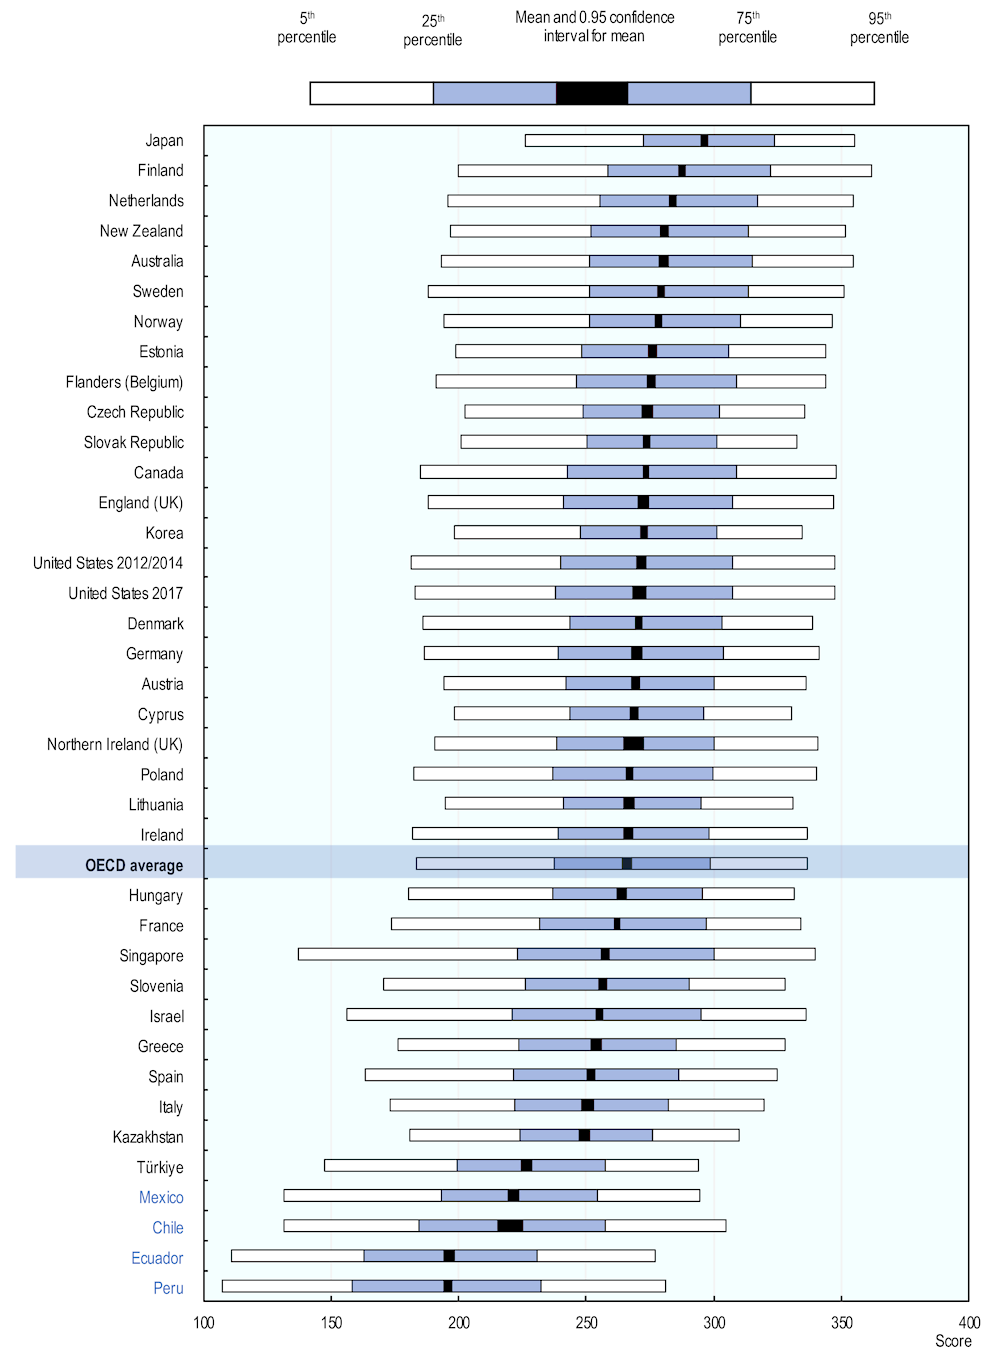
Notes: Mean scores are shown with a 0.95 confidence interval. Literacy-related non-response (missing) is excluded from the calculation of mean scores.
Countries and economies are ranked in descending order of the mean score.
Source: OECD (2019[3]), Skills Matter: Additional Results from the Survey of Adult Skills, Figure 2.8, https://doi.org/10.1787/888934019989.
In addition to examining differences in average literacy proficiency, it is also useful to explore differences in the distribution of scores within each country or economy. This can be done by identifying the score below which 5%, 25%, 75% and 95% of adults perform. Comparing score-point differences among adults at different points in the distribution of proficiency measures the extent of variation in that distribution in each participating country or economy. Figure 1.2 presents the distribution of scores within countries and economies in addition to the mean score. A longer bar indicates greater variations in literacy proficiency within a country; a shorter bar indicates smaller variations.
On average, among OECD countries, 61 score points separate the 25% of adults who attained the highest and lowest scores in literacy (a measure known as the interquartile range). Of the Latin American countries that participated in PIAAC Cycle 1, Peru and Chile have the widest such range of literacy scores, with the top- and bottom-performing 25% separated by 74 score points in Peru and 73 score points in Chile. Among the other two participating Latin American countries, the gap is 68 points in Ecuador, somewhat wider than the OECD average, but in Mexico it is 61 points, the same as the OECD average.
Proficiency in numeracy
The Survey of Adult Skills defines numeracy as the ability to access, use, interpret and communicate mathematical information and ideas in order to engage in and manage the mathematical demands of a range of situations in adult life (OECD, 2019[3]). A numerate adult responds appropriately to mathematical content, information and ideas represented in various ways in order to manage situations and solve problems in a real-life context. While performance on numeracy tasks is partly dependent on the ability to read and understand texts, numeracy involves more than applying arithmetical skills to information embedded in texts.
On average, two in five adults (42.2%) across participating OECD countries/economies scored at Level 3 and above in numeracy. In the Latin American context, much smaller shares of the adult population performed at this level: 11.9% in Chile, 3.6% in Ecuador, 8.9% in Mexico and 5.6% in Peru (Figure 1.3).
At the other end of the scale, on average across all OECD countries participating in the Survey of Adult Skills, around one in three adults scored at Level 2 (33.0%) and around one in four adults (23.5%) scored at the two lowest levels of numeracy proficiency: 16.4% at Level 1 and 7.1% below Level 1. In contrast, around three-quarters of the adult population in Ecuador (76.8%) and Peru (74.8%) were only proficient at Level 1 or below in numeracy. In Chile this was true for 61.9% of adults and in Mexico for 60.1%.
The average numeracy score across the OECD countries and economies that participated in the assessment is 262 points. But the Latin American countries that participated in the first cycle of PIAAC recorded the lowest average scores of all countries/economies: 179 points (Peru), 185 points (Ecuador), 206 points (Chile) and 210 points (Mexico).
Figure 1.4 shows the variation in numeracy proficiency observed within countries, giving the distribution of scores in addition to the mean score. On average across OECD countries, the gap between the highest and lowest 25% of performers in numeracy is 68 score points. Among the Latin American countries that participated in first cycle of the PIAAC survey, Peru, Chile and Ecuador have larger gaps in scores between these groups than the OECD average (91 points for Peru, 82 points for Chile and 74 points for Ecuador), while in Mexico, the gap is similar to the OECD average, at 67 points. Peru has the widest distribution of numeracy proficiency among all the countries and economies that participated in the first cycle of PIAAC.
Figure 1.3. Numeracy proficiency among adults
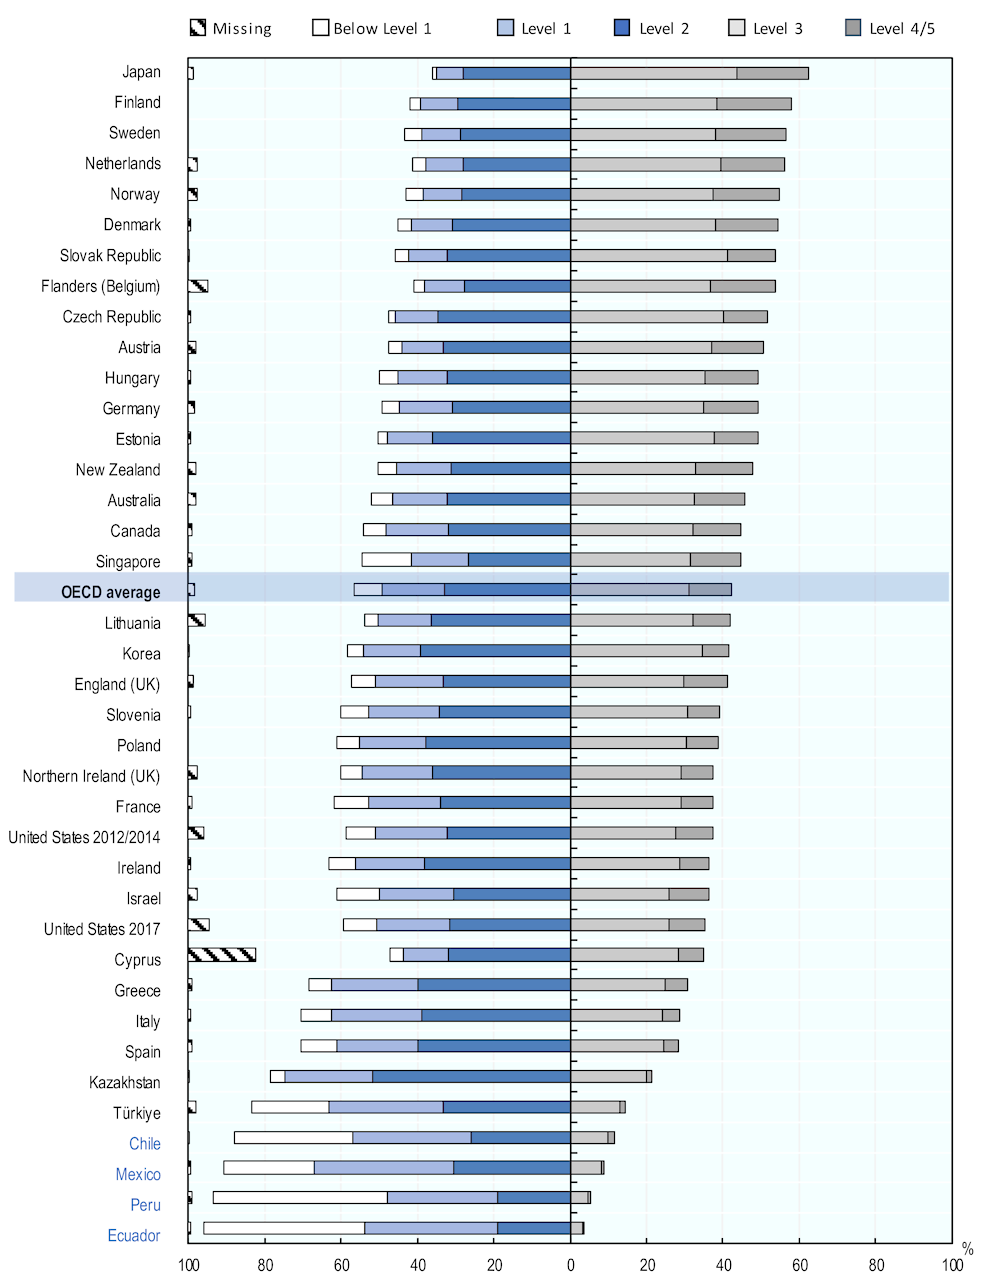
Notes: Adults in the missing category were not able to provide enough background information to impute proficiency scores because of language difficulties or learning or mental disabilities (referred to as literacy-related non-response).
Countries and economies are ranked in descending order of the combined percentages of adults scoring at Level 3 and at Level 4/5.
Source: OECD (2019[3]), Skills Matter: Additional Results from the Survey of Adult Skills, Figure 2.9, https://doi.org/10.1787/888934020008.
Figure 1.4. Distribution of numeracy proficiency scores among 16-65-year-olds
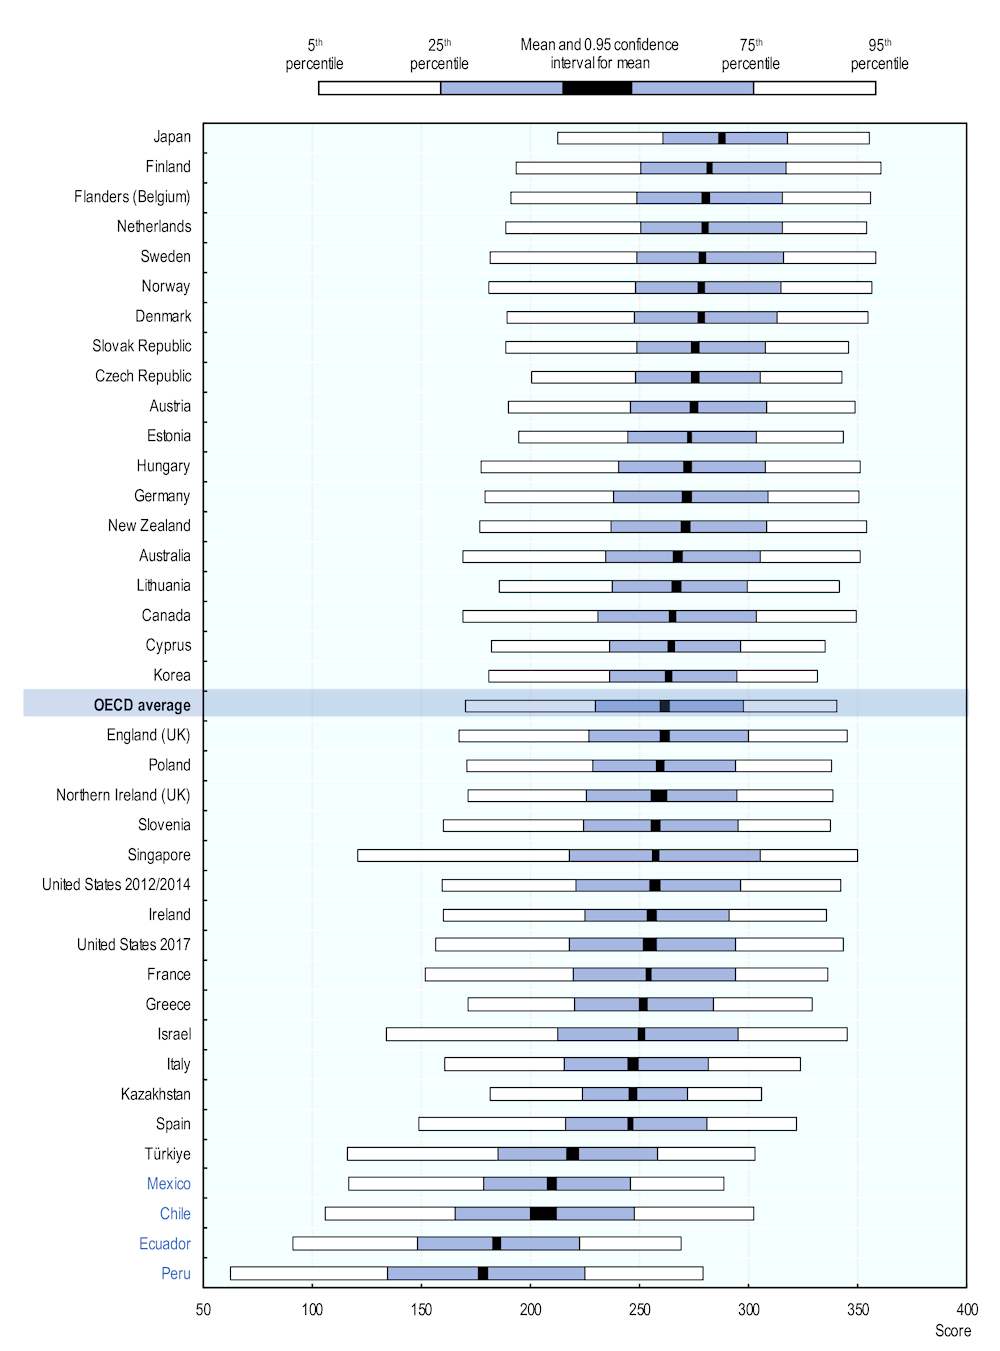
Notes: Mean scores are shown with a 0.95 confidence interval. Literacy-related non-response (missing) is excluded from the calculation of mean scores.
Countries and economies are ranked in descending order of the mean score.
Source: OECD (2019[3]), Skills Matter: Additional Results from the Survey of Adult Skills, Figure 2.11, https://doi.org/10.1787/888934020046.
The reading components assessment
In almost all countries and economies that participated in the Survey of Adult Skills, a sizable proportion of adults have low proficiency in either literacy or numeracy. In most countries, between 15% and 38% of 16-65-year-olds are proficient at Level 1 or below in either literacy or numeracy. As described above, at Level 1, individuals can usually complete simple reading and numeracy tasks, such as locating information in a short text or performing simple one-step arithmetic operations. They have trouble extracting information from longer and more complex texts or performing numerical tasks involving several steps and mathematical information represented in different ways. Individuals who perform below Level 1 are not only unable to locate information in complex texts, but they experience difficulty doing so even with simple texts. Similarly, they struggle to complete simple numerical tasks. The Latin American countries stand out as having substantial shares of adults who are only proficient at Level 1 or below in either literacy or numeracy: 64.7% in Mexico, 67.1% in Chile, 80.1% in Peru and 82.2% in Ecuador.
The Survey of Adult Skills includes an assessment of reading components to provide more information about the skills of adults with poor reading proficiency. The reading components assessment was designed to assess three skills considered to be essential preconditions for understanding the meaning of written texts: knowledge of print vocabulary (word recognition), the ability to evaluate the logic of sentences (sentence processing) and fluency in reading passages of text (passage comprehension). Skilled readers undertake these types of operations automatically. The assessment of reading components was taken by respondents who failed the literacy and numeracy core assessment in the computer-based version of the assessment, and by all respondents taking the paper version of the assessment.
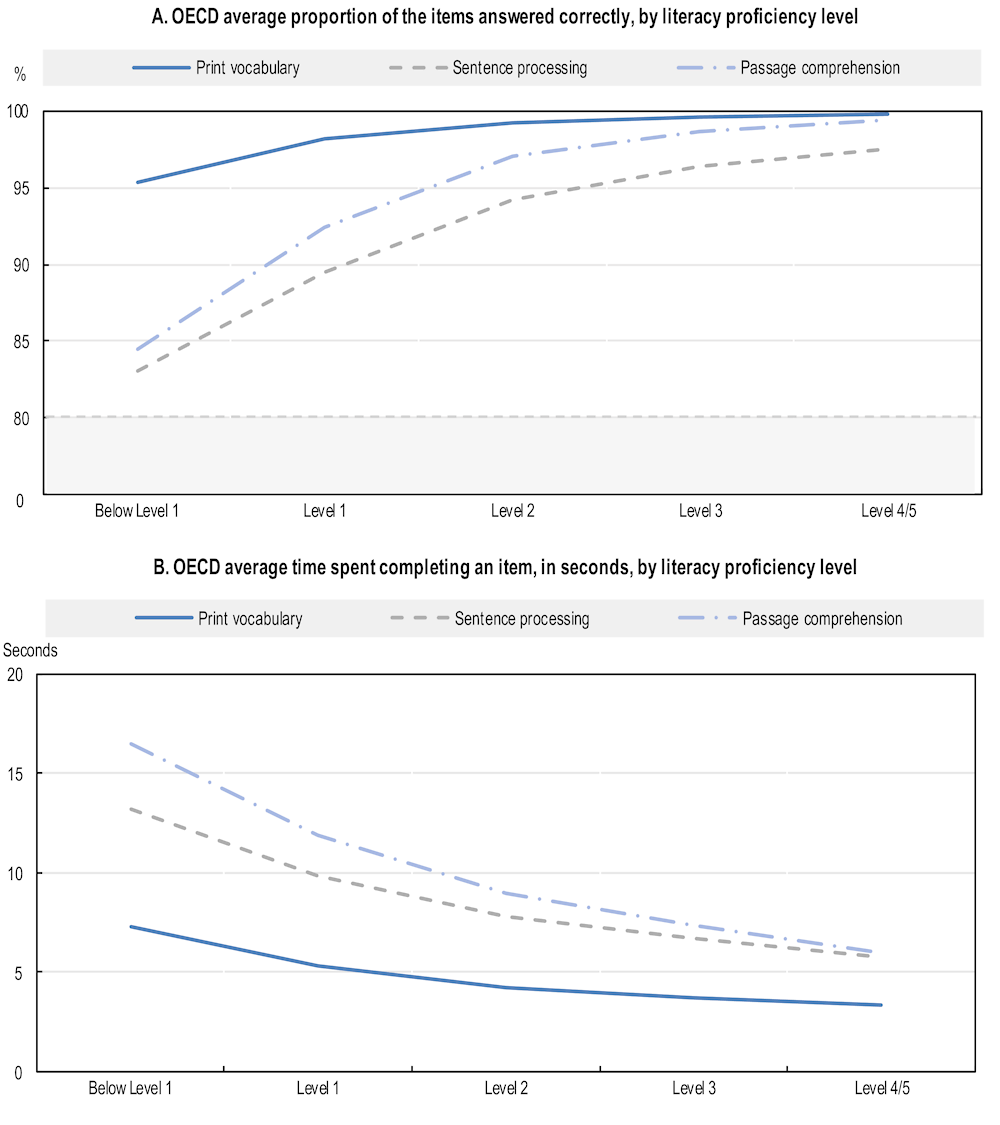
Figure 1.5 presents information about two dimensions of performance in the reading components assessment: the proportion of items that were correctly answered by respondents and the time taken to complete the assessment. The first panel shows the relationship between literacy proficiency and the percentage of items answered correctly (accuracy); the second panel shows the relationship between literacy proficiency and the time taken (in seconds) to complete an item (speed or fluency). These graphs show that accuracy and speed increase with proficiency for all three reading components, with gains tapering off markedly at Level 2 or higher.
The results suggest that while many adults in most countries participating in the Survey of Adult Skills have poor reading skills, very few are illiterate in the sense of being unable to read at all. This is as true of Latin American countries, where most adults are proficient at Level 1 and below on the literacy scale, as it is of countries with far smaller proportions of adults at this level. In Chile, Ecuador, Mexico and Peru, which have very high proportions of adults performing at Level 1 or below for literacy, only 8-20% of adults failed the literacy and numeracy core tests designed to identify the respondents who could undertake the entire assessment. Those failing the core test in these countries also correctly answered more than 82% of the items in the sentence-processing elements of the reading components assessment, 83% of the passage-comprehension items and 95% of the print-vocabulary items.
Figure 1.5. Literacy proficiency and performance in core reading components
Note: Finland, France and Japan did not participate in the reading components assessment.
Source: OECD (2019[3]), Skills Matter: Additional Results from the Survey of Adult Skills, Figure 2.13, https://doi.org/10.1787/888934020084.
Proficiency in problem solving in technology-rich environments
The Survey of Adult Skills defines problem solving in technology-rich environments (PSTRE) as “using digital technology, communication tools and networks to acquire and evaluate information, communicate with others and perform practical tasks” (PIAAC Expert Group in Problem Solving in Technology-Rich Environments, 2009[4]). It focuses on “the abilities to solve problems for personal, work and civic purposes by setting up appropriate goals and plans, and accessing and making use of information through computers and computer networks” (OECD, 2012[5]).
Problem solving in technology-rich environments does not measure the cognitive skills required to solve problems in isolation. It measures both problem-solving and basic computer literacy skills (i.e. the capacity to use ICT tools and applications). This is done by assessing how well adults can use ICT tools and applications to assess, process, evaluate and analyse information in a goal-oriented way.
The share of the population for which estimates of proficiency in this domain refer to vary widely, so reporting on PSTRE focuses on defining the population proportions at each proficiency level, rather than on comparing mean proficiency scores (see Box 1.1). The Survey provides two different, albeit related, pieces of information about the capacity of adults to manage information in technology-rich environments. The first is the proportion of adults who are familiar enough with computers to use them to perform information-processing tasks. The second is the proficiency levels among those adults who have that familiarity in solving the sort of problems they are likely to encounter in their roles as workers, citizens and consumers in a technology-rich world.
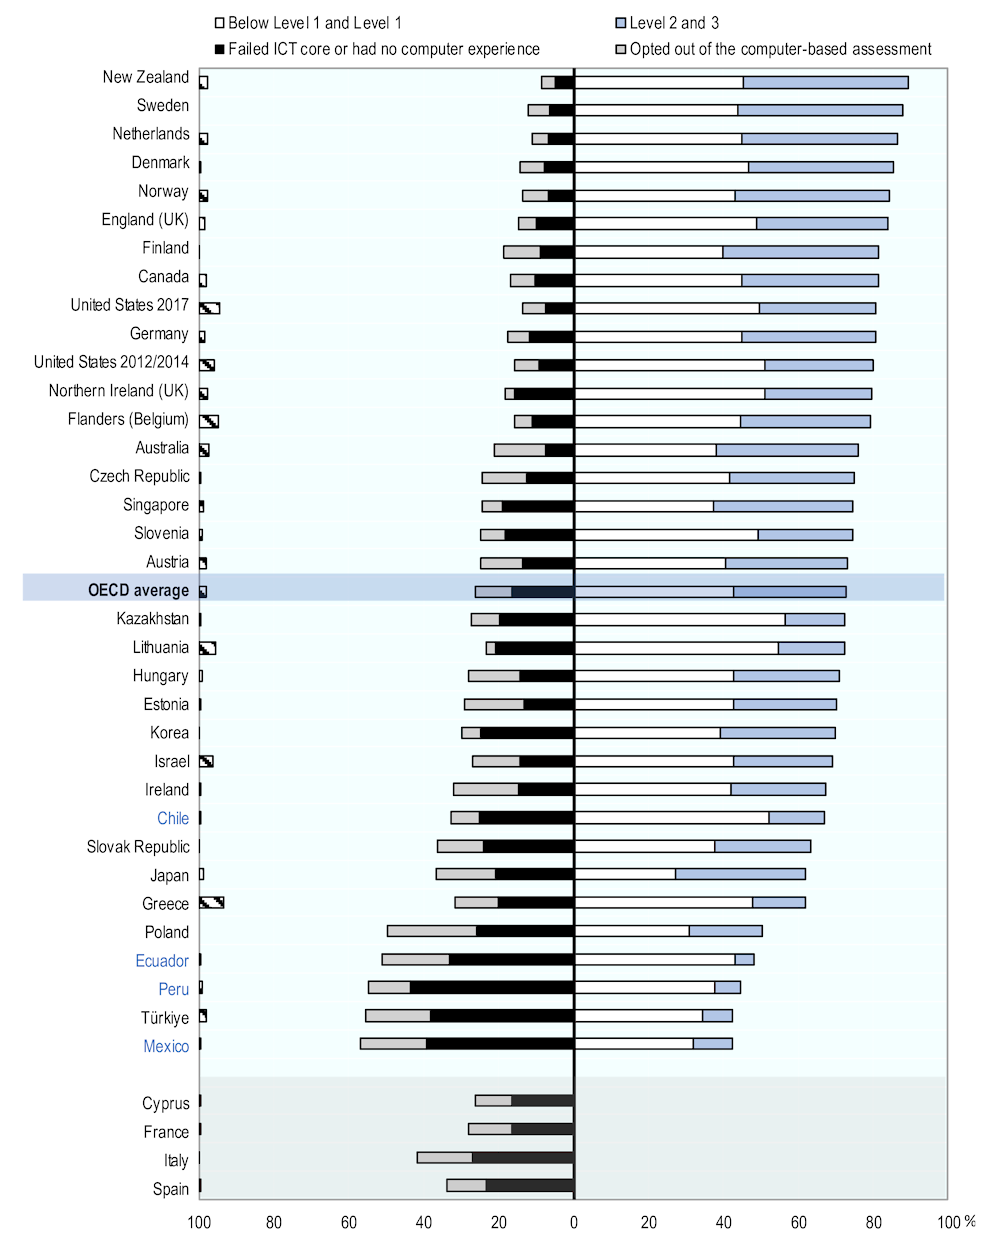
On average, across the OECD countries participating in the Survey of Adult Skills, around one-third of adults (29.7%) are proficient in PSTRE at the two highest levels for this domain (Level 2 or 3). Among the Latin American countries taking part, Chile had a slightly higher proportion of adults who performed at the highest proficiency levels in problem solving than the other three, at 14.6%. In contrast, only one in ten adults achieved these levels in Mexico (10.2%) and less in Ecuador (5.2%) and Peru (6.6%) (Figure 1.6).
At the other end of the spectrum, 43% of adults scored at Level 1 and below on this measure across all participating OECD countries and economies. Among the Latin American countries, Ecuador had a similar proportion of adults scoring at Level 1 and below (43.1%), while in Chile this proportion was higher by almost 10 percentage points (52.4%). In Mexico (32.1%) and Peru (37.8%) however, fewer adults scored at Level 1 and below than the OECD average. These anomalies could be explained by the large shares of adults in these Latin American countries who either failed the ICT core test or had no computer experience (see section below). In other words, smaller shares of adults might be scoring at Level 1 and below in countries like Peru and Mexico because these countries have large proportions of adults who were unable to display enough proficiency in problem solving to have scored at even the lowest levels (Figure 1.6).
Figure 1.6. Proficiency in problem solving in technology-rich environments among adults
Notes: Adults included in the missing category were not able to provide enough background information to impute proficiency scores because of language difficulties, or learning or mental disabilities (referred to as literacy-related non-response). The missing category also includes adults who could not complete the assessment of problem solving in technology-rich environments because of technical problems with the computer used for the survey. Cyprus, France, Italy and Spain did not participate in the problem solving in technology-rich environments assessment.
Countries and economies are ranked in descending order of the combined percentages of adults scoring at Level 2 and 3.
Source: OECD (2019[3]), Skills Matter: Additional Results from the Survey of Adult Skills, Figure 2.15, https://doi.org/10.1787/888934020122.
Basic information and communications technology skills
All participating countries and economies had a substantial proportion of adults who were unable to display proficiency in problem solving in technology-rich environments because they took the assessment in the paper-based format. Three separate groups of adults fall into this category: 1) those with no computer experience; 2) those who failed the ICT core test and thus did not have the basic computer skills needed for the computer-based assessment; and 3) those who opted to take the paper-based version of the assessment even though they reported having ICT experience.
Overall across countries participating in PIAAC, around one in ten adults (11.7%) reported having no computer experience and a further 4.7% of adults did not have the basic ICT skills needed, as assessed by the ICT core test, such as the capacity to use a mouse or scroll through a web page. Latin American countries like Ecuador (32.9%), Mexico (39.2%) and Peru (43.6%) stand out for the considerable proportions of their adult populations who have no prior computer experience or very poor ICT skills.
These results should be understood in context, however. The share of adults without basic ICT skills or computer experience reflects these countries’ level of economic development and ICT penetration. Only about two-fifths of the households in Ecuador (43.9%) and Mexico (44.2%) had access to a computer device at home, while this share was significantly lower in Peru (33.6%) (ITU, 2021[6]). Internet access in these countries also is also quite limited: only around half of households in 2021 had access to functional Internet at home in Ecuador (53.2%) and Peru (48.7%), and the share in Mexico was only slightly higher at 60.6% (ITU, 2021[6]). This is in stark contrast to many high-income OECD countries where more than two-thirds of households have access to a computer, the Internet and a telephone line.
Some adults also preferred not to use a computer in the assessment, despite reporting some prior computer experience. On average, one in ten adults (10.0%) opted to take the paper-based version of the assessment without first taking the ICT core test (Figure 1.6). Among the Latin American countries, a significant proportions of adults in Ecuador (18.1%) and Mexico (17.8%) opted out of the computer-based assessment. While these proportions were similar to those observed in other countries with a similar performance in the Survey such as Türkiye (17.7%), they were also comparable to proportions in relatively better-performing countries like Poland (23.8%) and Ireland (17.4%). In contrast, Peru had a similar share of adults opting out of the computer-based assessment to the overall average (11.1%) while Chile had a far smaller share (7.5%).
Socio-demographic distribution of key information-processing skills
This section analyses the levels of proficiency of different sub-groups of the population taking part in the Survey of Adult Skills (PIAAC), defined in terms of educational attainment, age, gender and socio-economic background. This information is relevant to help policy makers design better and more informed policies. For instance, they could better target policies toward adults with low information-processing skills to reduce disparities and improve human capital. The results could also be used to better understand the strengths and weaknesses of current and past policies targeting adults in different age groups or levels of educational attainment, and to reflect on the outcomes of policies that were in place when those adults were attending education.
First, we look at differences in skill levels of adults based on their educational attainment. This analysis is split into two parts: assessing the proficiencies of adults aged 25-64 years, and a similar analysis for those aged 16-24 years. We split up this analysis because younger adults, might still be in education or have not yet made important educational choices. As a result, they are hardly comparable to older adults in terms of their highest completed level of education, and deserve a separate analysis.
We then also look at the skill proficiencies of adults based on their age, their gender and their socio-economic status.
Skills proficiency and educational attainment among 25-65 year-olds
Standardised large-scale assessments like PIAAC are popular and relevant because they provide comparable cross-country measures of the skills of respondents. One of the key contributions of PIAAC has been the expansion of the concept of human capital by going beyond educational attainment to include real measures of skills. This is its main advantage over more traditional (and easier to collect) indicators such as the number of years of schooling completed. Indeed, the PIAAC survey shows large differences in literacy and numeracy proficiency among adults with the same level of education, especially among people who have completed their schooling in different countries. This is not to downplay the importance of information about educational attainment. As formal schooling is the main (although not the only) vehicle for educating and building the skills of a country's population, joint analyses of these two sources of information provide essential insights for policy makers who wish to assess the state of their educational systems.
Cross-country comparisons should also always be interpreted with some care. As educational systems vary widely across countries and over time, the correct interpretation of the relationship between education and skills often requires supplementary information about the history of educational policies in different countries. This issue is even more complicated because different countries and economies participated in PIAAC in different years.
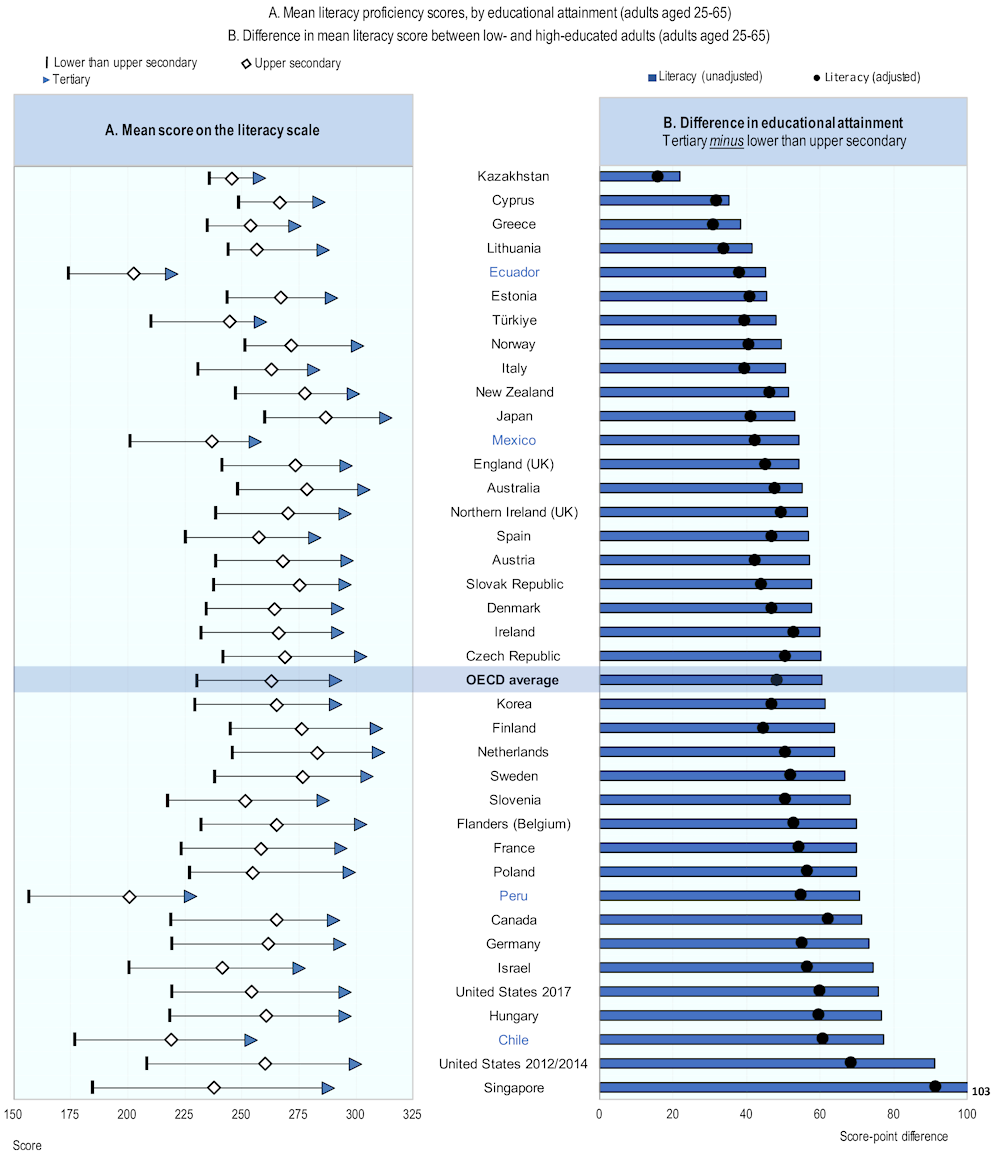
Across all countries and economies, more highly educated adults perform better in the PIAAC assessment (Figure 1.7). Among the OECD countries and economies that participated in PIAAC, the average difference in literacy scores between tertiary-educated adults and adults with below upper secondary education is 61 score points. Looking at the Latin American countries participating in PIAAC Cycle 1, the average score difference between tertiary-educated adults and adults with below upper secondary education in Ecuador and Mexico remains substantial but is smaller than the OECD average (45 points for Ecuador and 52 points for Mexico). In contrast, the difference is larger than the OECD average for Peru, at 71 points, and Chile, at 77 points. This large difference in Peru and Chile can be attributed specifically to the low performance of adults without an upper secondary qualification (discussed below).
Besides the differences in performance between adults at different levels of academic achievement, performance figures for each of these groups are also telling. In Ecuador, Mexico and Peru, performance in literacy and numeracy is consistently below the corresponding OECD average for all levels of educational attainment. Proficiency is especially low among adults without an upper secondary qualification in Peru, who scored 157 in literacy on average and 127 in numeracy. These are well below the levels registered in Chile (177 score points in literacy and 154 score points in numeracy), Ecuador (174 and 160 score points) and Mexico (201 and 189 score points). Reflecting their low average score, 67% of adults in Peru without an upper secondary qualification scored below Level 1 in literacy and 78% in numeracy, by far the largest share among all countries participating in PIAAC, while Ecuador came second with 50% below Level 1 in literacy and 61% in numeracy.
On the other hand, tertiary-educated adults in Peru have greater literacy and numeracy proficiency than tertiary-educated adults in Ecuador, although in both countries they still performed significantly worse than their peers in Chile and Mexico. Among adults with upper secondary education or below, those in Mexico have the highest proficiency in literacy and numeracy among Latin American countries taking part in PIAAC, while the scores for tertiary-educated adults in Mexico are in line with those of tertiary-educated adults in Chile.
Figure 1.7. Differences in literacy proficiency, by educational attainment
Notes: All differences in Panel B are statistically significant. Unadjusted differences are the differences between the two means for each contrast category. Adjusted differences are based on a regression model and take account of differences associated with other factors: age, gender, immigrant and language background and parents' educational attainment. Only the score-point differences between two contrast categories are shown in Panel B, which is useful for showing the relative significance of educational attainment with regard to observed score-point differences. Lower than upper secondary includes ISCED-97 1, 2 and 3C short. Upper secondary includes ISCED-97 3A, 3B, 3C long and 4. Tertiary includes ISCED-97 5A, 5B and 6. Where possible, foreign qualifications are included as the closest corresponding level in the respective national education systems.
Countries and economies are ranked in ascending order of the unadjusted differences in literacy scores (tertiary minus lower than upper secondary).
Source: OECD (2019[3]), Skills Matter: Additional Results from the Survey of Adult Skills, Figure 3.2, https://doi.org/10.1787/888934020179.
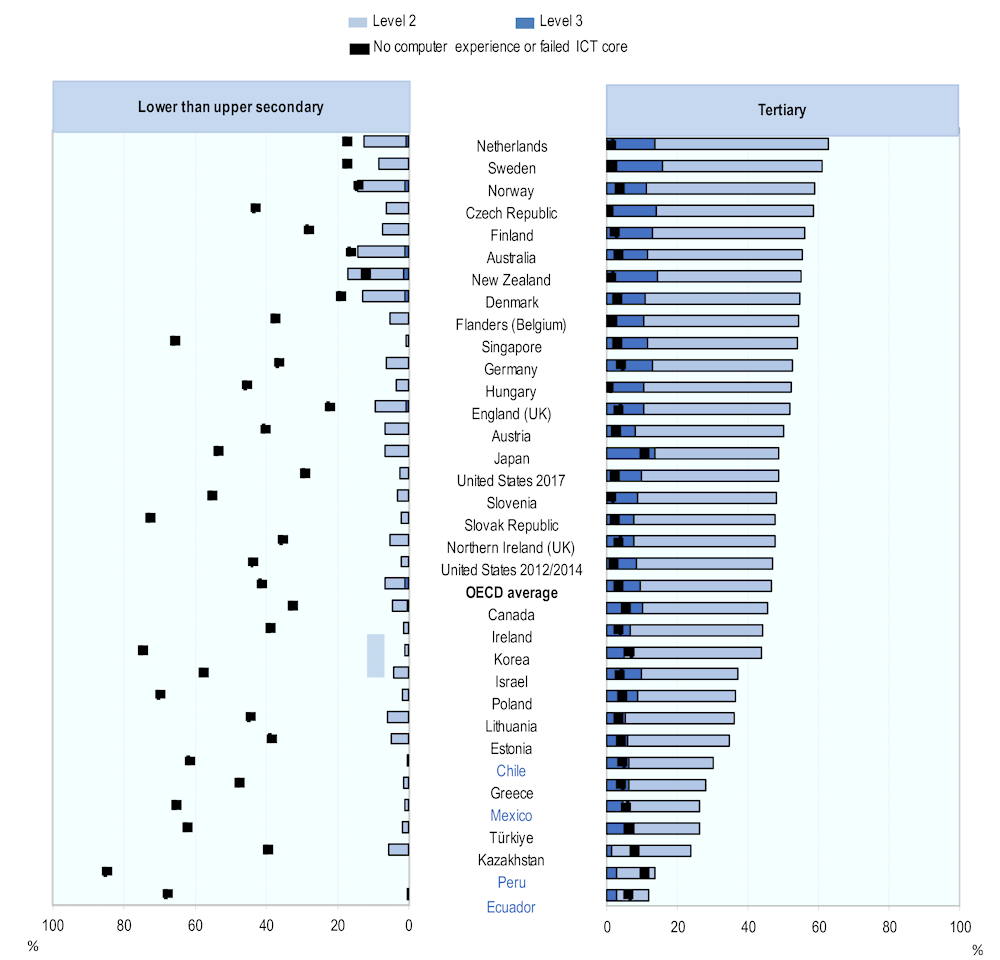
Figure 1.8. Differences in problem-solving proficiency, by educational attainment
Notes: For the purpose of computing the percentages presented in the graph, adults participating in PIAAC have been classified in one of the following mutually exclusive categories: opted out of the computer-based assessment; no computer experience; failed the ICT core test; below Level 1, at Level 1, at Level 2, at Level 3 (of the problem solving in technology-rich environments scale). For more detailed results for each category see the source below. Lower than upper secondary includes ISCED-97 1, 2 and 3C short. Upper secondary includes ISCED-97 3A, 3B, 3C long and 4. Tertiary includes ISCED-97 5A, 5B and 6. Where possible, foreign qualifications are included as the closest corresponding level in the respective national education systems. Cyprus, France, Italy and Spain did not participate in the problem solving in technology-rich environments assessment.
Countries and economies are ranked in descending order of the combined percentages of adults with tertiary attainment scoring at Levels 2 or 3.
Source: OECD (2019[3]), Skills Matter: Additional Results from the Survey of Adult Skills, Figure 3.3, https://doi.org/10.1787/888934020198.
Differences in proficiency related to educational attainment are even larger in problem solving in technology-rich environments (Figure 1.8). In most countries and economies, a large share of low-educated adults (those without upper secondary education) lacked even the fundamental ICT skills needed for the problem-solving assessment. As a result, 41% of low-educated respondents across OECD countries did not receive a score in this domain. The share was even larger in the Latin American countries, at around 60% in Chile, approaching 70% in Ecuador and Mexico, and surpassing 85% in Peru.
The low-educated adults who undertook the problem-solving assessment performed rather poorly. As a result, the overall share of low-educated adults scoring at Level 2 or 3 is very small, averaging 7% across OECD countries. This share is negligible among the Latin American countries – around 1% for Mexico and even lower for the other three countries. In contrast, close to 48% of tertiary-educated adults across OECD countries scored at Level 2 or 3 in the problem-solving assessment on average. This share was much lower in the Latin American countries: 12% in Ecuador, 14% in Peru, 26% in Mexico and 30% in Chile.
Skills proficiency and educational attainment among 16-24-year-olds
The analyses here classify young adults into three groups, defined as the key transition points in the “typical” pathways throughout the education system. The first group comprises so-called “early school leavers”, i.e. young adults who have left formal education without achieving an upper secondary qualification. The second comprises those who completed upper secondary education but decided not to enrol in tertiary education. The third group comprises young adults enrolled in tertiary education or who have already completed a tertiary qualification. In the case of this latter group, the analysis is restricted to respondents aged 20 to 24 years, because country differences in the typical age at which students graduate from upper secondary school would generate large (and artificial) differences across countries in the share of 16-19-year-olds who are enrolled in tertiary education.
Figure 1.9 shows significant gaps in literacy proficiency between early school leavers and other young adults, averaging 41 score points across OECD countries. This proficiency gap is close to the OECD average in all the Latin American participants, with one exception: at 59 points, Chile has the highest score gap between early school leavers and other young adults of all PIAAC participating countries and economies. This large gap is a combination of two factors: a below-average performance of early school leavers (184 points, against an OECD average of 236) and the performance of young adults still in education or who have attained an upper secondary qualification, which is higher than in other Latin American countries, at 243 score points.
The literacy proficiency of young early school leavers in Ecuador and Peru is the lowest among all participating countries and economies, at 173 and 176 score points, respectively, slightly below Chile. Early school leavers in Mexico also performed below the OECD average, at 211 score points. In practice, the relevance of this gap depends on the share of young people who leave school early. Mexico stands out in this respect: 36% of its 16-24-year-olds can be classified as early school leavers. Leaving school early is less widespread in Ecuador (19% of 16-24-year-olds), and Peru (13%), although still above the OECD average of 11%. In Chile this proportion is even smaller: only 9% of the 16-24 year-olds are early school leavers.
Figure 1.9. Differences in literacy proficiency among 16-24-year-olds, by educational attainment
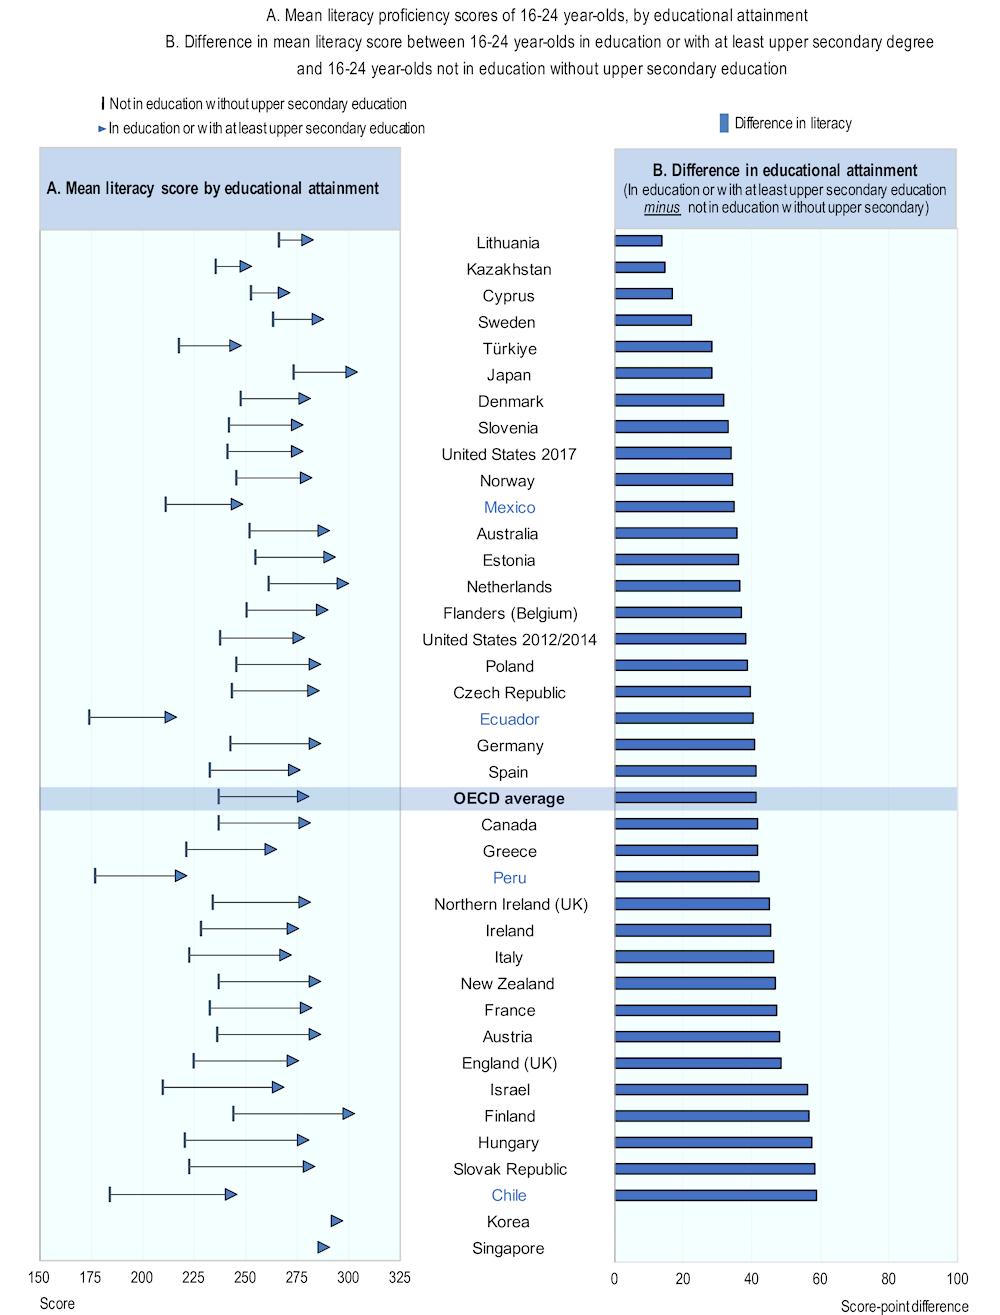
Notes: All differences in Panel B are statistically significant. Estimates based on a sample size of less than 30 are not shown in Panels A and B (Korea and Singapore). Lower than upper secondary includes ISCED-97 1, 2 and 3C short. Upper secondary includes ISCED-97 3A, 3B, 3C long and 4. Tertiary includes ISCED-97 5A, 5B and 6. Where possible, foreign qualifications are included as the closest corresponding level in the respective national education systems.
Countries and economies are ranked in ascending order of the differences in literacy scores (in education or with at least upper secondary education minus not in education without upper secondary).
Source: OECD (2019[3]), Skills Matter: Additional Results from the Survey of Adult Skills, Figure 3.4, https://doi.org/10.1787/888934020217.
Figure 1.10. Differences in literacy proficiency among 20-24-year-olds, by educational attainment
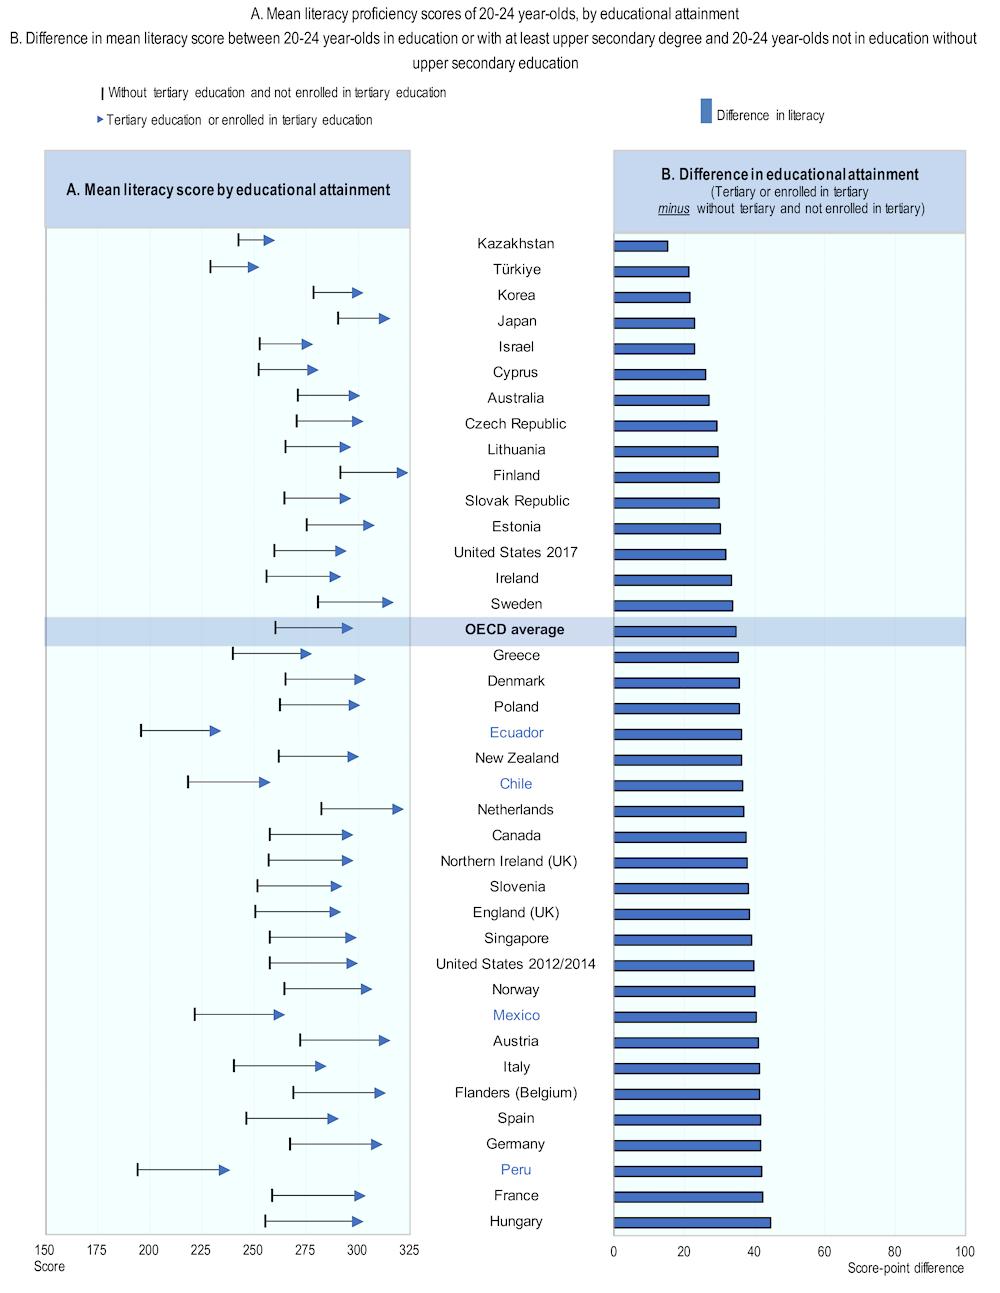
Notes: All differences in Panel B are statistically significant. Tertiary includes ISCED-97 5A, 5B and 6. Where possible, foreign qualifications are included as the closest corresponding level in the respective national education systems.
Countries and economies are ranked in ascending order of the differences in literacy scores (Tertiary or enrolled in tertiary minus without tertiary and not enrolled in tertiary).
Source: OECD (2019[3]), Skills Matter: Additional Results from the Survey of Adult Skills, Figure 3.5, https://doi.org/10.1787/888934020236.
Among 20-24-year-olds, those currently enrolled in tertiary education or with a tertiary qualification have higher proficiency levels than their peers who completed upper secondary education but are not enrolled in tertiary education (Figure 1.10). The average gap in literacy proficiency between these two groups is 35 score points across OECD countries. The gap is wider among all Latin American participants. However, in Ecuador and Chile, the gap is only just larger (36 score points in Ecuador and 37 score points in Chile), while the difference is far larger in Mexico (41 score points) and Peru (42 score points).
It is also important to note that in Ecuador and Peru, the proficiency of these young adults, whether enrolled in tertiary education or not, is the lowest among all participating countries and economies. The scores for young adults enrolled in tertiary education averaged 236 in Peru, and 232 in Ecuador, compared to the OECD average of 295 score points. The order is reversed for young adults not enrolled at the tertiary level: 194 score points in Peru and 195 in Ecuador, compared to the OECD average of 260 score points. Young adults in Mexico and Chile perform better than their counterparts in Ecuador and Peru, but only marginally. The scores for young adults enrolled in tertiary education averaged 255 in Chile and 262 in Mexico. Similarly, scores for young adults not enrolled in tertiary education averaged 218 score points in Chile and 221 in Mexico (Figure 1.10).
Skills proficiency and age
One of the primary objectives of the Survey of Adult Skills is to shed light on the mechanisms that drive the evolution of skills over people’s lifetimes. This task is not easy, as proficiency is influenced by factors that are not easily distinguishable. These factors can be classified into three broad categories: 1) investments in skills, in the form of formal education or adult training; 2) biological processes that drive cognitive functioning; and 3) life experiences, such as employment status or personal interests, that lead to the practice of skills at work or in daily life. Importantly, these factors are likely to be interdependent: education can affect labour-market opportunities. The use of skills at work and even biological ageing process might have different consequences depending on life circumstances and the intensity of skills use.
In cross-sectional data like those collected in the Survey of Adult Skills, observed differences in proficiency by age are inevitably the combined result of age effects (i.e. the consequences of growing older), cohort effects (i.e. the consequences of being born in a particular year, and therefore being exposed to experiences such as a specific type of education), and period effects (i.e. shocks that take place at a given point in time and affect all cohorts in the same way). Controlling for observable differences across individuals born in different years (notably for differences in the level of education) can help to identify age effects, assuming that the quality of education does not change over time.
In most countries and economies, the relationship between age and proficiency is an inverted U-shaped curve, with a peak between the mid-twenties and the early thirties. In contrast, proficiency declines linearly with age in Ecuador, Mexico and Peru, the Latin American countries that reported these data in PIAAC Cycle 1. This is probably because upper secondary attainment rates in these countries have only recently increased. On average across OECD countries, only 15% of 25-34-year-olds have not completed their upper secondary education, compared to 50% in Mexico, 36% in Ecuador and 26% in Peru. When looking at adults under 25, the share of respondents who have completed upper secondary education is close to the OECD average of 59% in Ecuador (57%) and higher in Peru (76%). It is not very distant in Mexico (43%). This is a good example of how the relationship between age and proficiency in cross-sectional data is influenced by cohort effects, such as different cohorts experiencing the impact of different education policies.
Figure 1.11 presents the average literacy score of adults in different age bands and the average difference between 55-65-year-olds and 25-34-year-olds. In most countries, these two groups have the lowest and highest average scores in literacy, respectively. Literacy proficiency among older adults is lowest in Peru (175 score points) and Ecuador (181 score points). In these countries, about half the adult population aged 55-65 scored below Level 1, and about one-third at Level 1. Proficiency among older adults in Chile and Mexico is slightly higher: averaging 194 score points in Chile and 197 in Mexico, although around one-third still scored below Level 1 and about one-third at Level 1.
Just as with the older age group, Ecuador and Peru also recorded the lowest average proficiencies for those aged 25-34: 202 score points in Ecuador and 203 score points in Peru. Two-thirds of these adults in those countries scored at or below Level 1 in literacy. In comparison, average proficiency among younger adults is significantly higher in Mexico (230 score points) and Chile (235 score points), and the share of adults scoring at or below Level 1 in literacy in these countries is lower than in Peru and Ecuador. A little more than one-third of the population performed at or below Level 1 in Mexico and Chile.
Thus, as Figure 1.11 shows, Ecuador and Peru performed at the lower end of the spectrum for both younger and older adults, while Chile and Mexico reported much better results. There is also quite a lot of variation in the differences between the older and younger age groups across Latin American countries. In Peru, the difference in performance between older and younger age groups is 28 score points, similar to the OECD average of 29 score points. However, the performance gap is lower in Ecuador, at 21 score points, and higher in Mexico, where it is 33 score points, and much higher in Chile, where the gap is 41 points.
In most countries and economies, about half of the gap can be accounted for by differences in observable characteristics, notably in educational attainment, as younger cohorts are normally more educated than older cohorts. This effect is more substantial in Ecuador and Peru, where the differences are as small as 8 and 7 points, respectively, once adjusted for educational attainment. Both countries have recently experienced a significant expansion of basic education. While 58% of older adults in Peru and 68% in Ecuador have not completed upper secondary education, these shares drop to 26% in Peru and 36% in Ecuador among 25-34-year-olds. This is a much more pronounced difference between the two groups than the average of 20 percentage points across OECD countries, where educational expansion occurred earlier.
As the assessment of problem solving in technology-rich environment (PSTRE) required test takers to have some basic familiarity with digital devices and applications, it might be expected that age differences would be more pronounced in this domain. Indeed, Figure 1.12 shows particularly low proficiency levels in this area among older adults. In Chile, Ecuador, Mexico and Peru, the vast majority of older adults (55-65-year-olds) did not undertake the problem-solving assessment because they lacked the necessary ICT experience or failed the basic test of ICT skills. As a result, negligible proportions of older adults demonstrated problem-solving proficiency at Level 2 and none at Level 3 in these four countries.
When looking at younger adults, it is more interesting to look at their actual level of proficiency rather than the difference between them and older adults. Digital technologies might not yet be as widespread in middle-income countries as they are in more developed ones. Still, the fast adoption of digital technologies will be essential if these countries are to reap the benefits of globalisation, technological change and economic integration (OECD, 2019[7]).
From this perspective, it is concerning to see low ICT proficiency levels even among younger adults in these countries. Mexico and Peru have the highest shares of 25-34-year-olds failing the core ICT test or having no ICT experience (28% in Mexico and 33% in Peru). Ecuador does slightly better, at 22%, but is still well behind Chile (13%). The proportion of 25-34-year-olds failing the core ICT test or having no ICT experience in the Latin American countries is much higher than the OECD average of 8%. The share of this age group scoring at Level 2 or 3 is only 7% in Ecuador, 9% in Peru and 13% in Mexico. The percentage of 25-34-year-olds scoring at Level 2 or 3 in Chile is substantially higher at 24%, but still below the OECD average of 43%.
However, when looking at the youngest adults (16-24-year-olds), there are some signs of potential improvement over time (i.e. comparing the older to younger cohorts) in the lowest performing countries. While the share of 16-24-year-olds scoring at Level 2 or 3 remains very low (25% in Chile, 18% in Mexico, and less than 12% in Ecuador and Peru), these young adults were less likely than 25-34-year-olds to opt out of the computer-based assessment, fail the ICT core test or to lack ICT experience.
Figure 1.11. Differences in literacy proficiency, by age
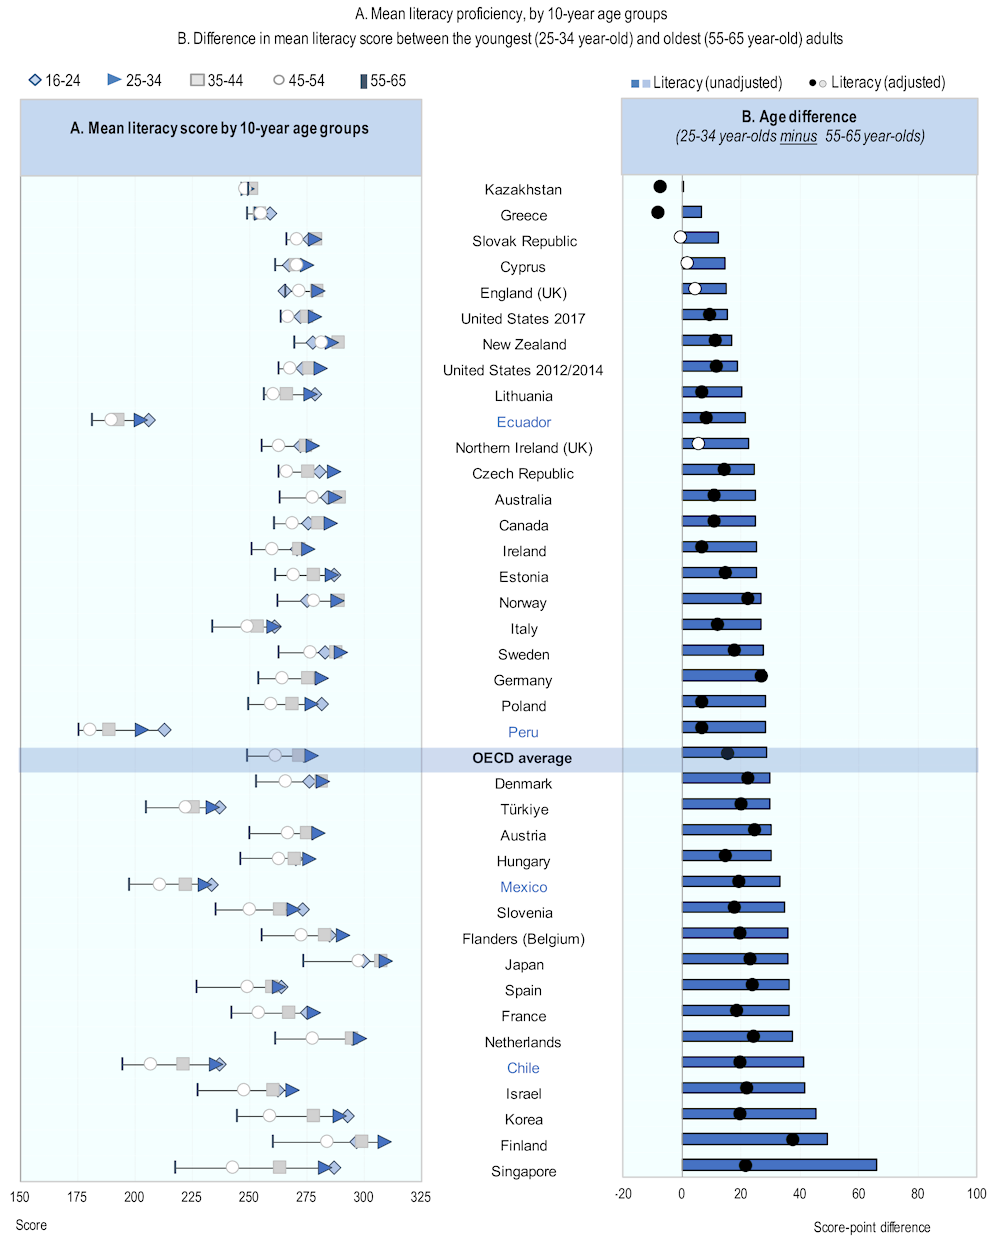
Notes: Statistically significant differences in Panel B are marked in a darker tone. Unadjusted differences are the differences between the two means for each contrast category. Adjusted differences are based on a regression model and take account of differences associated with other factors: gender, education, immigrant and language background and parents' educational attainment. Only the score-point differences between two contrast categories are shown in Panel B, which is useful for showing the relative significance of age with regard to observed score-point differences.
Countries and economies are ranked in ascending order of the difference in literacy scores (25-34 year-olds minus 55-65 year-olds).
Source: OECD (2019[3]), Skills Matter: Additional Results from the Survey of Adult Skills, Figure 3.7, https://doi.org/10.1787/888934020274.
Figure 1.12. Differences in problem-solving proficiency, by age
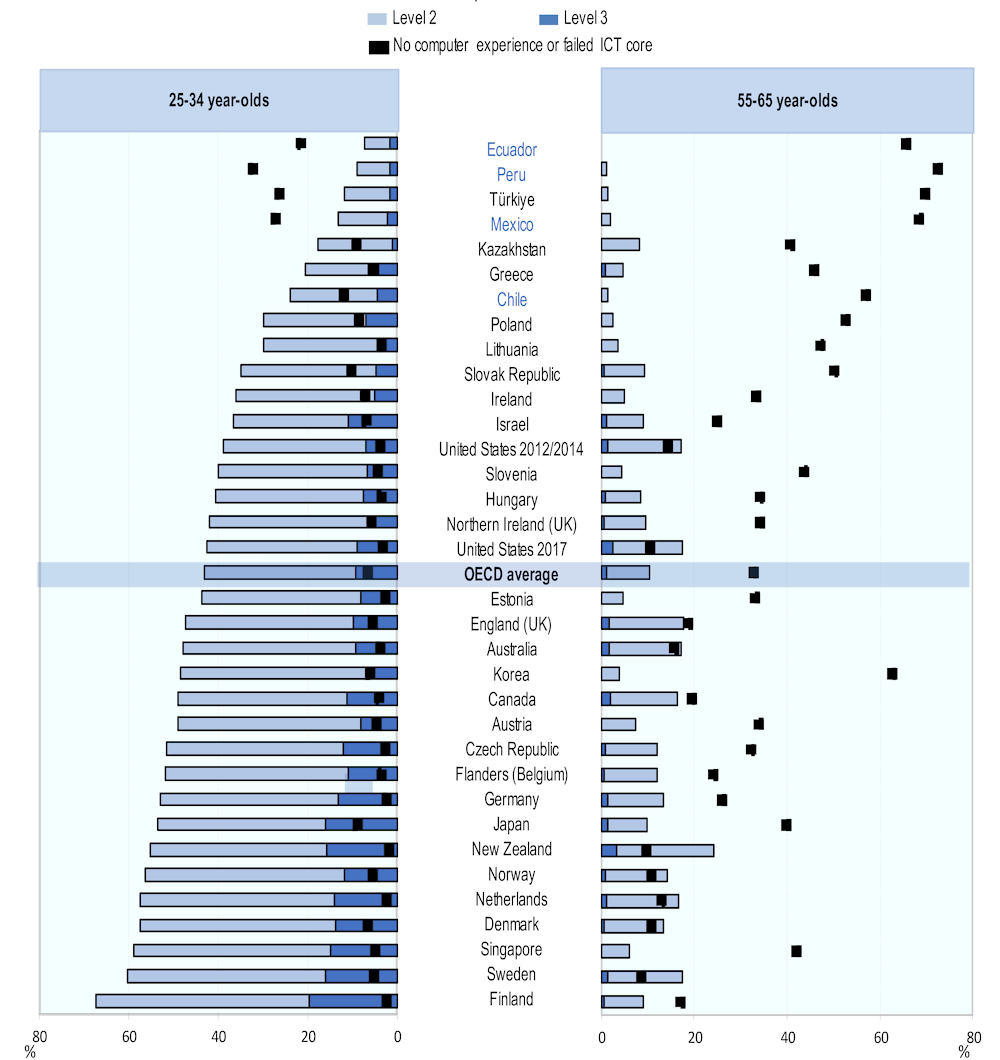
Notes: Percentages on the problem solving in technology-rich environments scale are computed so that the sum of percentages for the following mutually exhaustive categories equals 100%: opted out of the computer-based assessment; no computer experience; failed ICT core test; below Level 1, Level 1, Level 2 and Level 3. For more detailed results for each category, see corresponding table mentioned in the source below. Cyprus, France, Italy and Spain did not participate in the problem solving in technology-rich environments assessment.
Countries and economies are ranked in descending order of the combined percentages of adults aged 25-34 scoring at Level 2 or 3.
Source: OECD (2019[3]), Skills Matter: Additional Results from the Survey of Adult Skills, Figure 3.8, https://doi.org/10.1787/888934020293.
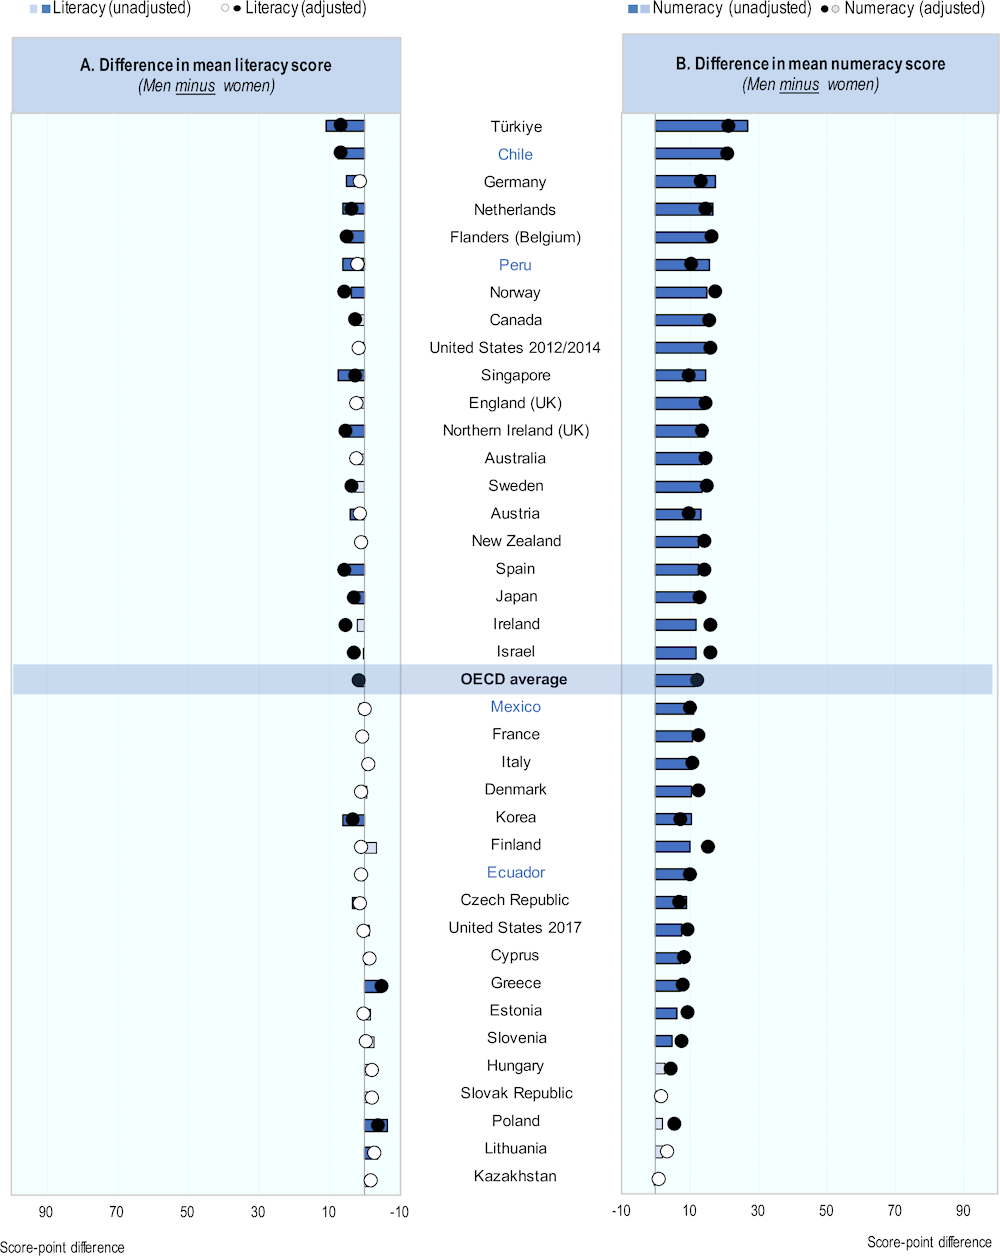
Figure 1.13. Differences in literacy and numeracy proficiency, by gender
Note: Statistically significant differences are marked in a darker tone. Unadjusted differences are the differences between the two means for each contrast category. Adjusted differences are based on a regression model and take account of differences associated with other factors: gender, education, immigrant background, language and parents' educational attainment.
Countries and economies are ranked in ascending order of the difference in numeracy scores (men minus women).
Source: OECD (2019[3]), Skills Matter: Additional Results from the Survey of Adult Skills, Figure 3.9, https://doi.org/10.1787/888934020312.
Skills proficiency and gender
Gender differences in literacy and numeracy skills vary by country and by domain. They tend to be smaller in literacy than numeracy, and Latin American countries are no exception Figure 1.13). The gender gap in numeracy is above the OECD average of 11 score points in Peru (16 score points) and Chile 21 score points).
Gender differences are typically more pronounced among older adults for two reasons. The first is that women's educational attainment has progressively caught up with that of men. The second is that women and men still tend to make different occupational choices or have different labour-market outcomes for a given level of education, which might affect the extent to which they have the opportunity to practise and maintain their level of proficiency. This is particularly evident in Peru and Chile, where the gender gaps in numeracy for adults aged 25 and over are as high as 19 score points in Peru and 24 in Chile (among the highest across all PIAAC participants), but fall to 5 and 8 score points respectively among adults aged 24 and under, below the OECD average. This is probably because it is only among these younger adults that women have roughly similar levels of educational attainment to men. In all age groups over 25, women are over-represented among adults without an upper secondary education and under-represented among upper secondary educated adults. A similar pattern (although on a smaller scale) is also evident for gender gaps in literacy.
Among adults aged 45 and over, gender gaps in numeracy are wider than the OECD average in Chile, Ecuador and Peru, but are much smaller for adults below that age. A similar pattern is observed in Mexico, although the gender gap among older adults is in line with the OECD average.
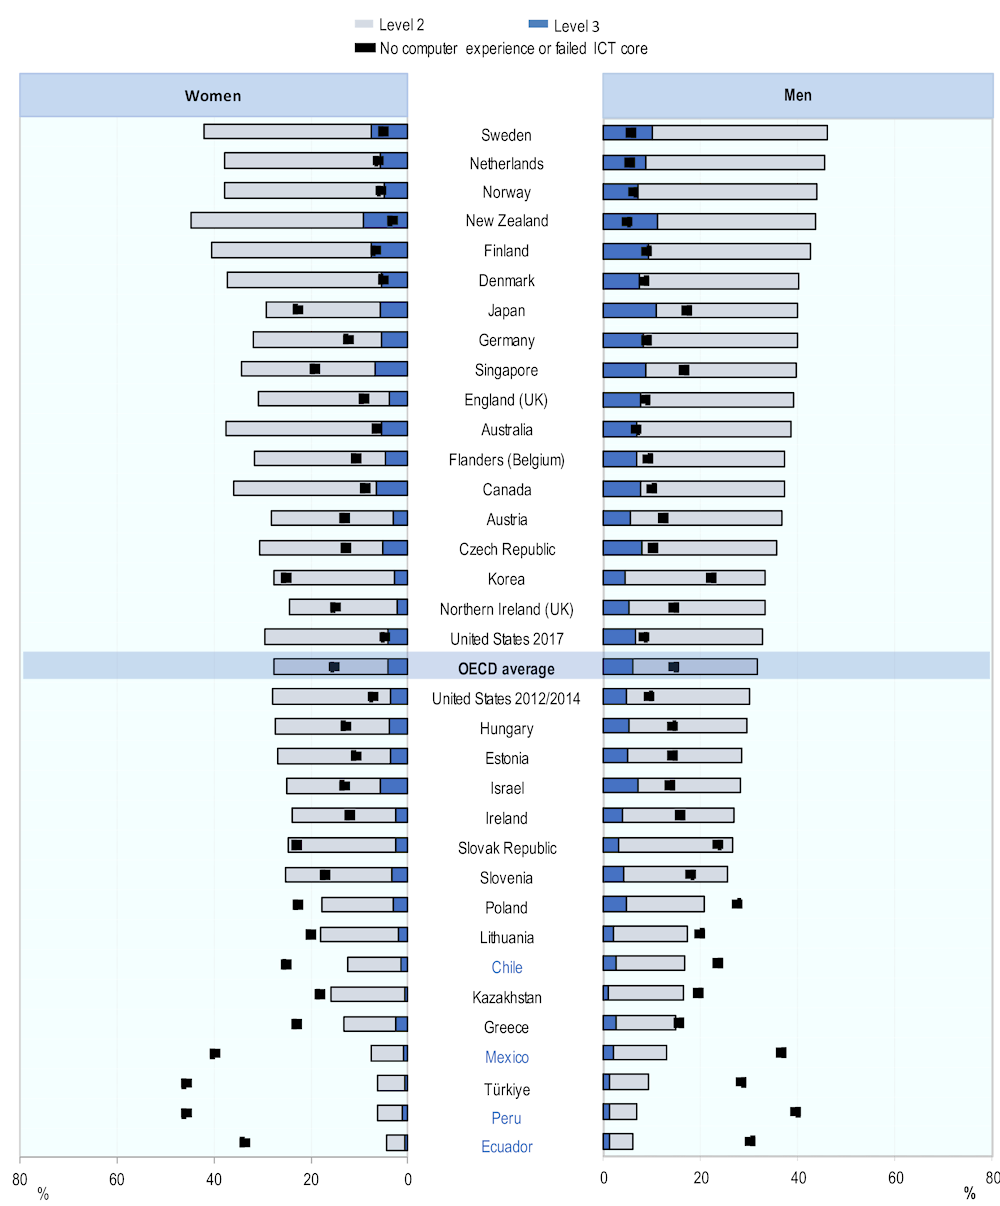
Gender differences are not particularly pronounced in problem-solving skills, where men have only a slight advantage (Figure 1.14). On average, across OECD countries, 32% of men score at Level 2 or 3, compared to 28% of women, while a similar share of men and women have no computer experience or failed the ICT core test. Gender gaps in Ecuador and Peru are less pronounced at the top of the distribution: the percentage of men scoring at the two highest levels is 6% in Ecuador and 7% in Peru, while the corresponding shares for women are 4% in Ecuador and 6% in Peru. The gaps are slightly more significant for the other two Latin American countries: 13% of men in Mexico score at the two highest levels, compared to 8% of women, while in Chile the shares are 17% of men and 12% of women.
At the bottom end of the distribution, a larger share of women had no computer experience or failed the ICT core test in Ecuador and Peru: 35% in Ecuador, compared to 31% of men, and 47% in Peru, compared to 41% of men. In contrast, Chile and Mexico have smaller differences between men and women who reported having no prior computer experience or who failed the ICT core test: 26% of women and 24% of men in Chile, and 41% of women and 38% of men in Mexico.
Figure 1.14. Differences in problem-solving proficiency, by gender
Note: Percentages for the problem solving in technology-rich environments scale are computed so that the sum of percentages for the following mutually exhaustive categories equals 100%: opted out of the computer-based assessment; no computer experience; failed ICT core test; below Level 1, Level 1, Level 2 and Level 3. For more detailed results for each category, see the corresponding table mentioned in the source below. Cyprus, France, Italy and Spain did not participate in the problem solving in technology-rich environments assessment.
Countries and economies are ranked in descending order of the combined percentages of men scoring at Level 2 or 3.
Source: OECD (2019[3]), Skills Matter: Additional Results from the Survey of Adult Skills, Figure 3.11, https://doi.org/10.1787/888934020350.
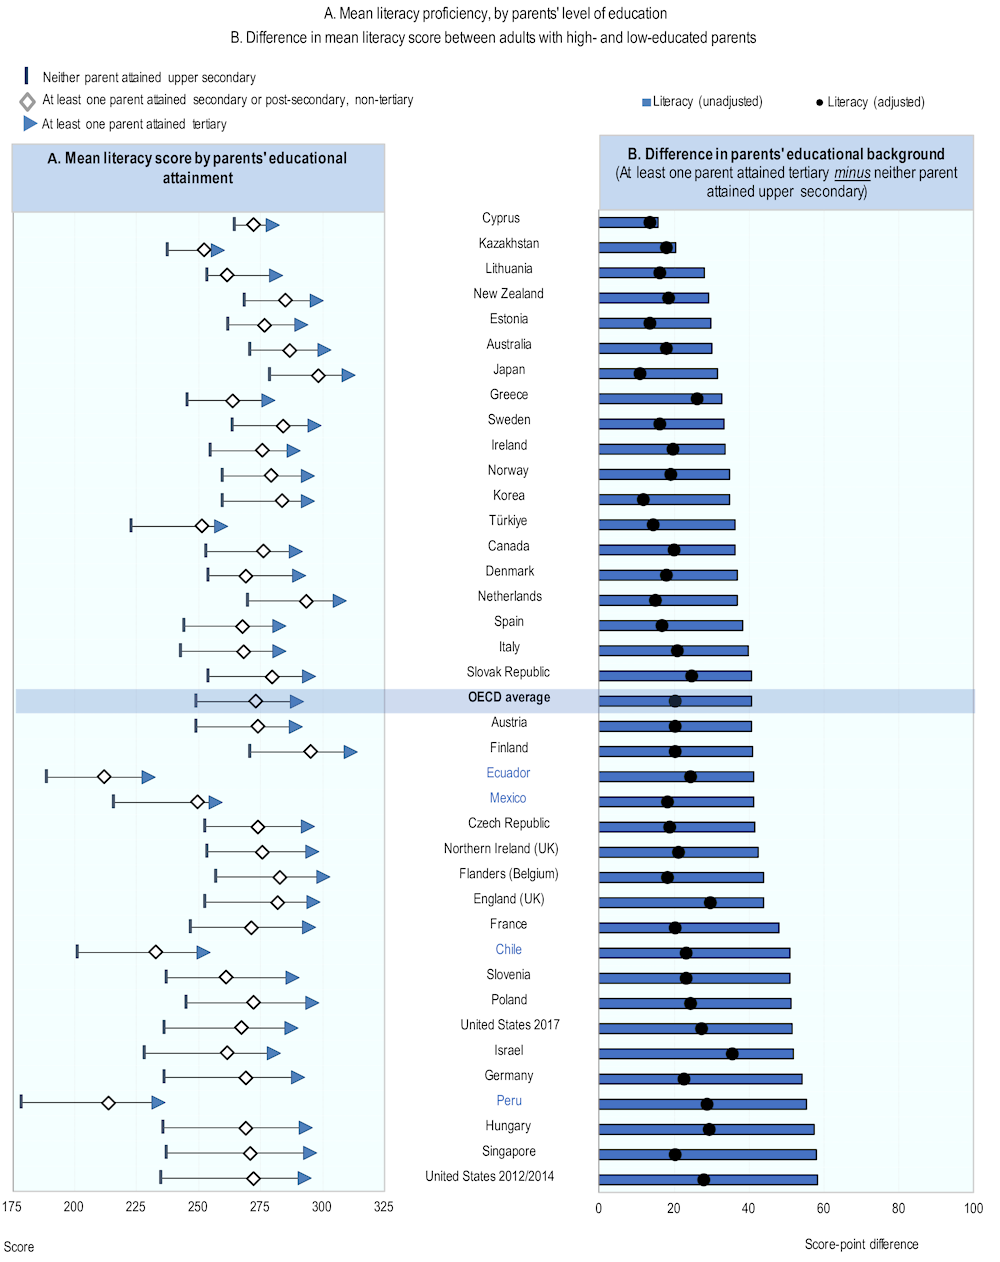
Figure 1.15. Differences in literacy proficiency, by parents' educational attainment
Note: All differences in Panel B are statistically significant. Unadjusted differences are the differences between the two means for each contrast category. Adjusted differences are based on a regression model and take account of differences associated with other factors: age, gender, education, immigrant and language background. Only the score-point differences between two contrast categories are shown in Panel B, which is useful for showing the relative significance of parents' educational attainment with regard to observed score-point differences. Upper secondary includes ISCED-97 3A, 3B, 3C long and 4. Tertiary includes ISCED-97 5A, 5B and 6.
Countries and economies are ranked in ascending order of the unadjusted difference in literacy scores (at least one parent attained tertiary minus neither parent attained upper secondary).
Source: OECD (2019[3]), Skills Matter: Additional Results from the Survey of Adult Skills, Figure 3.12, https://doi.org/10.1787/888934020369.
Skills proficiency and socio-economic background
It is well known that the family background in which people grow up is a crucial factor affecting outcomes such as educational attainment or earnings. Given that people cannot choose their family background, reducing its impact on outcomes is often considered an important policy objective to increase equality of opportunity.
The best proxy for socio-economic background available in the Survey of Adult Skills is the level of educational attainment attained by the parents of the participants. Results based on this indicator confirm the importance of socio-economic background on adults’ outcomes. In the first cycle of the PIAAC study, adults with at least one tertiary-educated parent scored on average 41 points more in literacy proficiency than adults from families where neither parent attained upper secondary education (Figure 1.15). In Ecuador and Mexico, the differences are very close to the OECD average, at 41 score points; but they are higher in Chile (51 score points) and Peru (55 score points).
Much of this raw difference is accounted for by differences in other personal characteristics, as socio-economic background mainly works through the intergenerational transmission of educational attainment. That is, adults with highly educated parents are more likely to attain higher education themselves. In most countries, the differences adjusted for personal characteristics are about half the size of the unadjusted ones mentioned above (Figure 1.15). Differences in literacy proficiency adjusted for personal characteristics are slightly below the OECD average of 20 score points in Mexico (18 score points), but higher in Chile (23 score points), Ecuador (24 score points) and Peru (29 score points).
Conclusion
The Latin American countries that participated in Cycle 1 of PIAAC – Chile, Ecuador, Mexico and Peru – stand out as having low overall proficiency in all three domains assessed in PIAAC. Ecuador and Peru had the lowest mean scores among the participating countries and the largest shares of working-age adults performing at the lowest proficiency levels. Chile and Mexico perform only slightly better, but their performances in most cases are also lower than the OECD average. These performances reflect a range of factors such as the quality of the education system, economic development and historical levels of educational participation. These results are also aligned with studies of school-age children, such as the Programme for International Student Assessment (PISA), which found that among economies with a per capita gross domestic product (GDP) below USD 20 000, the greater the country’s wealth, the higher its mean score on the PISA reading test. This indicates a positive relationship between per capita national income and performance until a minimum threshold is reached (OECD, 2018[8]; OECD, 2012[9]).
The report has also highlighted the proficiency levels of different sub-groups of the population, defined according to several socio-demographic characteristics. The analysis has confirmed some expected results, such as the association between proficiency and educational attainment, the age-proficiency profile, and the extent to which men and women perform differently in different domains.
While these associations are similar to those found across most countries and economies, some peculiarities have emerged from the analysis, some of which can be traced back to each country’s unique history of development and differences in policies. For example, the analysis has shown that, while Latin American countries in PIAAC tend to have lower performance across the board, they seem to be benefiting from the recent expansion in access to education. This is corroborated by more highly educated young cohorts having greater proficiency than older adults. At the same time, young early school leavers in Ecuador and Peru demonstrated an extremely low level of proficiency, which calls for targeted policies to address the needs of this particularly vulnerable group of people.
The low proficiency levels in computing skills among working-age adults in Latin American countries represent a challenge for their governments. Some commentators claim that middle-income countries might lack the capacity to absorb the use of digital technologies compared to high-income countries, meaning their demand for and supply of ICT skills will be different. Moreover, to some extent, the use of new technology, particularly digital technology, depends on the educational levels of the population, including their information-processing skills, as does the dissemination of digitally based services. At the same time, PIAAC provides examples of very high-income countries with large proportions of adults with low proficiency in literacy and numeracy (e.g. Singapore and the United States) as well as examples of countries (Korea and Singapore) that have, over the last half century, successfully increased the proficiency of successive generations from a similar starting point to where Ecuador and Peru currently find themselves.
References
[6] ITU (2021), ICT Statistics, International Telecommunication Union, https://www.itu.int/en/ITU-D/Statistics/Pages/stat/default.aspx.
[7] OECD (2019), OECD Skills Outlook 2019: Thriving in a Digital World, OECD Publishing, Paris, https://doi.org/10.1787/df80bc12-en.
[3] OECD (2019), Skills Matter: Additional Results from the Survey of Adult Skills, OECD Skills Studies, OECD Publishing, Paris, https://doi.org/10.1787/1f029d8f-en.
[8] OECD (2018), Skills in Ibero-America: Insights from PISA 2015, OECD, Paris, https://www.oecd.org/skills/piaac/Skills-in-Ibero-America-Insights-from-PISA-2015.pdf.
[2] OECD (2016), Skills Matter: Further Results from the Survey of Adult Skills, OECD Publishing, Paris, https://doi.org/10.1787/9789264258051-en.
[9] OECD (2012), “Does Money Buy Strong Performance in PISA?”, PISA in Focus, No. 13, OECD Publishing, Paris, https://doi.org/10.1787/5k9fhmfzc4xx-en.
[5] OECD (2012), Literacy, Numeracy and Problem Solving in Technology-Rich Environments: Framework for the OECD Survey of Adult Skills, OECD Publishing, Paris, https://doi.org/10.1787/9789264128859-en.
[4] PIAAC Expert Group in Problem Solving in Technology-Rich Environments (2009), “PIAAC Problem Solving in Technology-Rich Environments: A Conceptual Framework”, OECD Education Working Papers, No. 36, OECD Publishing, Paris, https://doi.org/10.1787/220262483674.
[1] World Bank (2019), World Bank Country and Lending Groups, World Bank, Washington, DC, https://datahelpdesk.worldbank.org/knowledgebase/articles/906519-world-bank-country-and-lending-groups.
Notes
← 1. Taxonomy adopted by the World Bank (2019[1])
low-income economies are defined as those with a gross national income (GNI) per capita of USD 995 or less in 2017
lower middle-income economies are those with a GNI per capita between USD 996 and USD 3 895
upper middle-income economies are those with a GNI per capita between USD 3 896 and USD 12 055
high-income economies are those with a GNI per capita of USD 12 056 or more.
← 2. Digital texts are texts that are stored as digital information and accessed in the form of screen-based displays on devices such as computers and smart phones. Digital texts have a range of features that distinguish them from print-based texts: in addition to being displayed on screens, they include hypertext links to other documents, specific navigation features (e.g. scroll bars, use of menus) and interactivity. The Survey of Adult Skills is the first international assessment of adult literacy to cover this dimension of reading.