This section provides summary data on adult learning activity in Slovenia, and suggests potential roles for each ministry and sector in implementing the recommended actions in this report.
Skills Strategy Implementation Guidance for Slovenia
Improving the Governance of Adult Learning
OECD Skills Studies

Annex B. Adult learning activity data
Further data on adult learning activity in Slovenia
According to the Adult Education Survey (AES) (2016), participation in adult learning in Slovenia is slightly above the European Union (EU) average, and predominately in non-formal education and training (Figure A B.1, Panel A). As in other EU countries, the majority of adult education and training in Slovenia is non-formal, job-related training sponsored by employers. However, this share is below the EU average (Figure A B.1, Panel B).
Figure A B.1. Participation rates and distribution of adult education and training, 2016
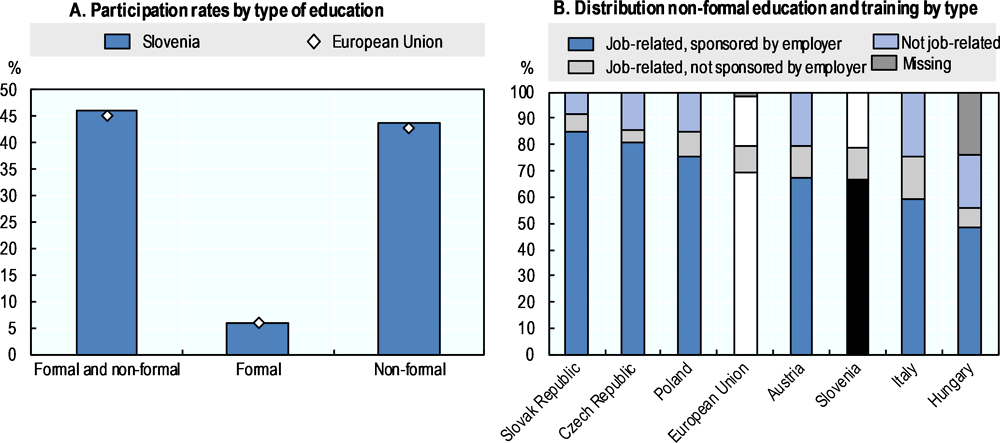
Source: Eurostat (2018[4]), Participation rate in education and training by sex [trng_aes_100], Distribution of non-formal education and training activities by type and sex [trng_aes_188], Adult Education Survey 2016, https://ec.europa.eu/eurostat/data/database (accessed on 31 October 2018).
According to the Continuing Vocational Training (CVT) Survey (2015), a relatively high share of enterprises and employees are engaged in continuous vocational training in Slovenia (Figure A B.2, Panel A). These shares have increased over the last decade. Participation in CVT is relatively high in Slovenia across all sizes of enterprises (Figure A B.2, Panel B), and in most sectors (Figure A B.2, Panel C). Slovenian enterprises mainly utilise external CVT courses, but a relatively high share of Slovenian enterprises also provide internal courses, external courses and other forms of CVT (guided-on-the-job training; job rotation, exchanges or secondments; learning/quality circles; self-directed learning; and training at conferences, workshops, trade fairs and lectures) (Figure A B.2, Panel D).
Figure A B.2. Characteristics of Continuing Vocational Training (CVT) in Slovenia, 2015
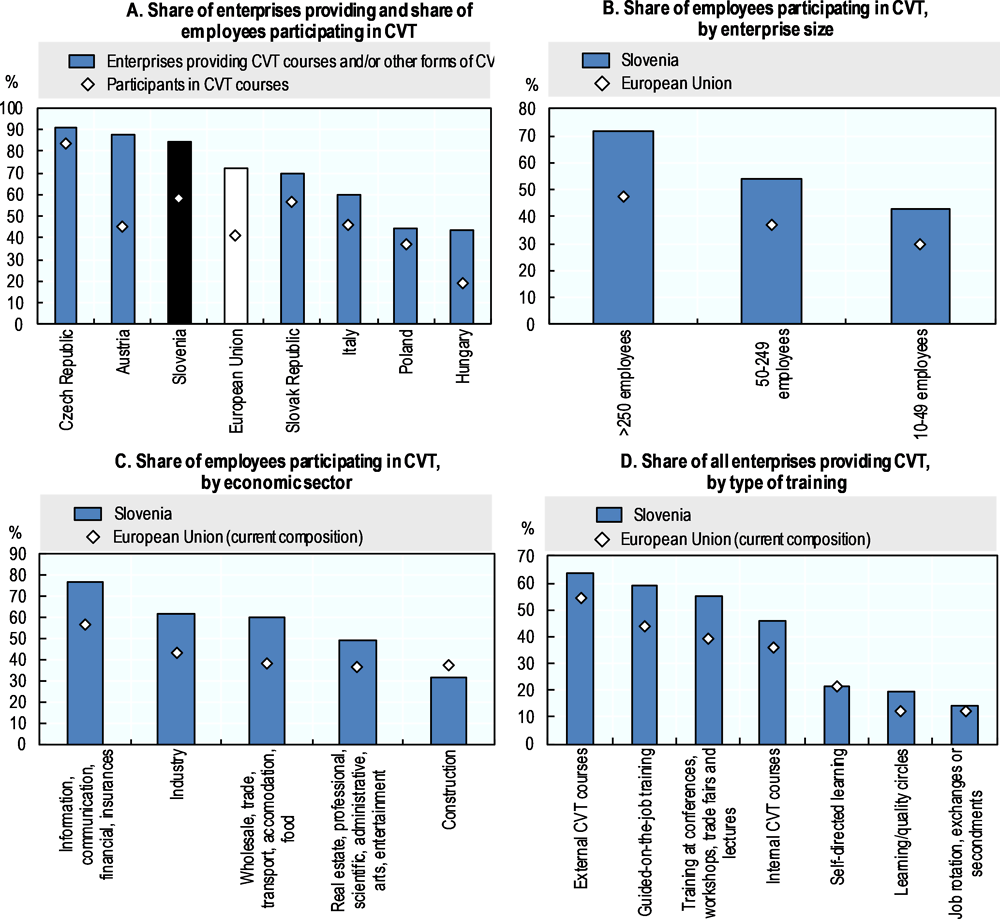
Source: Eurostat (2018[5]), Enterprises providing training by type of training and size class - % of all enterprises [trng_cvt_01s], Participants in CVT courses by sex and size class - % of persons employed in all enterprises [trng_cvt_12s], Participants in CVT courses by sex and NACE Rev. 2 activity - % of persons employed in all enterprises [trng_cvt_12n2], Continuing Vocational Training Survey, https://ec.europa.eu/eurostat/data/database (accessed on 31 October 2018).
According to national data, a wide range and large number of providers deliver education and training to adults. In 2014/2015, there were 517 known providers of non-formal programmes, and they delivered education and training to about 430 000 participants (Table A B.1).
Table A B.1. Non-formal adult education providers and participants in Slovenia (2014/2015)
Note: - no occurrence of event.
Source: Taštanoska (ed.) (2017[6]), The EDUCATION SYSTEM in the Republic of Slovenia 2016/2017, https://ec.europa.eu/epale/en/resource-centre/content/education-system-republic-slovenia-20162017.
In 2014/2015, over 13 000 adults were enrolled in, and over 2000 adults completed formal upper secondary education programmes in Slovenia (Table A B.2). About 95% of adult enrolments in secondary school are in technical or vocational programmes (rather than general programmes), compared to only 64% for youth (Taštanoska, 2017[6]).
Table A B.2. Formal adult education providers and participants in Slovenia (2014/2015)
Number of adult enrolments and completions in upper secondary programmes, by provider
Note: - no occurrence of event.
Source: Taštanoska (ed.) (2017[6]), The EDUCATION SYSTEM in the Republic of Slovenia 2016/2017, https://ec.europa.eu/epale/en/resource-centre/content/education-system-republic-slovenia-20162017.
Upper secondary graduates must pass a national exam (matura) if they wish to continue to tertiary education. There is a general matura for academic higher education and a vocational matura for professional higher education. In 2017, 1 800 adults sat the vocational matura and the pass rate was high (89%). However, 650 adults sat the general matura and the pass rate was low (43%).