This chapter describes the structure and performance of SME and entrepreneurship activity in Ireland. It presents information on numbers of enterprises, employment and value added by enterprise size class. It examines key business demography indicators such as the business entry, exit and churn rate, as well as the proportions of high-growth firms in the business population. It presents evidence on the productivity of SMEs, the level of SME internationalisation and rates of R&D and innovation in SMEs in Ireland, as well as on entrepreneurial attitudes and the rate of early-stage entrepreneurial activity in the Irish population. It also examines spatial disparities in SME and entrepreneurship rates across Ireland. It shows that SMEs make a large contribution to employment. As well as many strengths, such as strong overall SME innovation performance, the Chapter highlights some priorities for policy development related to lagging SME productivity performance, low business entry-exit dynamism, and an under-representation of Irish SMEs in international markets. Lastly, the Chapter comments, where appropriate, on current challenges related to existing data gaps and measurement issues specific to Ireland.
SME and Entrepreneurship Policy in Ireland

Chapter 2. SME and entrepreneurship characteristics and performance in Ireland
Abstract
The structure of the Irish business economy
Enterprises by size class
Data from the Central Statistics Office in Ireland indicate that there were around 250 000 active enterprises in Ireland in 2016, of which close to 92% had less than 10 employees (micro), 6.8% had between 10-49 employees (small), 1.2% had 50-249 employees (medium), and 0.2% had 250 or more employees (large).
Table 2.1. Active enterprises in Ireland, 2012-16
Absolute number and share, by firm size
Note: NACE Code 64.20 activities of holding companies are excluded. An active enterprise is defined as an enterprise that had either turnover or employment at any time during the reference period.
Ireland uses the EU definition, which defines the category of micro, small and medium-sized enterprises (SMEs) as enterprises that employ fewer than 250 persons and that have an annual turnover not exceeding EUR 50 million, and/or an annual balance sheet total not exceeding EUR 43 million, whereby micro enterprises have less than 10 employees and have an annual turnover not exceeding EUR 2 million, small enterprises have between 10-49 employees and an annual turnover not exceeding EUR 10 million, and medium enterprises have between 50 and 249 employees, and an annual turnover not exceeding EUR 50 million.
Source: Central Statistics Office Ireland, Business Demography Database.
Over the 2012-16 period, the number of active enterprises in Ireland increased by 2.3%, corresponding to nearly 5 700 additional firms in the economy, compared to an OECD median of 6.2% for this period. The overall proportion of micro-enterprises declined marginally, while the number of small enterprises grew on average by 4.2% and medium and large enterprises displayed an annual average growth of 5.1%. This potentially suggests some degree of consolidation within the Irish SME population, with a small decline in the share of micro enterprises. The service sector grew in importance over the last decade and accounted for over half (51.1%) of all enterprises, while the construction sector’s importance declined over the same period, accounting for over a fifth of all active enterprises (20.6%) in 2016, representing nonetheless the highest share among EU countries.
In around half of OECD economies, especially those hit hard by the crisis, the number of enterprises in 2015 remained below levels in 2008. The construction sector was especially affected, and to a lesser extent manufacturing, while services fared much better in most OECD economies. In most OECD countries and across all sectors, the number of SMEs typically grew faster than the number of large enterprises (OECD, 2017). Ireland bucks both these trends. First, in 2015 there were close to 6 000 more active enterprises Ireland than in 2008. Second, as shown in Figure 2.1 below, the number of large enterprises expanded more than the number of SMEs across all sectors. Irish SMEs in the construction sector were hit particularly hard, with their number shrinking almost continuously over the reference period. In addition, the number of Irish SMEs active in the service sector recovered less well compared to large firms, with the growth rate for the latter more than five times as high than those of small businesses.
Figure 2.1. Average annual change in number of enterprises, 2011-16

Note: NACE Code 64.20 activities of holding companies are excluded.
Source: Central Statistics Office Ireland, Business Demography Database.
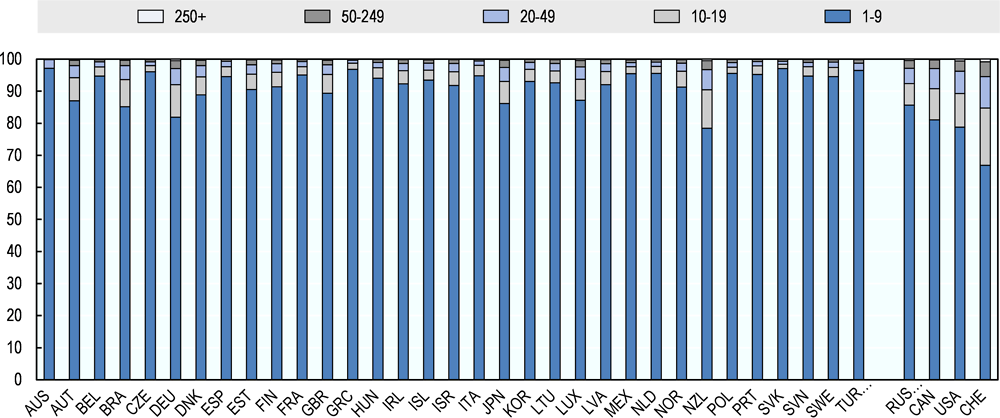
The OECD’s Structural and Demographic Business Statistics (SDBS) database, which collects firm-level data from national business registers, offers comparable information on SME numbers for 36 countries (33 OECD countries plus Brazil, Romania and the Russian Federation) for 2014. Based on this source, Figure 2.2 below shows that the SME share in the total enterprise population was above 99% in Ireland in that period, in line with most other OECD economies.
Micro-enterprises (employing less than 10 people) represented around 92.4% of all Irish businesses, slightly above the OECD average of 90%, and more than in other small open economies, such as Austria, Denmark and New Zealand. Ireland’s proportion of medium-sized firms (50-249 employees) was a little above 1% of total enterprises; lower than the OECD average of 1.5%, and more than four times smaller than the share in Switzerland (4.41% of total enterprises), for example. This possibly reflects limited opportunities for Irish micro-enterprises to grow.
Figure 2.2. Enterprises by size, business economy
Note: Detailed notes available at http://dx.doi.org/10.1787/888933563075
Source: OECD SDBS database.
Employment by enterprise size class
Data from the Central Statistics Office (CSO) Ireland indicate that SMEs accounted for 68.4% of total employment in 2016, compared with almost 70% in 2011. Within the SME segment, the total number of people employed increased across all firm size bands over the 2011-16 period. However, in 2016, the relative employment weight of micro-enterprises in the economy was almost 3% lower compared to 2011, whereas that of firms in the small size segment inched up by 0.3%. Medium-sized enterprises displayed a higher increase in their total employment share than large businesses (1.36% vs. 1.16%) (Table 2.2). These developments thus document a shift in employment shares, with an overall decline in the employment weight of micro firms, while larger share increases are observed in the case of medium and large firms.
Table 2.2. Employment and employment weight in the Irish business sector
Absolute numbers and percentage values
Note: NACE Code 64.20 activities of holding companies are excluded.
Source: Central Statistics Office Ireland, Business Demography Database.
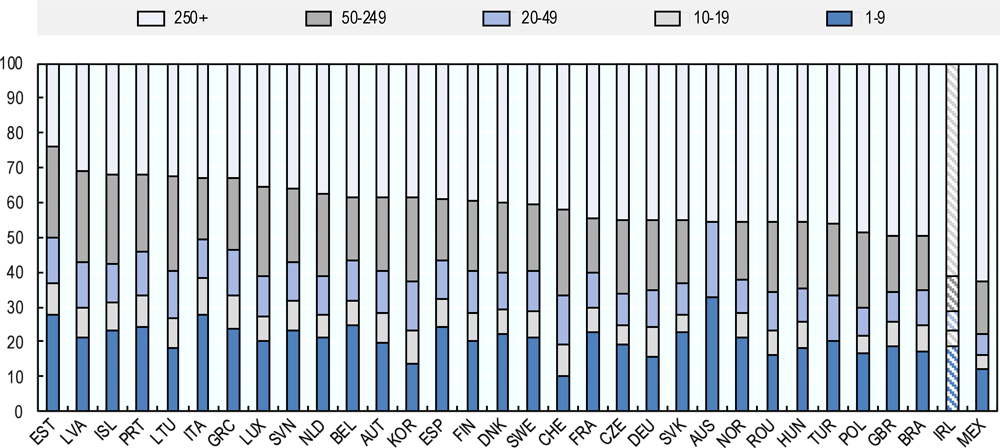
On average, across OECD countries SMEs account for around 60% of total manufacturing employment and for around 75% in services(OECD, 2017a). The employment share in Irish SMEs for the manufacturing (56%) and services sector (74%) is thus roughly in line with the OECD average. More specifically, the SME share of employment in Ireland is highest not only in a range of services sectors like construction, accommodation and food or real estate services but also in a number of manufacturing industries, like manufacturing of basic metals and metal products or manufacturing of rubber and plastic. At the same time, a strong concentration of large firms can be observed in capital-intensive and globalised activities such manufacturing of computers or pharmaceuticals, for which the share of large firms is high relative to the OECD average.
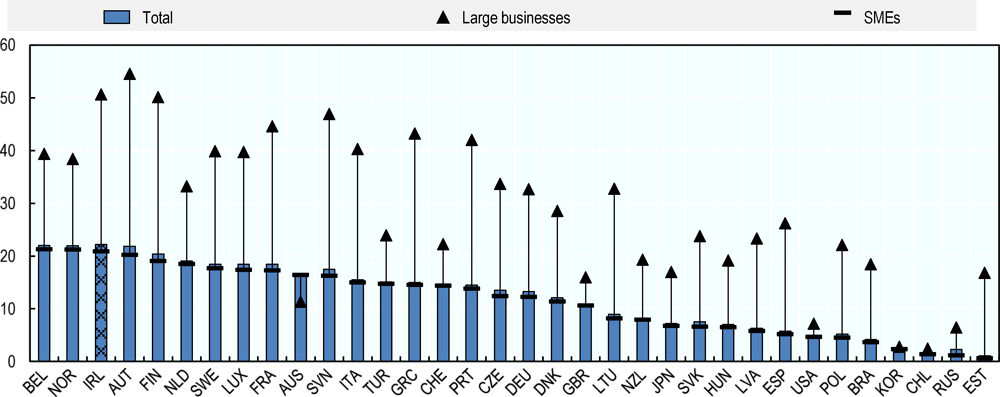
In the construction sector, Irish SMEs account for a much higher share of employment compared to most other OECD countries (Figure 2.3). According to Ireland’s CSO, the construction sector had the largest share of persons employed in SMEs in 2016, at 94.5%. In particular, Ireland displays a high share of micro-enterprises active in this sector: in 2014, 66% of Irish construction businesses were micro firms, compared to an OECD average of 40%. Only Australia, Italy and Greece had a higher share of micro enterprises in this sector.
Figure 2.3. Employment by enterprise size, construction sector
Note: For detailed notes on differences in definitions and methodology, please refer to http://dx.doi.org/10.1787/888933563227
Source: OECD SDBS database and Japanese 2014 Economic Census.
Value added by enterprise size class
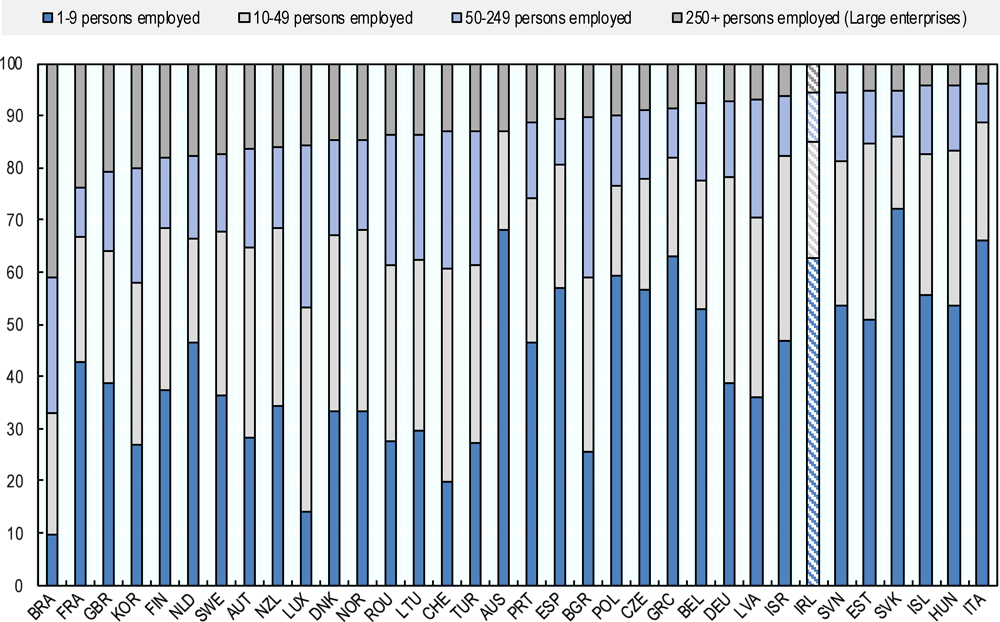
Data on value added broken down by enterprise size provide important insights into structural factors that drive growth, employment and entrepreneurial value, but also shed light on slowing productivity diffusion and productivity-wage decoupling. In most countries, large enterprises account for a considerable share of the value added of the business economy, despite constituting less than 1% of businesses (OECD, 2017a).
In 2016, SMEs in Ireland had the second lowest share in total value added among OECD countries (under 40%), reflecting the structure of the Irish business population, which is dominated by a large number of highly productive foreign multinationals. The share of SME value added is thus significantly below the OECD average of 59%, especially for small and medium-sized firms, whose share in value added was in fact the lowest among OECD countries in 2016, while the contribution of Irish micro firms at 18.6% was more or less in line with the OECD average of 20.6%.
Figure 2.4. Value added by enterprise size, business economy
Note: Size classes are based on the number of persons employed. Data refer to value added at factor costs in European countries and value added at basic prices for other countries.
Source: OECD SDBS database.
Although there is a wide gap between SME and large firm productivity in Ireland, the absolute level of labour productivity in Irish SMEs is high, as show in Figure 2.5. Some caution is nonetheless required in interpreting the data because of differences between countries in the sector, size and ownership structures of SMEs.
Figure 2.5. Labour productivity of SMEs

Note: Size classes are based on the number of persons employed. Labour productivity is measured as value added per person employed. Data for the Czech Republic are excluded.
Source: OECD SDBS database.
According to the CSO in Ireland, in the construction sector, almost 91% of all gross value added (GVA) was generated in small and medium enterprises in 2015, compared to an OECD average of 80%, while SMEs in the services sectors accounted for 61% of GVA, compared to an OECD average of 68%.
Between 2008 and 2014, the relative shares of SMEs and large firms in total value added in manufacturing remained stable in virtually all countries, with the exception of Ireland. While in 2008, Irish manufacturing SMEs accounted for 42% of all business value added, that share had dropped to 28% in 2014, even though the number of small firms active in this sector over this period remained broadly stable(OECD, 2017a). This could suggest either a slowing of productivity among Irish manufacturing SMEs over the past decade, or a widening productivity gap between small and large manufacturing firms. The latter could reflect changes in patterns of reporting of value added by foreign-owned companies operating in Ireland.
Business demography
Business demography indicators, i.e. business entry (birth) and exit (death) rates, are key indicators of business dynamism. Ireland's start-up data are incomplete and Ireland’s Central Statistics Office (CSO) has only recently begun publishing employer firm data, even though the latter is important in terms of the economic potential of such firms compared to non-employer firms (Hennigan, 2016a).
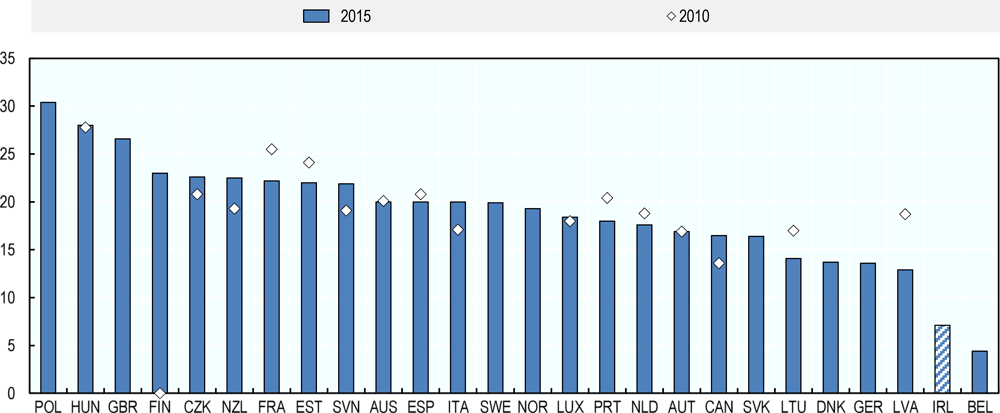
After a period of decline in the aftermath of the global financial crisis, the number of firm creations has been recovering since 2013-2014, reaching (or even surpassing) pre-crisis levels in many countries(OECD, 2017b). Ireland has not followed this general trend: While the total start-up rate stood at 10.4% in 2007, it had dropped to 7.3% in 2015, and even to 4.1% with regard to employer enterprises(OECD, 2017a). In addition, as shown in Figure 2.6, both the employer enterprise birth rate and death rates, are much lower in Ireland compared to most other OECD countries. In 2015, Ireland's birth rate was around 3% lower than the OECD average of 10% and half that of the UK rate at 14%.
Figure 2.6. Enterprise birth and death rates
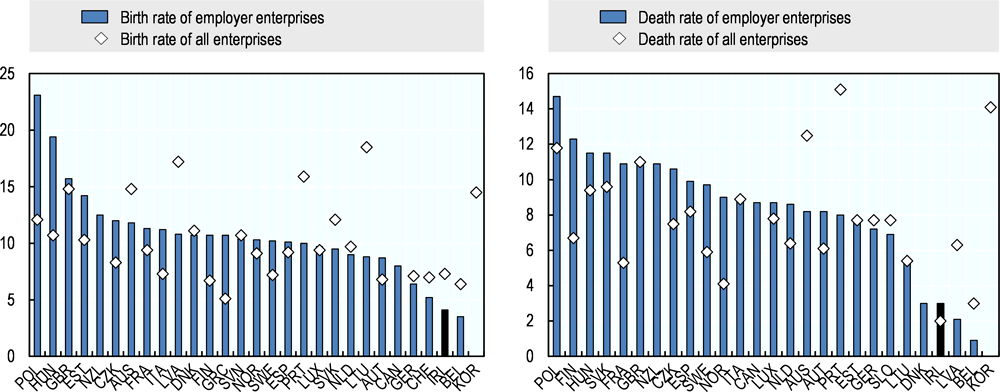
Note: An employer enterprise birth/ death refers is the birth/ death of an enterprise with at least one employee. A non-employer enterprise birth/ death refers to the birth/ death of an enterprise with no employees. Employer-enterprise births/ deaths do not include entries/ exits from the population due to mergers, take-overs, break-ups and restructuring of a set of enterprises. They also exclude entries/ exits from a sub-population resulting only from a change of activity.
Source: OECD SDBS database.
As a consequence, Ireland had also one of the lowest employer enterprise churn rates1 among OECD countries in 2015, a commonly used proxy for entrepreneurial dynamics (Figure 2.7). The low enterprise churn rate is likely to adversely affect productivity growth, given a more limited resource reallocation from less productive firms to young SMEs.
Figure 2.7. Employer enterprise churn rate, total economy
Note: The sum of the employer enterprise birth and death rate.
Source: OECD SDBS database.
A comparison of churn rates across sectors additionally reveals that in 2015, these were consistently higher in the United Kingdom than in Ireland (Figure 2.8).
Figure 2.8. Employer enterprise churn rates in Ireland and the United Kingdom, 2015
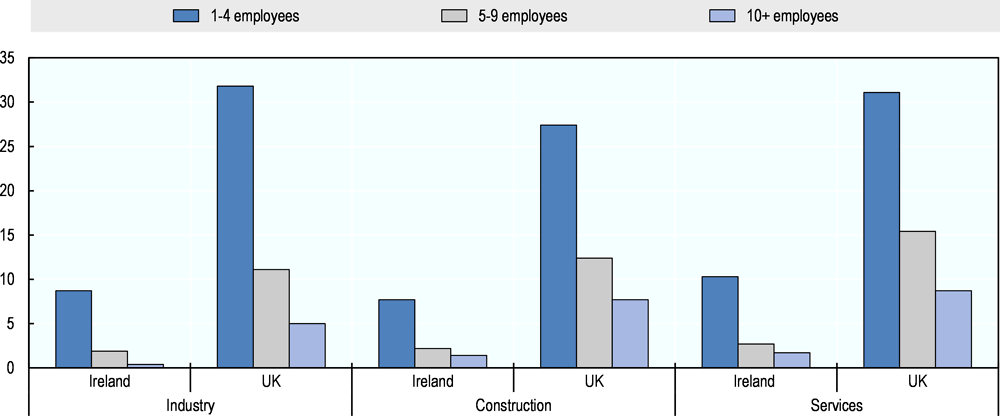
Note: Sum of the employer enterprise birth rate and death rate in each sector.
Source: OECD SDBS database.
Start-ups and young firms are often a source of radical and disruptive innovations. In addition, they are considered important drivers of growth due to their disproportionate contribution to aggregate job creation and the productivity-enhancing effect associated with a higher pace of firm entry and exit(OECD, 2017a). While most new employer enterprises in OECD economies are created with between one and four employees, the average number of persons employed in employer enterprise births is typically higher in industry than in services, reflecting economies of scale.
As a consequence of its low business dynamism, Ireland is also an outlier in this regard, with the second lowest share of start-ups in the business economy, as well as the second lowest share of employment in start-ups in 2015. This suggests that the contribution of start-ups to growth and employment remains potentially untapped (Figure 2.9). In fact, overall employment change in Ireland tends to be driven by rates of job creation by incumbent firms.
In addition, much of the recent job creation in start-ups has taken place in below average productivity sectors, including accommodation and food services (30%), trade (16%) and construction (10%), although professional, scientific and technical activities together with ICT services also account for a substantial share (22%) of overall job creation by newly born enterprises.
Figure 2.9. Share of start-ups and their employment, business economy
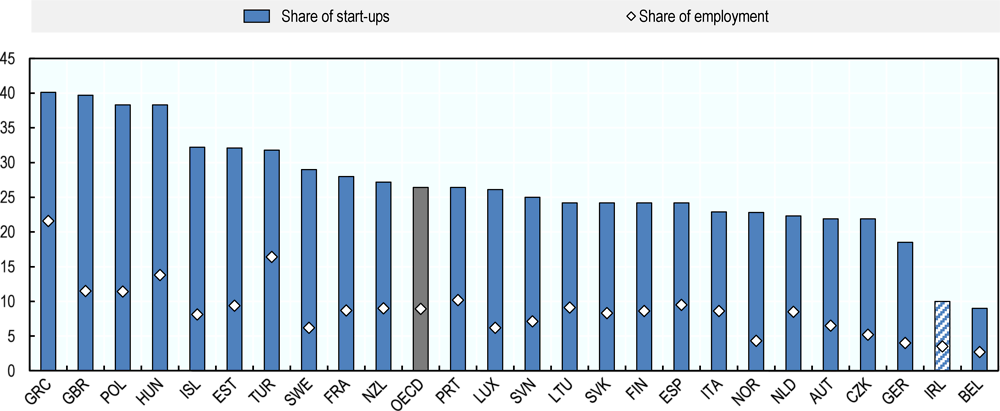
Note: Employer start-ups include all employer enterprises that are up to two years old, i.e. the newly-born enterprises plus those that are one and two years old.
Source: OECD Structural and Demographic Business Statistics (SDBS) (database).
Aside from the analysis of birth rates, post-entry performance is an important indicator of firms’ ability to remain and successfully compete in the market. Many newly-created enterprises fail within the first few years of life, although there are important differences across countries(OECD, 2017a). The one-year survival rate2 of employer enterprises born in 2013 was above 90% in Lithuania, Luxembourg, Sweden, the United Kingdom and the United States, but between 60% and 70% in the Czech Republic and Poland, and below 55% in the Slovak Republic. In Ireland, the one-year survival rate decreased slightly from 87.3% in 2010 to 85.3% in 2014 (Central Statistics Office Ireland, 2018).
In the majority of countries surveyed by the OECD, the survival rate is equal to just above 60% after 3 years from entry; it falls to about 50% after 5 years, and to just over 40% after seven years. Furthermore, it appears as a striking regularity across many countries that the probability of exiting is highest when businesses are two years old, and decreases (linearly) beyond that age(OECD, 2017a). In Ireland, there were 13 954 new enterprise created in 2010, with 9 331 of these still active in reference year 2015, a 66.9% survival rate, thus higher than the OECD average of 50%. This higher survival share may to some extent reflect policy choices of previous government administrations that sought to reduce firm failure rates in the country.
Figure 2.10. Surviving enterprises by birth year in Ireland, 2010-14

Source: Central Statistics Office Ireland, Business Demography Database.
Survival rates are typically higher in industry than in services or construction, and for enterprises born with five employees or more. OECD data shows that, in 2015, Ireland’s 3-year survival rate for SMEs operating in the services sector was 64%, thus almost 10 percentage points above the OECD average of 55% for that sector. This further corroborates the observation that a larger share of Irish businesses manage to remain in the market, including in sectors that are typically characterised by higher rates of business dynamism.
High-growth enterprises and gazelles
High-growth firms (HGFs)3, i.e. enterprises that grow rapidly over a short period of time, are a major source of job creation. They also favour the entrepreneurial process of creative destruction and often generate knowledge spill-overs, which other firms can harness. The OECD finds that although high-growth firms represented only between 3.2% and 6.4% of the total stock of enterprises in several countries over the 2002-05 period, they accounted for between 40% and 64% of all new jobs, depending on the country (Bravo-Biosca et al., 2013).
Data on HGFs in Ireland is sparse. A study of agency-supported firms, carried out by Forfás4 in 2011, observed that, based on the metric of employment, agency-supported HGFs in Ireland accounted for 4.5% of active agency-supported firms, and contributed 33% of the new jobs created by agency-supported firms over the 2008-11 period. This performance by agency-supported firms in Ireland is in line with international norms (Forfás, 2014).
While the CSO has not published data directly in relation to HGFs, it does provide HGF figures to Eurostat, whose available data shows that while in many countries the share of these firms stagnated or declined in recent years, their share in Ireland grew continuously over the 2012-15 period. In addition, Eurostat reported in October 2016 that Ireland's overall HGFs rate was 12.3%, at the same level as Sweden's, compared to almost 10% in the EU 28 (Eurostat, 2016).
The highest ratio of HGFs in the EU was found in the “Information and communication” sector (15% of active enterprises), followed by “Administrative and support service activities” (12.7%), “Transportation and storage” and "Professional, scientific and technical activities" (both 11%). Among EU countries, Ireland had the second highest share of HGFs in the Information and communication sector at 19.9%; surpassed only by Malta at 22.3% and followed by the United Kingdom (18.6%); Sweden (18.2%) and the Netherlands (17.6%).
In addition, as shown in Figure 2.11, overall, the average number of employees in Irish HGFs was slightly above the OECD average (77.9 vs. 74.2 employees), but well below the United Kingdom, which employed an average of 130 people in HGFs, and where the gap by sector is also quite pronounced, particularly with regard to construction.
Figure 2.11. Average employment in high-growth enterprises
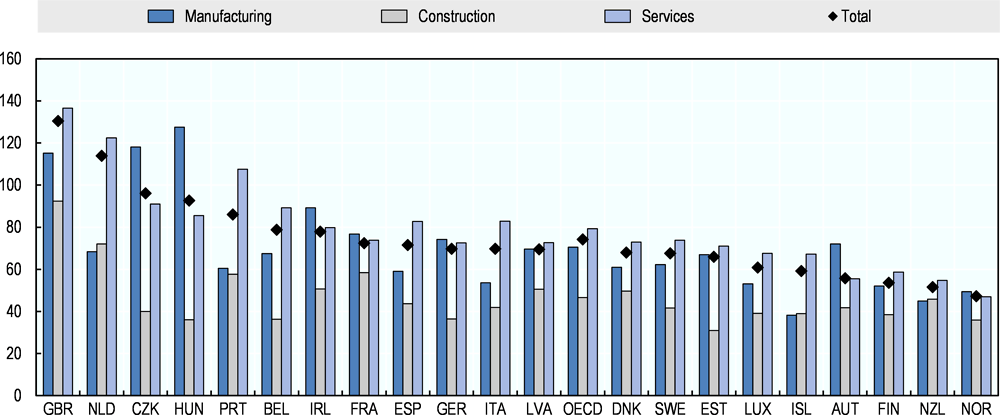
Note: Data refer to enterprises with 10 employees or more.
Source: OECD SDBS database.
The productivity, innovation and internationalisation performance of Irish small business
Data and measurement issues
Globalisation presents significant challenges in terms of measuring economic activity at national level. While this is the case in most advanced economies, the issues are particularly acute in the Irish context, given the large multinational footprint. Notably, there are increased challenges related to interpreting the real-time information embedded in standard, internationally recognised metrics such as Gross Domestic Product (GDP) and Gross National Income (GNI), which in turn impact measurements of productivity, innovation and exports, among other things. Movements in these aggregates have become increasingly disconnected from actual trends in living standards in Ireland, as illustrated most recently by the GDP growth figures reported in 2015, which stood at 26% (Department of Finance, 2018a).
This surge arose in fact largely as a consequence of internal restructuring by Irish-resident multinationals, and more specifically their underlying intellectual property, alongside an increase in the amount of contract manufacturing carried out outside of Ireland (Beesley, 2017). Under current statistical rules, however, such sales (production) generated from the use of intellectual property are marked down as a boost to Ireland’s exports and are then reflected in the country’s national accounts, even though the actual economic activity takes place elsewhere. Given the size of these companies, the boost to GDP growth has been correspondingly large.
Such developments have led policy-makers to develop a new measure of economic activity to strip out the impact of globalisation on the Irish economy. Since 2017, data on Ireland’s “modified gross national income”5 is published annually alongside traditional quarterly data. In spite of a few shortcomings, the modified GNI aggregate is considered a better approximation of the size of the Irish economy and an important indicator for fiscal purposes, especially for ratio, where it can provide significant added value. In fact, by this measure, Ireland’s economy is about one-third smaller than official GDP figures suggest (Beesley, 2017).
As a result, indicators presented in the following sections, which are all based on internationally standardised statistical concepts, should be interpreted carefully and with the above in mind, in particular with regard to comparisons of performance between SMEs and large firms.
Productivity of Irish SMEs
Overall, a large share of Irish firms experienced stagnating or declining productivity over the period 2006-2014, especially in the services sector (Department of Finance, 2018b). Aggregate productivity growth has relied on the performance of a group of very large successful firms and is thus consistent with a rising dispersion in productivity levels between Ireland’s foreign-owned and locally-owned firms in most industries. This disparity has also tended to translate into wage gaps, stoking Ireland’s very high level of market income inequality and a pronounced difficulty for SMEs to access skilled labour at competitive cost. The resilience of the Irish economy, especially in light of the uncertainties surrounding Brexit, will thus hinge on unblocking the productivity potential of these indigenous businesses (OECD, 2018a).
Nonetheless, a somewhat more mixed picture emerges when looking beneath aggregate trends. As shown in Figure 2.12, trends in value added among micro firms active in the services sector actually kept pace with those of large firms over the past decade, while growth declined (or remained flat) among small and medium firms, resulting in a widening gap vis-à-vis large and micro businesses. In the manufacturing sector, on the other hand, productivity of all segments of the SME population was stagnant over 2005-16, while that of large businesses increased strongly during that period. This suggests a productivity growth problem with established small and medium-sized indigenous firms. Even though these only represent a minority of the overall enterprise population (around 8% in 2016), they account for a large chunk of employment and value added, and may thus drag down aggregate productivity as a consequence.
Figure 2.12. Productivity trends in Ireland

Note: Value added at factor cost refers to the gross income from operating activities after adjusting for operating subsidies and indirect taxes.
Source: OECD SDBS database.
It has been noted above that there are difficulties in examining the productivity gap between SMEs and large firms in Ireland due to reporting of value added by multinationals. Figure 2.13 therefore concentrates on labour productivity within the SME segment across OECD countries. Using the labour productivity performance of mid-sized firms as an index, the data show that medium firms in Ireland were not necessarily more productive than smaller firms. In the manufacturing sector, small firms (10-19 employees) actually outperformed by far all other size segments. In addition, in the services sector, Irish micro-firms significantly outperformed all other size categories, while small firms were on par with their mid-sized counterparts. Only Denmark, Norway and Sweden showed a similar performance structure in the services sector, while in most other countries the productivity gap between micro and medium-sized firms was much more pronounced.
Figure 2.13. Labour productivity by firm size, manufacturing and business services
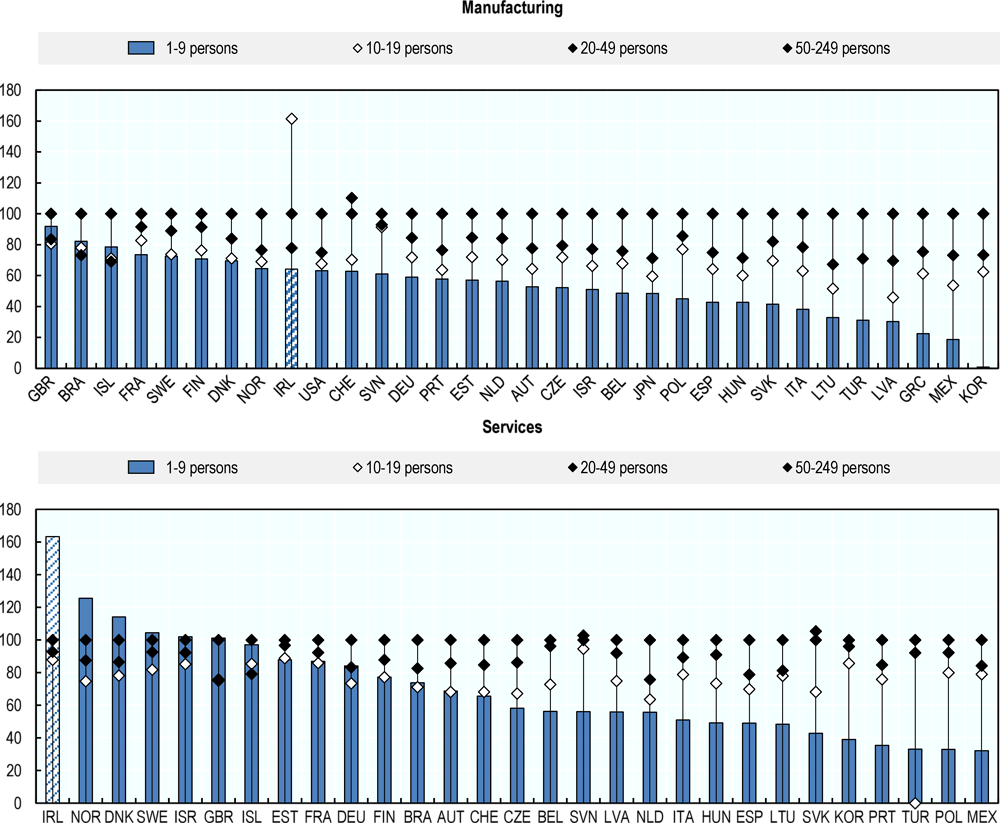
Note: Labour productivity by enterprise size class is measured as gross value added in current prices per person employed. Labour input is measured as total employment, which includes employees and all other paid or unpaid persons who worked for the concerned unit during the reference year.
Source: OECD Structural and Demographic Business Statistics (database), February 2018.
Chapter 7 of this report analyses in greater detail SME productivity issues in Ireland, exploring in particular the policy levers available to upgrade SME productivity, mainly with regard to resource reallocation and absorptive capacity.
Internationalisation of Irish SMEs
According to CSO data, there werea total of 8 545 exporting enterprises6 in 2016. Even though there were only 263 large exporting enterprises (3% of all exporting enterprises), they accounted for 67% (EUR 79.5 billion) of all Irish exports in 2016. By contrast, there were 7 900 SMEs exporting goods in 2016, which corresponds to around 3% of the total SME population. The total value of SME exports amounted to EUR 36.4 billion in 2016, or 31% of total exports, compared to an OECD average of around 40%. This included 5 007 micro enterprises, which exported EUR 6.9 billion of goods. Micro enterprises accounted for 60% of exporters and 6% of the value of goods exported (Table 2.3).7
Table 2.3. Exporting enterprises in Ireland
By firm size, 2016
Source: Central Statistics Office Ireland, Trade by Enterprise Characteristics Database.
As shown in Figure 2.14, more than one third (37%) of Ireland’s total export volume is accounted for by the ten largest exporters and more than two-thirds (69%) by the fifty largest exporters. Among OECD countries, only Luxembourg has more concentrated direct export activity than Ireland.
Figure 2.14. Concentration of exports by exporting enterprises, total economy
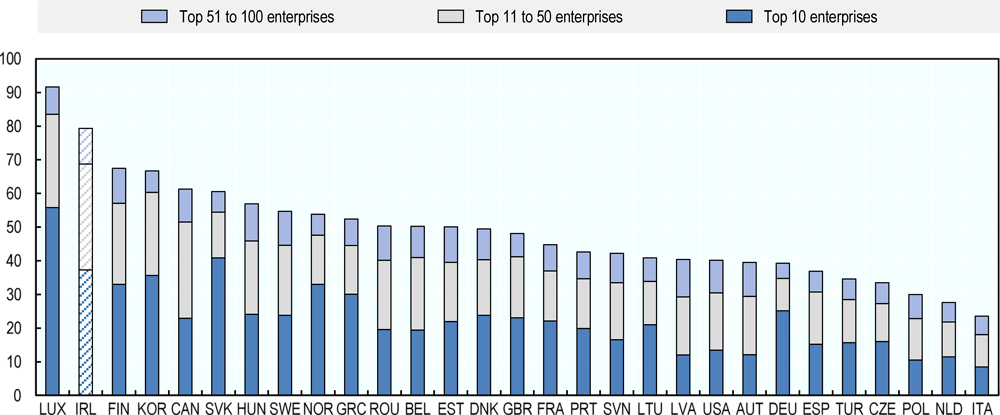
Note: The concentration of exports by exporting enterprises is calculated as the ratio of the value of exports by each rank (top 10, top 11 to 50, and top 51 to 100 exporting enterprises) divided by the total value of exports.
Source: OECD TEC database.
The Eurozone is the top market for Irish exports, accounting for almost a third of adjusted headline exports (goods and services) in 2016, compared to 17% for both the United Kingdom and the United States. Separate data from Enterprise Ireland (EI) for indigenous exports by agency-assisted firms indicates sales of EUR 4.8 billion to the euro area in 2018. In addition, recent analysis undertaken by InterTradeIreland (ITI) shows that Irish SMEs are likely to take their first step into exporting across the border with Northern Ireland, whose cross-border market is particularly vital for small firms. Almost a sixth of the exports of small firms in Ireland go to Northern Ireland. This near-neighbour exporting may provide a bridge to expanding export activities to other countries (InterTradeIreland, 2013).
Available evidence suggests that Ireland has one of the lowest ratios of exporters to total enterprises, employer enterprises, and population in the EU, although the CSO does not distinguish in its export data between employer and non-employer enterprises. In a recently published research paper, an estimate for joint-stock companies was therefore added, which provides a proxy for the total number of employer enterprises of 95 000. On that basis, the Irish firm exporting ratio relative to employer firms was 6.3%, with only 1.5% of Irish-owned services firms engaged in export activities. On the same basis, the ratio for countries of a similar size such as Denmark or Finland was much higher, as shown in Table 2.4 (Lawless, Siedschlag and Studnicka, 2017). Only Greece had a similarly low ratio of 6.6%.
Table 2.4. Export propensity
Absolute numbers and as a percentage of total number of employer enterprises
Source: Own elaboration, based on Lawless, Siedschlag and Studnicka, 2017; Hennigan, 2017 and OECD/ Eurostat databases.
The OECD’s Inter Country Input-Output (ICIO) database sheds light on the extent to which a country is integrated into the global economy by looking at the share of jobs embodied in foreign final demand. As shown in Figure 2.15, Ireland’s economy had one of the highest shares of jobs that were sustained by foreign final demand in 2014, namely 64.5% compared to an OECD average of 38.1%, and topped only by Luxembourg. For example, in most European countries between 30% and 60% of jobs in the business sector were sustained by consumers in foreign markets in 2014, while in Japan and the United States, shares were lower, at 15.8% and 10.6%, respectively, reflecting their relatively large size and lower dependency on exports/imports (OECD, 2017c).
Figure 2.15. Jobs in the business sector sustained by foreign final demand
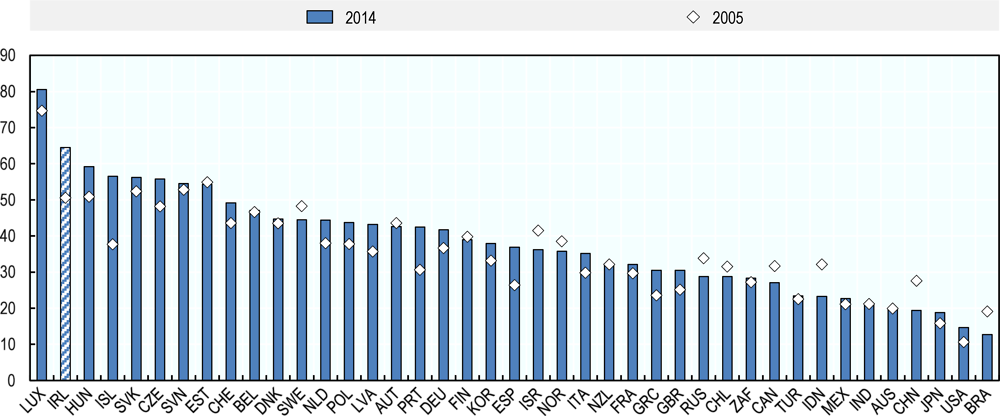
Note: The business sector corresponds to ISIC Rev.3 Divisions 10 to 74, i.e. total economy excluding Agriculture, forestry and fishing (Divisions 01-05), Public administration (75), Education (80), Health (85) and Other community, social and personal services (90-95).
Source: Source: OECD calculations based on Inter-Country Input-Output (ICIO) Database, Annual National Accounts Database, Structural Analysis (STAN) Database, Trade in Employment (TiM); World Input-Output Database (WIOD) and national sources, June 2017.
However, the contribution of Irish SMEs to domestic value in exports is very limited, as shown in Figure 2.16. Almost 50% of domestic value added in exports is produced by large firms, one of the highest shares among OECD countries, with only Mexico, Brazil and Poland displaying higher shares in this regard.
Figure 2.16. Domestic value added in exports

Source: OECD/Eurostat Trade by Enterprise Characteristics (TEC) database, OECD Structural and Demographic Business Statistics (SDBS) database, OECD-WTO TiVA database.
R&D and innovation in Irish SMEs
Data from the OECD’s Main Science and Technology Indicators Database shows that gross domestic expenditure on R&D (GERD) in Ireland stood at 1.16% of GDP in 2016, thus below the OECD average of 2.34% and equally below the EU 28 of 1.94%. Business expenditure on R&D (BERD) was 0.94% of GDP in 2017. This compares with an OECD average of 1.67% and an EU-28 average of 1.30%.
In 2015, expenditure on experimental development (0.73% of GDP), which builds upon research to produce new or improved products or processes, was also below the OECD average of 0.9% of GDP (Figure 2.17). This type of R&D is usually conducted within firms and often associated with productivity gains.
In 2017, 68% of BERD was financed by the business sector (compared with an OECD average of 87%), 4.6% from government sources and 0.1% from other national sources and 27.3% from the rest of the world. BERD accounted for 72% of GERD in Ireland in 2016 (compared to an OECD average of 69.9%).
Figure 2.17. Gross domestic expenditure on R&D, 2015
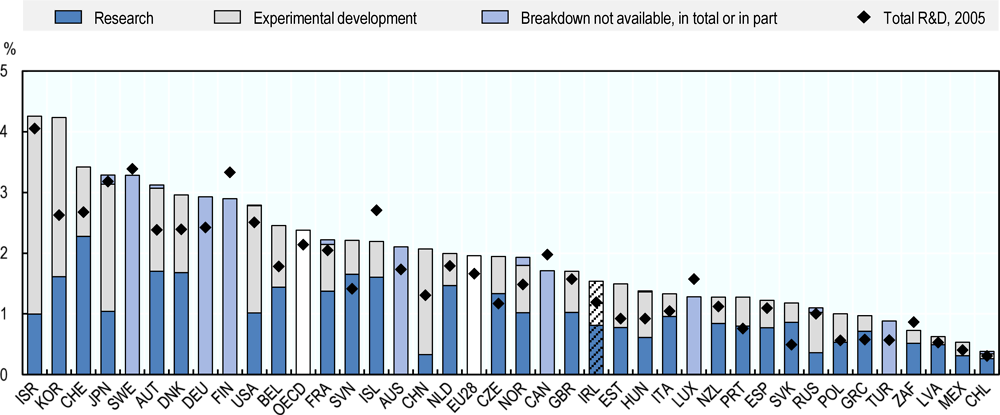
Note: Gross domestic spending on R&D is defined as the total expenditure (current and capital) on R&D carried out by all resident companies, research institutes, university and government laboratories, etc., in a country. It includes R&D funded from abroad, but excludes domestic funds for R&D performed outside the domestic economy. Detailed notes are available here: http://dx.doi.org/10.1787/888933618365 .
Source: OECD, Main Science and Technology Indicators Database.
In spite of the below average overall spending on R&D, the SME share of business R&D (BERD) in Ireland stood at almost 40% in 2015, which was above the OECD average of 35%.8 On the other hand, Irish SMEs perform less well in terms of securing government funds to carry out R&D, likely because of lower application levels to available support measures among these firms. As a result, in 2015, only around 40% of government-funded BERD went to Irish SMEs – a share much lower than in countries like Belgium or New Zealand (70% and above), and also well below the OECD average of 56% (Figure 2.18). This suggests that government-funded BERD has remained skewed toward large enterprises, in spite of an increasing availability of SME-targeted instruments in this area.
Figure 2.18. SME share in business R&D and government-funded business R&D

Note: Government-funded business R&D is the component of R&D performed by business enterprises that they attribute to direct government funding. It includes grants and payments for R&D contracts for procurement, but not R&D tax incentives, repayable loans or equity investments. For Ireland, data covers enterprises with 10-249 employees. Microenterprises are excluded.
Source: OECD, Research and Development Statistics Database.
While research activity in the indigenous business sector is small, there is some indication that it has been growing in recent years. A particular emphasis in Irish research, development and innovation (RD&I) policy in recent years has been on technology transfer between publicly funded research performing organisations and SMEs. Irish SMEs are performing very well in securing funding under the Horizon 2020 SME Instrument, with a 8.6% success rate in applications under the instrument – the highest in the EU28 and nearly double the EU average of 4.6%.9
In addition, Ireland fares well in terms of new-to-market product innovation, which refers to the introduction of a new or significantly improved product into the firm’s market before any other competitors (although the product may have already been available in other markets), and is in fact frequently uncoupled from R&D activities. Still, in many countries, differences tend to be very marked between large businesses and SMEs in this area (OECD, 2017c). In this regard, Irish SMEs actually outperform most other OECD economies, displaying the third-highest share of new-to-market production innovation (Figure 2.19). This picture is confirmed by a recent large-scale survey exercise on Irish micro-enterprises, which indicates that 40% of micro-enterprises (with between one and ten employees) introduced a new or improved product or service in the three years prior to the survey. This compares favourably with micro-enterprises in the United Kingdom and the United States (Bourke and Roper, 2019).
Figure 2.19. New-to-market product innovators, by size, 2012-14
Note: International comparability may be limited due to differences in innovation survey methodologies and country-specific response patterns. European countries follow harmonised survey guidelines with the Community Innovation Survey.
Source: OECD STI Scoreboard 2017, based on the 2017 OECD survey of national innovation statistics and the Eurostat, Community Innovation Survey (CIS-2014).
A report commissioned by the Irish Government in 2015 found that, overall, Irish R&D activity was largely carried out by foreign multinationals concentrated in a number of high technology sectors, and there has only been a limited spill-over to SMEs. In addition, the report shows that patenting in Ireland was low, with a small number of firms responsible for the majority of patent applications. Only 0.2% of firms in Ireland accounted for 77% of applications between 1999- 2013 (Wain et al., 2015).
As in many OECD countries, Irish small firms (10-49 employees) are also only approximately one-third as likely as large firms to be using Enterprise Resource Planning (ERP), a software platform that integrates core business processes in real-time (OECD, 2018b. This may pose additional hurdles to innovation, since companies which develop and use their internal strategic resources effectively (e.g. managerial and workforce skills, ICT, R&D, etc.), and collaborate with external partners in the innovation system, tend to display better innovation performance.
At the same time, Irish SMEs fare relatively well in terms of using different innovation types (Figure 2.20). In particular, Ireland has a relatively high share of SMEs that engage in mixed modes of innovation (33.9% vs. an OECD average of 26.1%), i.e. a combination of technological and non-technological innovation (e.g. related to product or process and marketing or organisational innovation), that usually requires a larger knowledge endowment, without necessarily implying direct engagement in R&D activities.
Figure 2.20. Innovation types, by business size, 2016

Note: International comparability may be limited due to differences in innovation survey methodologies and country-specific response patterns. European countries follow harmonised survey guidelines with the Community Innovation Survey.
Source: OECD, based on the 2017 OECD survey of national innovation statistics and the Eurostat, Community Innovation Survey (CIS-2014), http://oe.cd/inno-stats, June 2017. More data and information is available here: http://dx.doi.org/10.1787/888933619353.
Entrepreneurship performance in Ireland
Entrepreneurial attitudes
According to the most recent Global Entrepreneurship Monitor (GEM) report on Ireland, popular culture in the country is very supportive of entrepreneurship. Ireland ranks highest in Europe in terms of popular regard for successful entrepreneurs and also above the OECD average (Fitzsimons and O’Gorman, 2018). On the other hand, in Ireland, only a little more than half (53%) of people perceive entrepreneurship as a good career choice, which is lower than most other European countries (an average rate of 59%), with Ireland ranking 16th out of 20 countries, as well as below the OECD average. It should also be noted that during the years of the Celtic Tiger10, this rate was much higher, at 66% in 2003. It then declined significantly during the recession years and has begun to recover with economic growth picking up again, without returning to the rates observed prior to the recession, though. In Ireland, around one in every seven people aspire to start a business in the next three years. Aspirations are higher among younger people, with nearly 17% of those aged 18-24 aspiring to start a business in the near future.
According to the most recent GEM report, less than half of the adult population (45%) in Ireland see entrepreneurial opportunities in their local area, a share that doubled over 2007-12. While this is in line with the OECD average, some countries have much higher rates, for example Sweden (79%), Poland (69%) and the Netherlands (64%). Of those in Ireland that perceive opportunities, less than half (42%) believe they have the skills and knowledge required to start a business. This is below the OECD average and particularly lower than in countries like the United States, Canada and Australia, where 50% or more believe they have the required skills and knowledge to start a business. Fear of failure would prevent 39% Irish people from starting a business, which is also in line with the OECD average, but slightly below the European average of 43%. Fear of failure in Ireland increased over 2010-13, and has remained stable at this higher level since, in spite of the overall good performance of the Irish economy.
Figure 2.21. Entrepreneurial attitudes in Ireland, 2017
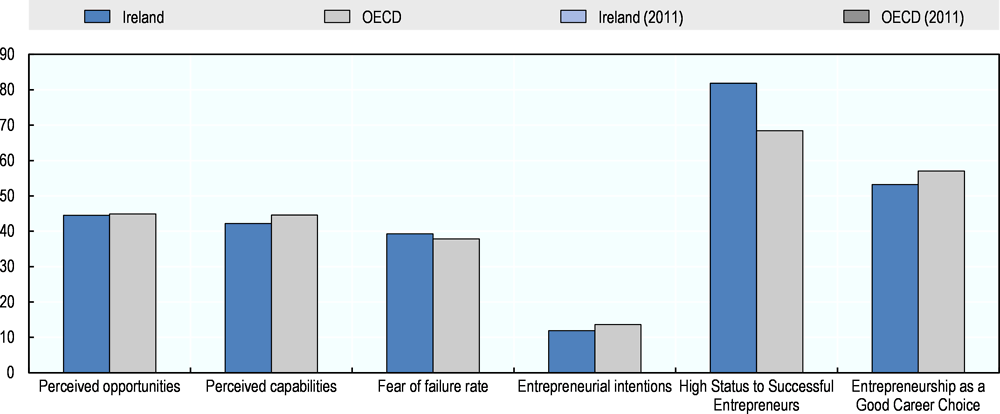
Note: Detailed definitions for the indicators can be found at the end of the Chapter.1
1. The exact definition for each indicator is as follows: i) Perceived opportunities: Percentage of the total adult population (18-64) who see good opportunities to start a firm in the area where they live; ii) Perceived capabilities: Percentage of the total adult population (18-64) who believe to have the required skills and knowledge to start a business iii) Fear of failure: Percentage of 18-64 population with positive perceived opportunities who indicate that fear of failure would prevent them from setting up a business. iv) Entrepreneurial intention: Percentage of the total adult population (18-64) (individuals involved in any stage of entrepreneurial activity excluded) who intend to start a business within three years; v) Social status of entrepreneurship: Percentage of the total adult population (18-64) who agree with the statement that in their country, successful entrepreneurs receive high status; vi) Desirability of entrepreneurship: Percentage of the total adult population (18-64) who agree with the statement that in their country, most people consider starting a business as a desirable career choice.
Source: OECD based on data supplied by the Global Entrepreneurship Monitor (GEM) research consortium.
The perception of Entrepreneurship as a good career was somewhat erratic over the past years, but has remained mostly above 50% (Figure 2.22).
Figure 2.22. Evolution of entrepreneurial attitudes in Ireland
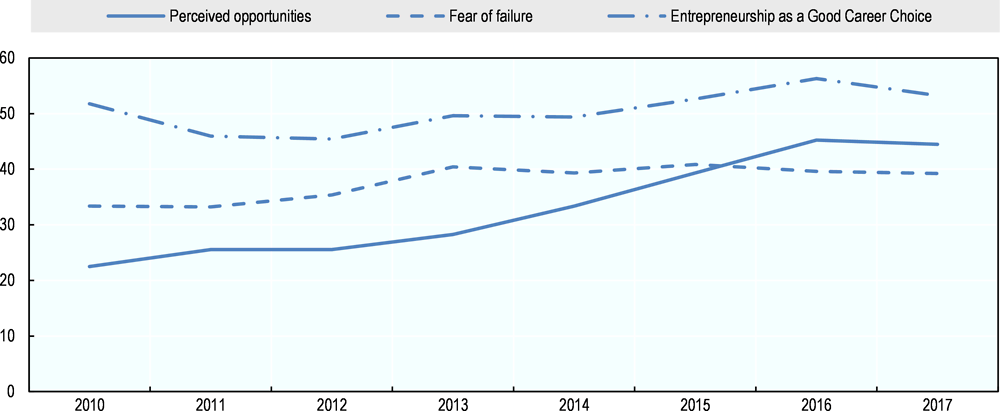
Note: Percentage of 18-64 year-old population (individuals involved in any stage of entrepreneurial activity excluded), who are latent entrepreneurs, including those who intend to start a business within three years.
Source: OECD calculations on data supplied by the Global Entrepreneurship Monitor (GEM) research consortium.
Early-stage entrepreneurial activity
Rates of entrepreneurship in Ireland, as measured by the Total Early Stage Entrepreneurial Activity (TEA) index, were below the OECD average of 10.4% in 2017, at 8.9%. This represents a drop, albeit small, compared to 2016, where eleven in every 100 people were active as a nascent entrepreneur or a new business owner. It should be noted, however, that the levels of entrepreneurship in Ireland have now surpassed the levels observed pre-recession.
The strongest primary motivation cited by nascent entrepreneurs and new business owners in Ireland is “to increase income”. In Ireland, one in every five entrepreneurs is motivated by a “desire to be independent”. In comparison, more entrepreneurs in Switzerland, one in every two entrepreneurs, and the United States, one in every three entrepreneurs, is motivated by a “desire to be independent”. In Ireland, nearly one in every four entrepreneurs cites “no better alternative” or “seeking to maintain income” as their primary motive for their entrepreneurship.
Figure 2.23. Early stage entrepreneurial activity
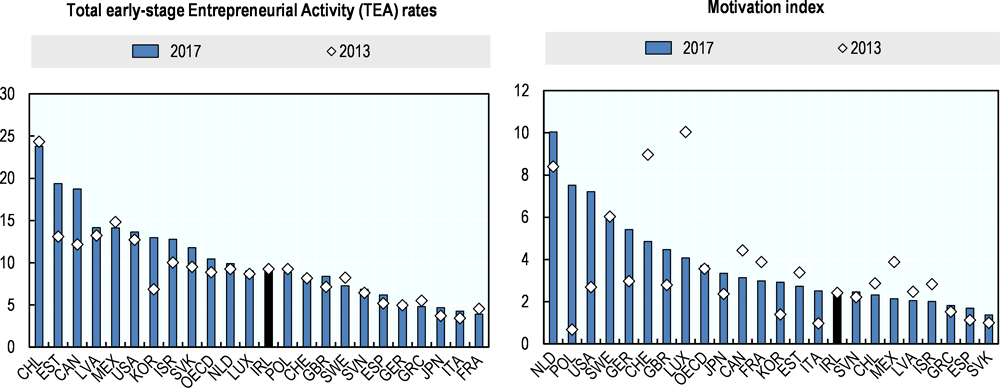
Note: Chart A; The Total Early Stage Entrepreneurial Activity (TEA) rate is the proportion of adults (18-64 years old) involved in setting up a business or who own and manage a business that is less than 42 months old. Chart B: Percentage of those involved in TEA that are improvement-driven opportunity motivated, divided by the percentage of TEA that is necessity-motivated.
Source: Global Entrepreneurship Monitor (GEM) research consortium.
Using a binary “Opportunity” versus “Necessity” categorisation, Irish entrepreneurs are predominately motivated by opportunity (83%), as compared to necessity (16%). Responding to a perceived opportunity was always the dominant reason for individuals in Ireland to become involved in entrepreneurship. At the time of the recent crisis, however, the number of those becoming an entrepreneur through necessity increased substantially. For example in 2010, this was the case for as many as three in every ten entrepreneurs. As the opportunity for alternative employment has picked up, the rate of those turning to entrepreneurship out of necessity has declined.
Social target groups
Although the self-employment rate in Ireland was approximately equal to the EU average in 2016 (14.6% vs. 14% for the EU), the self-employment rate for several social groups was below the EU average, including women (6.9% vs. 9.9% for the EU) and youth (1.9% vs. 4.2% for the EU) (OECD, 2017b).
More specifically, men were three times more likely than women to be self-employed (21.2% vs. 6.9% for women), which is a greater gap than in most other EU member states. This picture is corroborated by recent GEM and CSO data, which suggest that the gender gap in entrepreneurship is higher than the gap in labour force participation in Ireland, even though the gap is almost equal when considering full time employment (Table 2.5). In addition, men and women in Ireland differ most notably in terms of self-perceptions regarding the skills required to start and grow a business, with 53% of men considering they have the appropriate skill set versus 35% of women.
Table 2.5. Rates of labour force participation and entrepreneurship
As a percentage of adult population
Note: Unless indicated otherwise, the adult population is defined as aged 18-64. Working fulltime is defined as working 35+ hrs per week.
Source: CSO (2016) and GEM.
Furthermore, the Total early-stage Entrepreneurial Activities (TEA) rate was higher for men than women (11.3% vs. 5.6% for women), although the share of women who are entrepreneurs on this measure is higher than the EU-27 average, as shown in Figure 2.24 below.
Figure 2.24. Early stage entrepreneurial activity among target groups
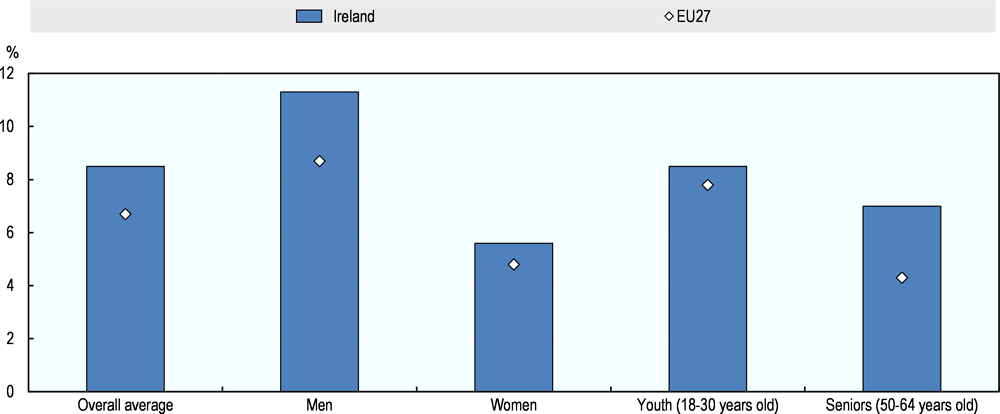
Note: The Total Early Stage Entrepreneurial Activity (TEA) rate is the proportion of adults (18-64 years old) involved in setting up a business or managing a business that is less than 42 months old.
Source: OECD (2017), The Missing Entrepreneurs, based on GEM (2017), Special tabulations of the Global Entrepreneurship Monitor adult population survey, 2012-16.
Relatively high rates of entrepreneurship in Ireland compared with the EU average are also evident among older age groups (24.6% vs. 18.5% for the EU). Indeed, Ireland ranks second in Europe in terms of senior entrepreneurship, i.e. those aged between 55 and 64 years, with one in every seven Irish entrepreneurs classified as a senior. This was not always the case. For example, in the 55 to 64 age group about one in every 20 people (4.8%) in 2010, compared to two in every 20 people (9.4%) in 2016, were entrepreneurs.
In contrast, Ireland ranks 9th in Europe in terms of youth entrepreneurship, i.e. those aged between 18 and 24 years, with only one in eleven entrepreneurs in Ireland being a youth entrepreneur (Fitzsimons and O’Gorman, 2018).
Women and older entrepreneurs were more likely to operate innovative businesses than the EU average (youth were not) and all social target groups were more likely to expect to create a significant number of jobs over the next five years than the EU average (OECD, 2017d).
Entrepreneurial activity among migrants is relatively low in Ireland (Figure 2.25). In 2015, the self-employment rate among foreign-born people stood at 12.1% in Ireland, compared to 15.9% of the domestically-born. In the majority of OECD countries the foreign-born entrepreneurship rate is higher than the domestic-born population, suggesting that the entrepreneurial potential of migrants could be better tapped. It should be noted, however, that GEM data paints a somewhat more positive picture in this respect, suggesting that in 2017, about one in five owner-managers of established businesses in Ireland were born outside of the country. In addition, GEM data also indicates that entrepreneurial intentions among migrants are higher compared to those born in Ireland (30% vs. 8% in 2017).
Figure 2.25. Self-employment rates for immigrants by country, 2015
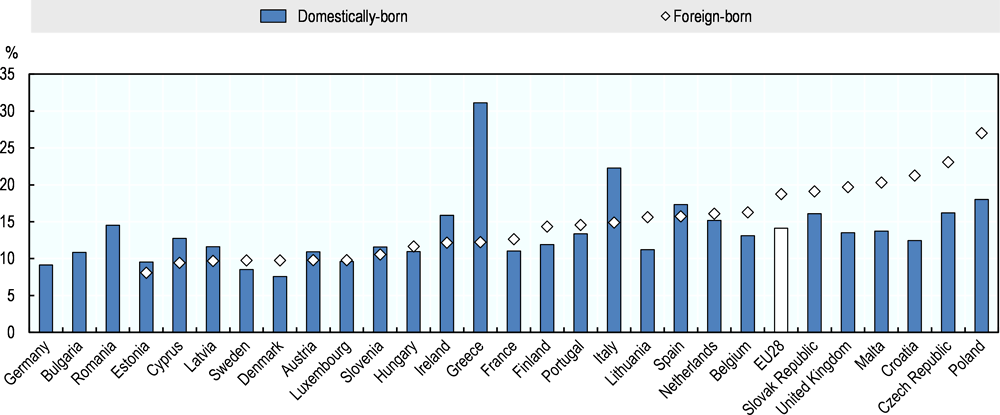
Note: 1. Data are not presented for Germany because the place of birth is not collected in the Labour Force Survey in Germany. Therefore a total for the European Union is not reported. 2. Some data are not available for Bulgaria, Malta, Ireland because the samples are too small to derive reliable estimates.
Source: OECD/European Union 2017
Rates of entrepreneurship in Ireland are also generally higher for those with more education. Seven in every ten entrepreneurs in Ireland have post-secondary education and the country has the 5th highest rate of entrepreneurship in Europe for people with graduate education (Fitzsimons and O’Gorman, 2018).
Geographical variations in SME and entrepreneurship activity
Spatial variations in the economic contribution of SMEs
The contribution of SMEs to the economy varies significantly across the Irish regions. In Ireland as a whole, almost 70 % of the persons engaged in active enterprises in the private business economy are in SMEs, i.e. private enterprises with less than 250 employees. This ranges, however, from 97 % in Midland region to 53 % in Dublin region.
Dublin and the South-West – the regions with largest employment shares in Ireland and also the regions with highest GVA per capita – have a significantly lower share of persons engaged in SMEs than the other regions. This can be explained by the presence of many foreign firms in services, manufacturing as well as banking and insurance. Furthermore, in many smaller regions small-scale agriculture and basic services activity constitute a larger fraction of the economy.
Table 2.6. Persons engaged in active enterprises by employment size, NUTS 3 regions
Share of regional total, 2016, as a percentage
Note: The data is an aggregation of data at the level of counties to the level of NUTS 3 regions. The geographical breakdown for enterprises is an approximation. The original county breakdown is based on the address at which an enterprise is registered for revenue purposes, rather than where the business actually operates. No comprehensive administrative data source is currently available for business locations. If an enterprise has local units in several counties, but one head office where all employment is registered, all its employees will be attributed to the county where the head office is located. For some size-classes in different counties, data has also been suppressed to protect the confidentiality of individual enterprise.
Source: CSO.
Spatial variations in new firm formation
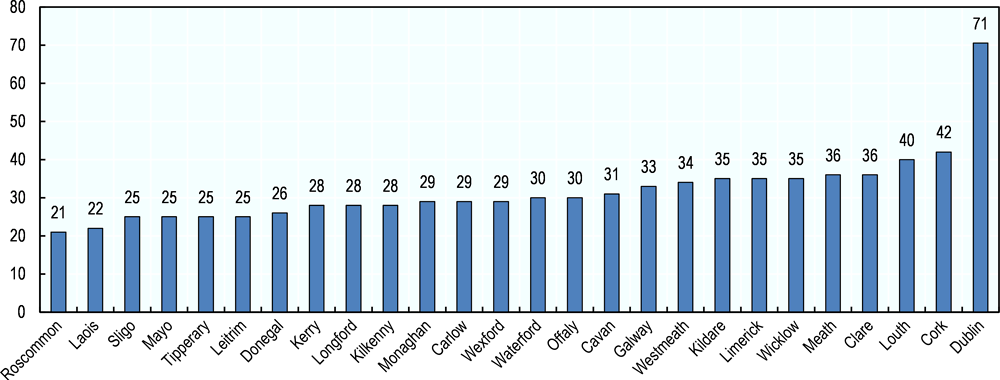
Available data on entrepreneurial activity at the regional level further illustrate the role of local variations and the special role of Dublin. Figure 2.26 presents the average rate of company formation per 10 000 inhabitants across counties in Ireland over the period 2015-17.11
Dublin has a rate of company formation in the order of 70 firms per 10 000 inhabitants. This is about 70% above the county with second highest rate of company formation, namely Cork. There are further large spatial variations in rates of company formation across the country excluding Dublin, with rates ranging from about 20 in Roscommon and Laois to around 40 in Louth and Cork. To some extent, the data on start-up rates produces a mirror image to the data on the economic importance of SMEs. Regions with the lowest dependence on SMEs, i.e. Dublin and Cork, have the highest rates of company formation.
A recent study by McCoy et al (2018) analyse the influence of a number of local characteristics on the location of new business establishments.12 They find that local characteristics matter and that broadband infrastructure, distance to a third-level education institution, level of educational attainment of the population and industry diversity are important factors influencing new firm formation.
Figure 2.26. New company formations per 10 000 population by county
Conclusions and policy recommendations
SMEs are central to the Irish economy, accounting for close to 70% of total employment and around 50% of value added. SMEs in Ireland are somewhat more likely to be micro-enterprises, which represent around 92.4% of all Irish businesses, slightly above the OECD average of 90%, and more than in other small open economies. In addition, while the employment share in Irish SMEs for the manufacturing and services sector is roughly in line with the OECD average, Irish construction SMEs account for a much higher share of employment compared to most other OECD countries.
Ireland displays one of the lowest business dynamism rates in the OECD area, but performs well in terms of its high-growth firm rate, which is above the EU average. In addition, Ireland had the second-highest share of HGFs active in the ICT sector in the EU. Almost 60% of Irish SMEs engage in innovation-related activities, which is high by international standards. On the other hand, Irish SMEs seem to perform much less well in terms of securing government funds to carry out R&D compared to their peers in other OECD countries.
Certain segments of the Irish SME population experience very low (in some cases negative) productivity growth – this does not concern large firms or high-growth enterprises, and not even micro-enterprises, but rather established small and medium sized firms, whose productivity share in the total enterprise population has remained below the OECD average as a result. In addition, Ireland’s SME export performance is very low by international standards, with only about 6% of Irish SMEs trading across borders and a high concentration of export activity among a small set of mainly large (multinational) firms. Large firms also account for almost 50% of domestic value added in Irish exports, one of the highest shares among OECD countries.
Entrepreneurial attitudes in Ireland are generally positive and above OECD and EU averages. In particular, the share of the adult population seeing good opportunities to start a firm in the area where they live almost doubled between 2010 and 2017, rising from 20% to almost 45%. This is somewhat at odds with Ireland’s very low business entry and exit rates. In addition, the entrepreneurial potential of certain social groups, in particular migrants, could be better tapped into.
There are also important regional differences in SME and entrepreneurship activity rates in Ireland. In particular, the new firm formation rate is higher in the more prosperous cities of Dublin and Cork, suggesting a need to spread positive conditions for entrepreneurship across the country. The spatial variations in entrepreneurship rates are linked to variations in the health of local entrepreneurship ecosystems across the country, particularly in terms of access to connectivity infrastructure and talent and skills, as well as differences in industrial diversity.
Overall, this Chapter points to important performance characteristics of the Irish SME base, which are taken up further in the following Chapters, although the analysis could be extended in the future with improved data on certain issues such as SME productivity performance. In particular, the Chapter points to the need to scale up the average size of Irish SMEs and micro firms, increase business start-up rates including among specific social groups such as migrants, increase productivity growth in established “small” and “medium” size category SMEs, increase SME exports and promote conditions for entrepreneurship success across the whole country. Subsequent chapters examine how to influence the business environment for SMEs and entrepreneurship and how to further develop government programmes targeted directly at SMEs and entrepreneurship in order to meet these challenges. Special attention is given to supporting entrepreneurship and SME productivity and export growth with local tailored initiatives, the range of measures that can be taken to increase SME productivity, and the role of business advice to SMEs as a lever for productivity and export development. The report also examines in more depth the strategic framework for the design and delivery of SME and entrepreneurship policy in Ireland.
Based on the analysis of the structure and performance of SMEs and entrepreneurship in Ireland, the following overall recommendations are advanced in terms of priority areas for policy development. Further information on how to address these priorities is provided in later chapters.
Key recommendations on SME and entrepreneurship structure and performance
Promote policy measures to:
Increase the productivity of “small” and “medium” size band SMEs.
Increase the business start-up rate and business dynamism.
Ensure equal opportunities for entrepreneurship across the population and address gaps in the self-employment and entrepreneurship activity rates of women, youth and migrants.
Scale up micro-enterprises, particularly indigenous locally-trading and non-exporting enterprises, and increase the cohort of medium-sized enterprises (50-259 employees).
Increase SME access to foreign markets, including non-United Kingdom markets.
Address spatial disparities in entrepreneurship by strengthening local entrepreneurship ecosystem conditions for start-up and scale-up entrepreneurship.
Address data gaps on SME and entrepreneurship performance, particularly on firms not assisted by government agencies, including on high growth firms, SME exports, SME productivity, and distinctions between employer and non-employer enterprises.
References
Beesley, A. (2017), Ireland’s outsized economic growth skewed by multinationals | Financial Times, Financial Times, https://www.ft.com/content/e3ae03c7-f2d1-304f-a4bf-1bb1cf16ce71 (accessed on 5 January 2019).
Bourke, J. and S. Roper (2019), Micro-Businesses in Ireland: From Ambition to Innovation., Cork: Cork University Business School, University College Cork.
Central Statistics Office Ireland (2018), Business Demography 2016, https://www.cso.ie/en/releasesandpublications/er/bd/businessdemography2016/ (accessed on 15 October 2018).
Department of Finance (2018a), GDP and ’modified GNI’- explanatory note, Economic Division, https://www.finance.gov.ie/wp-content/uploads/2018/05/180504-GDP-and-Modified-GNI-Explanatory-Note-May-2018.pdf (accessed on 5 January 2019).
Department of Finance (2018b), Patterns of Firm Level Productivity in Ireland, https://igees.gov.ie/wp-content/uploads/2018/04/Patterns-of-Firm-Level-Productivity-in-Ireland.pdf (accessed on 18 September 2018).
Eurostat (2016), Almost 1 in 10 enterprises in the EU recognised as high-growth companies, http://ec.europa.eu/eurostat/documents/2995521/7706167/4-26102016-AP-EN.pdf/20f0c515-ed43-45c3-ad6a-ca0b26b36de5 (accessed on 20 July 2018).
Fitzsimons, P. and C. O’Gorman (2018), Entrepreneurship in Ireland 2017, Global Entrepreneurship Monitor (GEM), https://www.enterprise-ireland.com/en/Publications/Reports-Published-Strategies/GEM-Reports/2017-Global-Entrepreneurship-Monitor-Report.pdf (accessed on 11 September 2018).
Forfás (2014), Innovation in Agency-Supported High Growth Firms in Ireland, https://dbei.gov.ie/en/Publications/Publication-files/Forf%C3%A1s/Innovation-in-Agency-Supported-High-Growth-Firms-in-Ireland.pdf (accessed on 20 July 2018).
InterTradeIreland (2013), Analysis of the key features of an exporting SME on the island of Ireland, https://intertradeireland.com/insights/publications/analysis-of-the-key-features-of-an-exporting-sme-on-the-island-of-ireland/ (accessed on 7 January 2019).
Lawless, M., I. Siedschlag and Z. Studnicka (2017), “Irish enterprise exporting patterns in goods and services: Evidence for policy”, Economic and Social Research Institute (ESRI) ESRI Research Bulletin 2017/2/4, https://www.esri.ie/pubs/RB20170204.pdf (accessed on 20 July 2018).
OECD (2018a), OECD Economic Surveys: Ireland 2018, OECD Publishing, Paris, http://dx.doi.org/10.1787/eco_surveys-irl-2018-en.
OECD (2018b), “Promoting innovation in established SMEs”, http://www.oecd.org/cfe/smes/ministerial/documents/2018-SME-Ministerial-Conference-Parallel-Session-4.pdf (accessed on 6 June 2018).
OECD (2017a), Entrepreneurship at a Glance 2017, OECD Publishing, Paris, http://dx.doi.org/10.1787/entrepreneur_aag-2017-en.
OECD (2017b), Entrepreneurship at a glance: 2017, https://doi.org/10.1787/entrepreneur_aag-2017-en.
OECD (2017c), OECD Science, Technology and Industry Scoreboard 2017: The digital transformation, OECD Publishing, Paris, http://dx.doi.org/10.1787/9789264268821-en.
OECD (2017d), The Missing Entrepreneurs 2017 : Policies for inclusive entrepreneurship.
Wain, M. et al. (2015), Enhancing the intellectual property activities in the firm base in Ireland, technopolis group, http://www.technopolis-group.com (accessed on 18 October 2018).
Notes
← 1. The churn rate is defined as the sum of birth and death rates of enterprises and thus provides a measure of how frequently new firms are created and existing enterprises close down.
← 2. Relates to enterprises born in one year and still active in the next year.
← 3. The OECD defines HGFs as firms that grow 20% or more per year, with growth being measured by the number of employees or by turnover, while Eurostat defines HGFs as firms with an annualised growth of 10% over 3 years.
← 4. Forfás was the national policy advisory board for enterprise, trade, science, technology and innovation in Ireland. The agency was established in January 1994 under the Industrial Development Act, 1993 and was run by a board appointed by the Minister for Jobs, Enterprise and Innovation, to whom the agency is responsible. Forfás was dissolved on 1 August 2014 and integrated with the Department of Jobs, Enterprise and Innovation.
← 5. In July 2017, the CSO published an alternative measure of the size of the economy, so-called ‘modified Gross National Income’ (sometimes called GNI*). This aggregate is equal to GNI but excludes retained earnings of firms that have re-domiciled to Ireland; the depreciation of foreign-owned intellectual property assets located in Ireland; and, the depreciation of aircraft owned by aircraft-leasing companies. Modified GNI is currently only available in nominal terms, i.e. the CSO has not yet adjusted the series for the effect of price developments. Moreover, the new metric is only available on an annual basis, as opposed to quarterly as is the case for both GDP and GNP. As a result, this aggregate is of limited use for the purpose of short-term conjunctural analysis (Department of Finance, 2018a).
← 6. Exporting enterprises in this case refer to firms with goods exports of over EUR 5 000 in the year.
← 7. GVC participation indicators have become a standard measure of countries’ insertion into regional and global value chains. They reflect the intermediate products imported from abroad that are embodied in a country’s exports (backward linkages), as well as the country’s exported intermediates that are incorporated into other countries’ exports (forward linkages) (Bohn et al., 2015). Both are measured as shares of gross exports. Higher backward linkages are generally observed in countries with larger shares of manufacturing in GDP. Larger domestic markets are associated with lower backward linkages – because of larger domestic capabilities for sourcing inputs – and larger forward linkages (OECD, 2013). Furthermore, recent studies show that stronger backward linkages are also positively related to diversification, productivity growth and positive structural change (Rieländer and Traoré, 2015; AfDB/OECD/UNDP/UNECA, 2013). Thus, a country’s upstream position in a value chain as a provider of primary inputs may offer different opportunities from a further downstream position that integrates inputs into final products.
← 8. The CSO statistics on R&D exclude companies with less than 10 employees. This may downplay to some extent the overall R&D expenditure by SMEs. To note is, for example, that Enterprise Ireland invests every year into around 100 high-potential start-ups, which are significant R&D active firms.
← 9. See Horizon 2020 dashboard: https://webgate.ec.europa.eu/dashboard/hub/.
← 10. "Celtic Tiger" is a term referring to the economy of the Republic of Ireland from the mid-1990s to the late-2000s, a period of rapid real economic growth fuelled by foreign direct investment. The boom was dampened by a subsequent property bubble which resulted in a severe economic downturn.
← 11. Dublin county is the same as Dublin NUTS 3 region.
← 12. Because of its special attractiveness for new firms, Dublin is excluded from their analysis.