This introductory chapter summarises the report’s findings on the economic case for greater LGBTI+ equality, drawing from a unique set of nationally representative microdata from the United States. The report first presents the latest data on the percentage of US adults identifying as LGBTI+, their geographic distribution and essential demographics. It reveals that 11.2% (or nearly 30 million) of US adults self-identified as LGBTI+ in 2023, a number that has nearly doubled in the past decade. In addition, self-identified LGBTI+ Americans differ on their geographic location and key demographic characteristics (sex assigned at birth, age, race/ethnicity, family structure, and educational attainment), compared to their cisgender straight peers. The report then focuses on evaluating equality for LGBTI+ Americans, underscoring persistent disparities faced by LGBTI+ Americans, especially in labour market outcomes, household income, and mental health. Finally, the report quantifies the substantial economic returns of levelling the playing field for LGBTI+ Americans.
The Economic Case for Greater LGBTI+ Equality in the United States
1. The economic case for greater LGBTI+ equality in the United States: An overview
Abstract
1.1. Introduction
Ensuring that LGBTI+ people can live as who they are without being discriminated against is a question of human rights, but it also makes a lot of economic sense. Yet, compelling evidence on the economic case for greater LGBTI+ equality is still scarce, primarily due to challenges in accurately measuring the size and life situation of the LGBTI+ population. These difficulties stem from two main reasons:
Firstly, sexual orientation and gender identity are considered very sensitive personal information which individuals are often reluctant to disclose, especially in surveys involving an interviewer, be it face‑to-face or over the phone, but also in self-administered online surveys whenever respondents’ names are collected (OECD, 2019[1]; Valfort, 2017[2]). In such cases, respondents feel that their responses are not truly anonymous (Robertson et al., 2018[3]).
Secondly, there are very few large‑scale nationally representative surveys that include questions on both sexual orientation and gender identity. As of 2023, only two OECD countries (Canada and the United Kingdom) have included a question on sexual orientation and/or gender identity in their population censuses (OECD, 2023[4]).
Against this backdrop, the United States has recently been active in bridging the data gap which has thus far hindered comprehensive estimates of the size of the LGBTI+ population and of their life situation. In particular, the launch of the Census Bureau’s Household Pulse Survey (HPS) in 2020 constituted a breakthrough. This is a large‑scale, online, fully anonymous, and probability-based survey initially designed to assess the social and economic impact of COVID‑19 on American households. Since 21 July 2021, the HPS has been collecting detailed information on sexual orientation, sex assigned at birth and gender identity, thereby offering the first extensive nationally representative sample of the LGBTI+ US adult population, defined as follows:
Cisgender non-heterosexual (LGB+) individuals, composed of those whose gender identity matches their sex assigned at birth and who self-identify as lesbians, gay men, bisexuals, or with another non-heterosexual identity, such as pansexual.
Non-cisgender individuals, composed of those whose gender identity does not match their sex assigned at birth. This includes transgender individuals (persons assigned female at birth but identifying as male, and vice versa), as well as other non-cisgender identities such as being non-binary (a person who was assigned either female or male at birth but whose gender identity refers to a combination of the two genders).1 While the majority of non-cisgender individuals self-identify as non-heterosexual, this population group also includes non-cisgender individuals who self-identify as heterosexual individuals.2
The analysis in this report relies on HPS data collected from 21 July 2021, to 10 July 2023. This dataset contains 1 648 098 respondents of which 155 447 self-identify as LGBTI+, an unprecedented sample size. In addition, to document trends over the past decade, the report also utilises data collected by the Gallup corporation from 2012 to 2022, as part of phone‑based surveys which included a question on whether respondents self-identified as LGBT or not. However, compared to the HPS data, the Gallup surveys have two main limitations. Firstly, the phone‑based format provides less anonymity compared to the online‑based format, confirming the recurring finding that estimates of the LGBTI+ population are higher in surveys where respondents, rather than interviewers, answer the question about LGBTI+ status (OECD, 2019[1]; Valfort, 2017[2]). Secondly, in most of the Gallup sample (from 2012 to 2017), respondents were classified in a dichotomous way (being LGBT or not), making it impossible to distinguish between different sexual orientations and gender identities. While the most recent Gallup sample (from 2020 to 2022) permits the identification of different LGBTI+ subgroups, the sample size is substantially smaller compared to the HPS sample. Overall, the size of the LGBTI+ sample surveyed from 2012 to 2022 is less than half that of the LGBTI+ sample surveyed by the HPS from 2021 to 2023.
Combining the HPS and Gallup surveys, this report provides a unique set of microdata that allows addressing three critical questions: i) Who are LGBTI+ Americans?; ii) Are LGBTI+ Americans discriminated against?; iii) Does LGBTI+ equality pay?. Meanwhile, this report introduces a novel analytical framework with potential for international application, detailing the data necessary for its deployment and laying the groundwork for subsequent studies on the economic returns of greater LGBTI+ inclusion.
1.2. Who are LGBTI+ Americans?
1.2.1. Americans who self-identify as LGBTI+ represent a sizeable and growing minority
According to the Household Pulse Survey (HPS), 11.2% of American adults self-identified as LGBTI+ in 2023 (Figure 1.1). This figure is equivalent to nearly 30 million American adults, which is larger than the population in New York or Florida. Specifically, nearly 9% of Americans self-identify as cisgender LGB+, the largest subgroup being cisgender bisexuals (4.5%), followed by cisgender gays/lesbians (2.9%) and then by other cisgender non-heterosexual identities (1.5%). Regarding non-cisgender individuals, only a little more than 2% of Americans self-identify as such, with 0.9% of US adults self-identifying as transgender and 1.4% as other non-cisgender identity (e.g. non-binary).
These estimates are close to those obtained for other OECD countries, based on the 2nd edition of the biennial LGBT+ Pride Global Survey that IPSOS conducted online between February and March 2023 (IPSOS, 2023[5]). According to this survey, the average share of LGBTI+ individuals in the 19 OECD countries surveyed is approximately 10%. If this percentage is extrapolated to the total population of OECD countries, it suggests a figure of nearly 140 million people, which is more than the population of Mexico.
Consistent with the well-documented shift towards greater acceptance of homosexuality, the share of individuals who self-identify as LGBTI+ is on the rise. This is true when one focuses on HPS data from 2021 to 2023, noting that this upward trend is even more striking when one focuses on the Gallup surveys, which reveal that the share of adults who self-identify as LGBT almost doubled between 2012 and 2022, rising from 3.5% to 6.9%.
The share of self-identified LGBTI+ adults varies substantially across US regions, states, and rural/urban areas. In 2023, according to HPS data, US adults were 24% more likely to identify as LGBTI+ in the West, compared to the South. Spatial disparities also prevail across US states, including within the same region. In the West, for instance, the share of self-identified LGBTI+ US adults varies by a factor of 1.8 across states, from 8.4% in Wyoming to 15.5% in Oregon. Self-reporting of LGBTI+ status also differs between rural and urban areas, with the share being almost twice as high in the latter than in the former.
Not surprisingly, these spatial disparities are positively correlated with geographic variations in social acceptance and legal protections of LGBTI+ individuals. For instance, in a state‑level analysis, an increase in the share of adults favouring LGBT non-discrimination protections by 10 percentage points is associated with an increase in LGBTI+ self-identification by 2.1 percentage points
This pattern reflects two main mechanisms. Firstly, LGBTI+ adults may be inclined to relocate to more accepting areas to escape discrimination and connect with a larger LGBTI+ community. Secondly, in more accepting areas, LGBTI+ individuals might feel more comfortable disclosing their sexual orientation and gender identity, causing a higher share of self-identified LGBTI+ individuals than in less accepting areas. While it is not possible to analyse which of the two mechanisms prevail using the HPS data, empirical evidence suggests that geographic relocation to avoid discrimination is a significant factor (Levine, 2022[6]; Medina and Mahowald, 2023[7]; Folch, 2022[8]; Goldberg, 2023[9]).
Figure 1.1. In 2023, 11.2% of US adults self-identified as LGBTI+
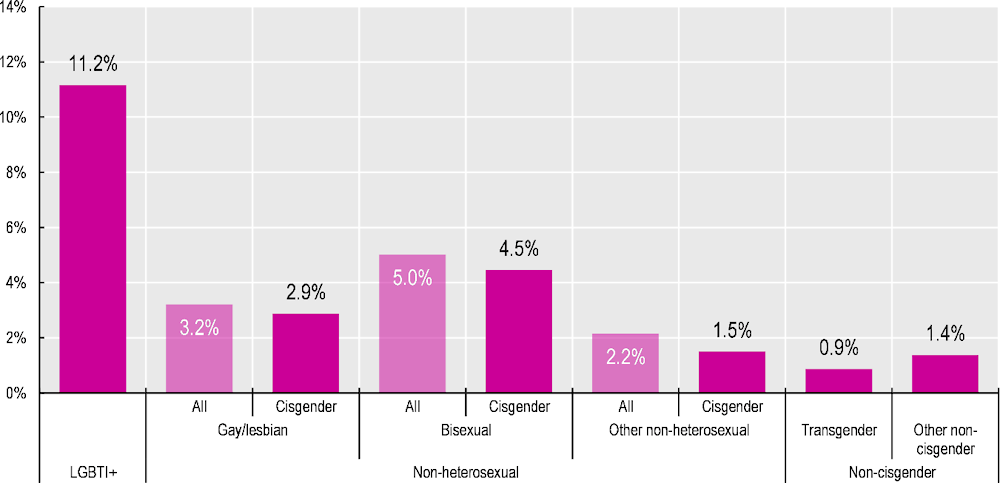
Note: LGBTI+ refers to respondents who self-identify as gay/lesbian, bisexual, transgender, other non-heterosexual, and other non-cisgender. Cisgender refers to individuals whose gender identity matches their sex assigned at birth. Person-level weights used.
Source: Household Pulse Survey (4 January 2023 – 10 July 2023).
1.2.2. Self-identified LGBTI+ Americans differ on key demographic characteristics compared to their cisgender straight peers
Factors such as sex assigned at birth, age, race/ethnicity, family structure, and educational attainment significantly influence economic and health outcomes, which, in turn, shape individual life trajectories. Exploring how LGBTI+ individuals compare with respect to these essential demographics yields five main takeaways.
1. Individuals assigned female at birth (AFAB) are more likely to identify as LGBTI+ than individuals assigned male at birth (AMAB) (Panel A of Figure 1.2), a gap that has kept widening during the past decade. This difference is primarily driven by AFAB individuals being more than twice as likely as their AMAB counterparts to identify as cisgender bisexual. Differences in LGBTI+ self-identification between AFAB and AMAB individuals likely reflect the well-documented greater social acceptance of women expressing same‑sex attraction or relationships compared to men, leading to potentially more AFABs feeling comfortable identifying as cisgender LGB+ (Herek, 2002[10]; Bettinsoli, Suppes and Napier, 2020[11]). Additionally, females exhibit more positive attitudes towards LGBTI+ individuals. As for the widening of this gap over time, it may reflect strides made in gender equality, hence a departure from traditional roles and expectations placed upon women, including the pressure to adhere to heteronormativity and to be feminine.
2. LGBTI+ self-identification decreases with age (Panel A of Figure 1.2) across all LGBTI+ subgroups. In 2023, nearly one in four young adults (18‑34) identified as LGBTI+, compared to nearly one in ten among prime age adults (35‑54) and one in 20 among mature adults (55+). Notably, the recent surge in LGBTI+ identification is driven by younger generations. Further analysis reveals that this pattern is not driven by an age effect, which would entail that, for younger generations, self-identifying as LGBTI+ is a fad that ceases once they grow older. Rather, the Gallup data suggest that this pattern is driven by a cohort effect: among those who were aged 18 to 34 in 2012, the percentage identifying as LGBT has grown in subsequent years rather than declined. This trend indicates that, raised in more accepting environments, young LGBTI+ adults feel more comfortable disclosing who they are, a process that should intensify in the future, provided that social acceptance of LGBTI+ individuals continues to rise.
3. LGBTI+ self-identification varies by race and ethnicity. First, relative to non-Hispanic Whites, a smaller share of non-Hispanic Blacks and non-Hispanic Asians identify as LGBTI+ (Panel A of Figure 1.2). This pattern could derive from a so-called “double minority stress” effect (Meyer, 2010[12]; Meyer, 2003[13]), meaning that LGBTI+ individuals within a racial/ethnic minority group may face compounded stigma from both racism and LGBTI+-phobia, making some less inclined to openly identify as LGBTI+ (Grov et al., 2006[14]; Rosario, Schrimshaw and Hunter, 2004[15]; Maguen et al., 2002[16]). This pattern could also be due to the more negative attitudes towards LGBTI+ individuals that, on average, prevail among non-Hispanic Blacks and non-Hispanic Asians, as documented in Chapter 3. Second, the greater propensity of Hispanic individuals to identify as LGBTI+ is predominantly due to their young age. Third, individuals identifying with other racial categories, including American Indian and Alaska Native, Native Hawaiian and Other Pacific Islander, and mixed-race individuals, are more likely to self-identify as LGBTI+. This finding may flow from relatively more accepting attitudes towards diverse sexual orientations and gender identities within some Indigenous groups (Jacobs, 1997[17]; Besnier and Alexeyeff, 2014[18]), and from a more fluid mindset among mixed-race individuals used to navigate multiple identities.
4. LGBTI+ Americans are less likely to be partnered or married, and to live in a household with children (Panel B of Figure 1.2). These disparities are consistent across all LGBTI+ subgroups, with cisgender gay men facing the most significant disparity. That said, partnership and marriage rates of LGBTI+ individuals have shown signs of convergence with those of their non-LGBTI+ peers, reflecting improved attitudes towards LGBTI+ individuals, the legalisation of same‑sex marriage in 2015 by the U.S. Supreme Court, and the spread of the internet and dating apps (National Academies of Sciences, Engineering, and Medicine, 2020[19]). Despite these recent increases in partnership and marriage rates among LGBTI+ adults, disparities in the likelihood of LGBTI+ becoming parents have remained stable. This stagnation may reflect limited access to adoption, assisted reproductive technologies, and surrogacy, stemming from a combination of legal, financial, and discriminatory barriers (Medina and Mahowald, 2023[7]; Farr, Vazquez and Patterson, 2020[20]). These restrictions in turn likely contribute to LGBTI+ individuals’ lower expectations about becoming parents (National Academies of Sciences, Engineering, and Medicine, 2020[19]; Coffman, Coffman and Marzilli, 2024[21]).
5. Non-cisgender Americans of any age face significant disadvantages in high school and college attainment, as do young cisgender non-heterosexual individuals (Panel B of Figure 1.2) – except for cisgender gay men who, irrespective of their age, experience a consistent (albeit decreasing) college attainment advantage. The fact that some cisgender non-heterosexual individuals experience a college attainment advantage presumably flows from a non-disclosure bias whereby only better educated non-heterosexual individuals disclose their sexual orientation (Valfort, 2017[2]). This bias is especially at play among older generations who have been exposed to stronger marginalisation than younger generations. In addition, the college advantage could also flow from developing coping strategies that translate into greater perseverance in academic pursuits (Pachankis and Hatzenbuehler, 2013[22]). Conversely, the observed educational penalties likely stem from a challenging school environment, exclusionary behaviours exhibited by parents and other family members, and mental health struggles, particularly those arising from stigma but also, in the specific case of non-cisgender individuals, from gender dysphoria (National Academies of Sciences, Engineering, and Medicine, 2020[19]).
Figure 1.2. LGBTI+ Americans differ on key demographics, including sex assigned at birth, age, race/ethnicity, family structure, and educational attainment, relative to their cisgender straight peers
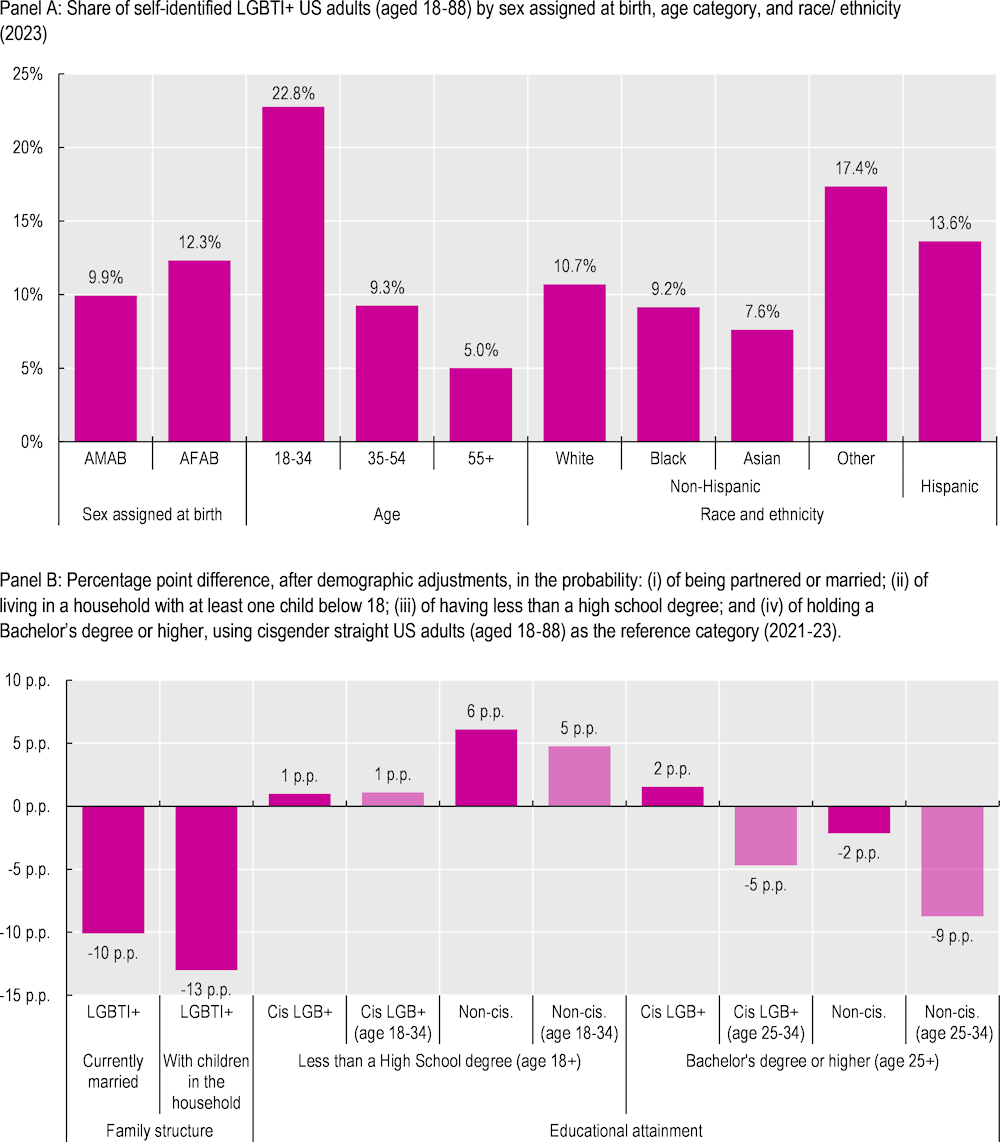
Note: LGBTI+ refers to respondents who self-identify as gay/lesbian, bisexual, transgender, other non-heterosexual, and other non-cisgender. Cisgender LGB+ refers to cisgender non-heterosexual individuals (gay/lesbian, bisexual and other non-heterosexual). Non-cisgender refers to individuals whose gender identity does not match their sex assigned at birth. In Panel B, the percentage point differences are estimated from a Logistic regression, controlling for key demographic characteristics (sex assigned at birth, age category, race and ethnicity, marital and parental status, number of adults in the household, educational attainment and living in one of the 15 largest metropolitan statistical areas), as well as state and survey wave fixed effects. Percentage point differences are statistically different from zero at the 95% confidence level. Person-level weights used.
Source: Household Pulse Survey (4 January 2023 – 10 July 2023) for Panel A; Gallup Poll Social Series (2020‑22) and Household Pulse Survey (21 July 2021 – 10 July 2023) for Panel B.
1.3. Are LGBTI+ Americans discriminated against?
1.3.1. Anti-LGBTI+ discrimination is a reality in the United States
Evidence suggests that anti-LGBTI+ discrimination is a reality in the United States, as it is in other OECD countries. This is the conclusion that flows from three sets of evidence within the United States:
Using the Gallup data, the first set of evidence relates to attitudes towards LGBTI+ individuals. The United States has witnessed a notable shift towards greater acceptance of homosexuality, but this has not been as widespread for other sexual orientations and non-cisgender identities. In fact, a declining minority of Americans are supportive of non-cisgender identities. For instance, only 43% of Americans consider changing one’s gender to be morally acceptable in 2023, noting that this share has been decreasing in the past years. This development coincides with a rising number of anti-trans bills, with over 150 passed in various US states since 2021 (Trans Legislation Tracker, 2024[23]).
The second set of evidence stems from perceptions of discrimination, which continue to be widespread among LGBTI+ Americans. A survey conducted in 2022 by the Center for American Progress revealed significant disparities in experiences of discrimination between LGBTI+ and non-LGBTI+ Americans (Medina and Mahowald, 2023[7]), with LGBTI+ Americans encountering discrimination at much higher rates than their non-LGBTI+ counterparts, especially when non-cisgender (Medina and Mahowald, 2023[7]; Coffman, Coffman and Marzilli, 2024[21]). Consequently, a substantial 78% of LGBTI+ respondents, including 90% of non-cisgender individuals, report taking at least one concealment action to avoid discrimination, such as hiding a personal relationship or altering one’s dress style (Medina and Mahowald, 2023[7]; Folch, 2022[8]).
The third set of evidence derives from field experiments, notably correspondence studies in the labour market. In the context of anti-LGBTI+ discrimination, correspondence studies involve sending out, in response to real job ads, the CVs and letters of application of fictitious candidates who are identical except for their sexual orientation or gender identity. Results from such field experiments uncover significant hiring discrimination against LGBTI+ candidates. In the United States, fictitious candidates who indicate they worked as treasurer for the gay and lesbian campus organisation have at least 30% fewer chances of being invited to a job interview than their straight peers with experience as treasurer in another progressive student association (Tilcsik, 2011[24]; Mishel, 2016[25]). Although correspondence studies focusing on transgender fictitious candidates are scarce, they also reveal substantial discrimination. In such studies, the transgender fictitious candidates usually add their preferred first name along their legal first name, e.g. “Anne McCarthy (Legal Name: Greg McCarthy)”, while the cisgender candidates only mention their legal name (Bardales, 2013[26]). Recently, a large‑scale correspondence study conducted in the United States from 2019 to 2021 and involving over 100 Fortune 500 companies, offered additional insights (Kline, Rose and Walters, 2022[27]; Kline, Rose and Walters, 2024[28]). While primarily focused on assessing gender- and race‑based discrimination, the study also explored other legally protected characteristics, including age and LGBTI+ identity. The findings reveal a penalty for white applicants who indicate LGBTI+ club membership on their resumes. This result emerges despite the study focusing on large firms, which are typically thought to exhibit less discriminatory behaviour due to more standardised hiring procedures. In contrast, indicating LGBTI+ club membership appears to benefit Black applicants, underscoring the intricate interplay of different identities. This complexity highlights the necessity for further research to fully understand the layered effects of possessing multiple marginalised attributes.
1.3.2. Anti-LGBTI+ discrimination is anticipated to negatively affect the labour market (and health) outcomes of LGBTI+ Americans
Anti-LGBTI+ discrimination is expected to hamper the labour market (and health) outcomes of LGBTI+ individuals via four main channels.
1. Hostile environments affect key demographic characteristics of LGBTI+ individuals which, in turn, critically shape their life trajectories. For instance, considering the positive correlation between educational attainment and employment outcomes, non-cisgender Americans, who often have fewer educational credentials presumably due to systemic bias, are likely to experience higher unemployment rates and lower labour earnings compared to their cisgender straight peers.
2. Anti-LGBTI+ discrimination in the labour market raises barriers to the hiring of LGBTI+ individuals. Consequently, some LGBTI+ individuals end up being unemployed or effectively removed from the labour force. Moreover, when LGBTI+ individuals are employed, they tend to be confined to lower-skilled positions than they would otherwise occupy in the absence of blatant or subtle anti-LGBTI+ discrimination in the workplace. This results in a misallocation of talent and an underutilisation of existing human capital, causing lower wages for LGBTI+ American workers. For instance, LGBTI+ individuals often encounter a glass ceiling that hinders their progress towards top-tier positions (McCay, 2024[29]) and may avoid certain jobs altogether to sidestep anticipated discrimination (Medina and Mahowald, 2023[7]). The HPS data confirm that LGBTI+ individuals often find themselves in sectors and occupations characterised by lower pay. Even those who conceal their identity to escape discrimination are adversely impacted. Concealment obstructs the formation of authentic relationships with colleagues and managers, affecting workplace collaboration, mentorship, and support. Specifically, closeted LGBTI+ individuals might avoid networking or professional development opportunities to mitigate the risk of disclosure of their identity. Furthermore, the mental burden of not being able to bring their whole self to work can significantly undermine their productivity at work (Folch, 2022[8]; Human Rights Campaign Foundation, 2018[30]).
3. The detrimental consequences of anti-LGBTI+ discrimination in the labour market are amplified by negative feedback effects to the extent that lower labour market prospects undermine incentives to participate in the labour force and reduce their productivity at work (Carcillo and Valfort, 2025[31]).
4. These harmful repercussions on LGBTI+ individuals’ labour supply and productivity are further compounded by the fact that anti-LGBTI+ discrimination (in and outside the labour market) undermines the mental health of LGBTI+ individuals. A rapidly growing literature is providing compelling evidence that stigmatisation does play a key role in LGBTI+ people’s worse mental health, a disparity which, in turn, provides a fertile ground to other pathologies, such as cardiovascular diseases (National Academies of Sciences, Engineering, and Medicine, 2020[19]) (Valfort, 2017[2]).
Consistent with the latter channel, our results reveal that LGBTI+ Americans suffer from major mental health unexplained gaps: they are more than 50% more likely to be at risk of generalised anxiety or major depressive disorder, compared to their cisgender straight peers (Figure 1.3). These mental health penalties are consistent across all LGBTI+ subgroups, with non-cisgender Americans facing the strongest disparities.
Importantly, comparing mental health responses from both the Gallup US Daily Survey (2012‑17) and the Gallup Panel – COVID‑19 Survey (2020) reveals a substantial negative impact of the COVID‑19 pandemic on the mental well-being of Americans, which is particularly pronounced among LGBTI+ individuals – a trend corroborated by previous research (OECD, 2021[32]; OECD, 2021[33]; OECD, 2021[34]). Several factors could explain the widening of mental health disparities between LGBTI+ individuals and their cisgender straight peers during the COVID‑19 crisis. These include pre‑existing higher rates of mental health issues within the LGBTI+ population, potentially making them more susceptible to pandemic-related stress. Additionally, COVID‑19 containment measures, such as social distancing and lockdowns, imposed unique challenges on LGBTI+ individuals, such as isolation from chosen families or forced cohabitation with unsupportive biological family members, further exacerbating mental health gaps.
Figure 1.3. LGBTI+ Americans suffer from unexplained mental health, labour market, and household income gaps, compared to their cisgender straight peers

Note: LGBTI+ refers to respondents who self-identify as gay/lesbian, bisexual, transgender, other non-heterosexual, and other non-cisgender. Cis. LGB+ refers to cisgender non-heterosexual individuals (gay, lesbian, bisexual and other non-heterosexual). Non-cis. refers to non-cisgender individuals (individuals whose gender identity does not match their sex assigned at birth). The percentage differences are estimated from a regression controlling for key demographic characteristics (sex assigned at birth, age groups, race and ethnicity, marital and parental status, number of adults in the household, educational attainment and living in one of the 15 largest metropolitan statistical areas), as well as state and survey wave fixed effects. Labour earnings regression also includes sectoral and occupational dummy variables. Gaps are statistically different from zero at the 95% confidence level. Person-level weights used.
Source: Household Pulse Survey (21 July 2021 – 10 July 2023) among working-age US adults (aged 18‑74) living alone for probability of being employed; Household Pulse Survey (14 September 2022 – 10 July 2023) among working-age US adults (aged 18‑74) living alone for labour earnings; Household Pulse Survey (21 July 2021 – 10 July 2023) among US adults (aged 18‑88) for household income and probability of having symptoms of anxiety or depression.
1.3.3. LGBTI+ Americans suffer from unexplained labour market (and health) gaps compared to their cisgender straight peers
In line with the above mechanisms, extensive evidence from representative survey data reveals significant penalties for LGBTI+ individuals in terms of employment rates and labour earnings, both in the United States and in other OECD countries. This disadvantage holds after accounting for essential demographics (Badgett, 1995[35]; Drydakis, 2022[36]; Klawitter, 2015[37]; Carpenter, Lee and Nettuno, 2022[38]; Valfort, 2017[2]; OECD, 2019[1]).
This report distinguishes itself by dissecting the data further into specific LGBTI+ subgroups and different cohorts. Additionally, the large number of observations contained in the HPS dataset allows restricting the analysis of labour market outcomes to individuals living alone (with no other adult or children in the household). This method reduces the potential bias arising from different household specialisation across same‑sex and different-sex couples, which has historically led to overestimating the penalty for non-heterosexual men and underestimating it for non-heterosexual women (Hofmarcher and Plug, 2022[39]; Jepsen and Jepsen, 2015[40]; Jepsen and Jepsen, 2002[41]).
The results confirm substantial labour market gaps, even after adjusting for essential demographics and for sector and occupation for those employed (Figure 1.3). Overall, LGBTI+ Americans are 7% less likely to be employed and, conditional on being employed, they show labour earnings which are also 7% lower. These labour market penalties translate into lower household income for LGBTI+ Americans (Figure 1.3).3 These disparities are especially strong among non-cisgender Americans, potentially due to their greater exposure to discrimination. In addition, complementary findings indicate that the labour market gaps are more pronounced among younger cohorts, presumably due to lower non-disclosure bias compared to older generations.
An analysis of income disparities for LGBT people over time indicates that the COVID‑19 pandemic exacerbated their economic challenges. Between 2012 and 2017, the LGBT income penalty estimated from the Gallup US Daily was 7%, which aligns with the income penalty observed in the HPS data from 2021 to 2023. However, from April to December 2020, the Gallup COVID‑19 survey recorded a significantly higher LGBT income penalty of 12.5%. These results are consistent with previous findings suggesting that LGBTI+ adults are especially vulnerable during crises (OECD, 2021[32]; Wenham, 2020[42]; Movement Advancement Project, 2020[43]).
1.4. Does LGBTI+ equality pay?
Ending discrimination against LGBTI+ Americans and fostering inclusive environments and opportunities, both within and outside the labour market, ensures economic and social well-being of LGBTI+ Americans. But there is more. This shift also results in the production of more goods and services and generates greater income for spending, saving, or investing. Ultimately, these changes benefit all of society.
To quantify these economic gains, this report relies on the OECD long-term model which projects GDP up to 2060 (Guillemette and Turner, 2021[44]; Guillemette and Turner, 2018[45]). This model offers a framework to quantify the additional GDP that would result from a gradual convergence of the employment rate and labour productivity (proxied by labour earnings) of LGBTI+ adults to those of their cisgender straight peers, by different target years (namely 2030, 2040 and 2050). In other words, the model assumes that efforts are made every year until full labour market equality between LGBTI+ and cisgender straight Americans is achieved by the target year. This convergence scenario is compared to a baseline scenario where no such efforts are undertaken.4 Thus, this dynamic model helps to strengthen the economic case for LGBTI+ equality with realistic projections, acknowledging that achieving LGBTI+ equality is not an overnight process but one that requires gradual change.
Considering only the mechanisms taken into account by the OECD long term model, the economic consequences of achieving LGBTI+ equality already appear substantial. Under realistic assumptions,5 should the United States succeed in closing the unexplained LGBTI+ gaps in employment and labour productivity by 2050, it could expect an increase in GDP equal to 2.6% of the baseline GDP (Figure 1.4). This corresponds to a yearly increase in GDP equal to 0.1%, which amounts to 5% of the average annual US GDP growth over the past ten years. Of course, a more ambitious goal of closing the gaps by 2030 would lead to a higher yearly GDP increase, representing not 5%, but about 10% of the average annual US GDP growth observed between 2013 and 2023.
There are obviously many more benefits from LGBTI+ equality than just the economic gains derived from the OECD long-term model. For instance, LGBTI+ equality will improve public finances through increased tax revenues and reduced public expenditures. An uptick in production and labour earnings enhances public revenues from corporation tax, income tax, and social security contributions. These positive effects might be further magnified by increased consumption tax revenue, as LGBTI+ individuals spend more on consumer goods and services than their cisgender straight peers, a pattern confirmed by Gallup data. Moreover, eradicating anti-LGBTI+ discrimination is conducive to reduced public expenditures, as greater workforce participation reduces the need for unemployment benefits, active labour market policies, and social transfers. Greater LGBTI+ equality is also anticipated to reduce public health expenditures, as stigma is a significant driver contributing to the poorer mental, behavioural, and physical health of LGBTI+ individuals.
Beyond bolstering tax revenues and reducing public expenditures, eliminating anti-LGBTI+ discrimination might bring significant economic benefits through various additional channels, such as the potential to tap into a diversity and gender equality dividend. Specifically, LGBTI+ equality might have ripple effects on the emancipation of other groups, primarily women. LGBTI+ inclusion inherently challenges heteronormativity, which confines men and women to rigid roles that are obstructive to women’s empowerment. Furthermore, embracing LGBTI+ identities means recognising the complex spectrum of gender, leading to a re‑evaluation of societal expectations for both men and women. In line with this observation, countries most proactive in enacting laws that promote LGBTI+ equality also tend to have the highest support for gender equality and female labour force participation. Additionally, these countries often exhibit the narrowest gender wage gaps (OECD, 2020[46]). Under these circumstances, the elimination of anti-LGBTI+ discrimination might bolster gender equality which, alone, has proven to generate substantial economic gains (OECD, 2023[47]; OECD, 2022[48]).
Finally, adapting a framework developed by the World Health Organization (World Health Organization, 2001[49]; Badgett, 2014[50]), this report estimates the consequences of removing the economic and well-being burden of mental health disparities for LGBTI+ Americans. In 2024, this removal would represent a benefit equivalent to a share of USD GDP ranging from 0.04% to 0.12%.
Figure 1.4. The increase in GDP from addressing the unexplained labour market disparities affecting LGBTI+ individuals is substantial
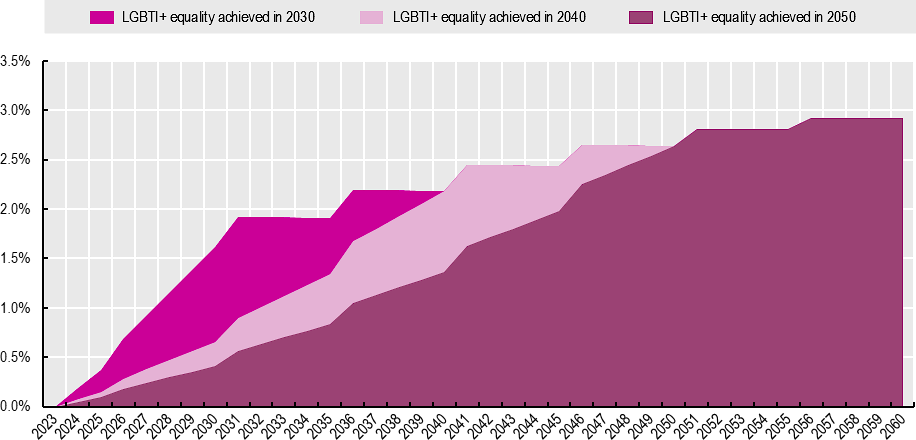
Note: Potential GDP is defined for the total economy using a constant returns-to-scale Cobb-Douglas production function featuring total employment, labour productivity per worker, and physical capital stock.
Source: OECD estimates based on the OECD long-term model projections and Household Pulse Survey data.
References
[50] Badgett, M. (2014), The Economic Cost of Stigma and the Exclusion of LGBT People: A Case Study of India, Washington, D.C.: World Bank Group, http://documents.worldbank.org/curated/en/527261468035379692/The-economic-cost-of-stigma-and-the-exclusion-of-LGBT-people-a-case-study-of-India.
[35] Badgett, M. (1995), The wage effects of sexual-orientation discrimination, Industrial and Labor Relations Review, 48(4), 726–739.
[26] Bardales, N. (2013), “Finding a Job in a Beard and a Dress: Evaluating the Effectiveness of Transgender AntiDiscrimination Laws”, http://www.semanticscholar.org/paper/Finding-a-Job-in-%E2%80%9C-a-Beard-and-a-Dress-%E2%80%9D-%3A-the-of-%E2%88%97-Bardales/b260619b3c78c224663689a6aae11785ed4aedde.
[18] Besnier, N. and K. Alexeyeff (2014), “Gender on the Edge: Transgender, Gay, and Other Pacific Islanders”, University of Hawai’i Press, http://www.jstor.org/stable/j.ctt6wqhsc.
[11] Bettinsoli, M., A. Suppes and J. Napier (2020), Predictors of Attitudes Toward Gay Men and Lesbian Women in 23 Countries, Social Psychological and Personality Science, 11(5), 697–708, https://doi.org/10.1177/1948550619887785.
[31] Carcillo, S. and M. Valfort (2025), “Discrimination in the Labor Market”, MIT Press.
[38] Carpenter, C., M. Lee and L. Nettuno (2022), Economic outcomes for transgender people and other gender minorities in the United States: First estimates from a nationally representative sample, Southern Economic Journal Volume89, Issue2.
[21] Coffman, K., L. Coffman and K. Marzilli (2024), Non-Binary Gender Economics, National Bureau of Economic Research.
[36] Drydakis, N. (2022), “Sexual orientation and earnings: A meta-analysis 2012-2020”, Journal of Population Economics 35: 409-440.
[20] Farr, R., C. Vazquez and C. Patterson (2020), LGBTQ adoptive parents and their children, In A.E. Goldberg and K.R. Allen (Eds.), LGBT-Parent Families: Innovations in Research and Implications for Practice (2nd ed.). New York: Springer.
[8] Folch, M. (2022), The LGBTQ+ Gap: Recent Estimates for Young Adults in the United States, https://doi.org/10.2139/ssrn.4072893.
[9] Goldberg, A. (2023), Impact of HB 1557 (Florida’s Don’t Say Gay Bill) on LGBTQ+ Parents in Florida, Williams Institute, https://williamsinstitute.law.ucla.edu/wp-content/uploads/Dont-Say-Gay-Impact-Jan-2023.pdf.
[14] Grov, C. et al. (2006), “Race, ethnicity, gender, and generational factors associated with the coming‐out process among gay, lesbian, and bisexual individuals”, The Journal of Sex Research, 43:2, 115-121, https://doi.org/10.1080/00224490609552306.
[44] Guillemette, Y. and D. Turner (2021), The long game: Fiscal outlooks to 2060 underline need for, OECD Economic Policy Papers, No. 29, OECD Publishing, Paris, https://doi.org/10.1787/a112307e-en.
[45] Guillemette, Y. and D. Turner (2018), The Long View: Scenarios for the World Economy to 2060, https://doi.org/10.1787/2226583X.
[10] Herek, G. (2002), Gender gaps in public opinion about lesbians and gay men, Public Opinion Quarterly, 66, 40–66.
[39] Hofmarcher, T. and E. Plug (2022), “Specialization in same-sex and different-sex couples”, Labour Economics, Vol. 77, p. 101995, https://doi.org/10.1016/j.labeco.2021.101995.
[30] Human Rights Campaign Foundation (2018), A workplace divided: understanding the climate for LGBTQ workers nationwide, https://www.hrc.org/resources/a-workplace-divided-understanding-the-climate-for-lgbtq-workers-nationwide.
[5] IPSOS (2023), LGBT+ PRIDE 2023: A 30-Country Ipsos Global Advisor Survey, https://www.ipsos.com/sites/default/files/ct/news/documents/2023-05/Ipsos%20LGBT%2B%20Pride%202023%20Global%20Survey%20Report%20-%20rev.pdf.
[17] Jacobs, S. (1997), “Two-Spirit people: Native American gender identity”, Sexuality, and spirituality. University of Illinois Press.
[40] Jepsen, C. and L. Jepsen (2015), “Labor-Market Specialization within Same-Sex and Different-Sex Couples”, Industrial Relations: A Journal of Economy and Society, 54 (1), 2015, p. 109-130.
[41] Jepsen, L. and C. Jepsen (2002), “An Empirical Analysis of the Matching Patterns of Same-Sex and Opposite-Sex Couples”, Demography, 39 (3), 2002, p. 435-453.
[52] Jones, T. et al. (2016), Intersex: Stories and Statistics from Australia, Open Book Publishers, https://doi.org/10.11647/obp.0089.
[37] Klawitter, M. (2015), Meta-analysis of the effects of sexual orientation on earnings, Industrial Relations, 54(1), 4–32, https://doi.org/10.1111/irel.12075.
[28] Kline, P., E. Rose and C. Walters (2024), A Discrimination Report Card, National Bureau of Economic Research, Cambridge, MA, https://doi.org/10.3386/w32313.
[27] Kline, P., E. Rose and C. Walters (2022), “Systemic Discrimination Among Large U.S. Employers”, The Quarterly Journal of Economics, Vol. 137/4, pp. 1963-2036, https://doi.org/10.1093/qje/qjac024.
[6] Levine, A. (2022), “Sexualities and Geographic Mobility Between Childhood and Adulthood in the United States”, Demography 1 August 2022; 59 (4): 1541–1569, https://doi.org/10.1215/00703370-10085223.
[16] Maguen, S. et al. (2002), “Developmental milestones and disclosure of sexual orientation among, gay, lesbian, and bisexual youths”, Journal of Applied Developmental Psychology. 2002;23(2):219–233.
[29] McCay, L. (2024), “Breaking the Rainbow Ceiling: How LGBTQ+ people can thrive and succeed at work”, Business, Bloomsbury.
[7] Medina, C. and L. Mahowald (2023), Discrimination and Barriers to Well-Being: The State of the LGBTQI+ Community in 2022, The Center for American Progress, https://www.americanprogress.org/article/discrimination-and-barriers-to-well-being-the-state-of-the-lgbtqi-community-in-2022/.
[51] Medina, C. and L. Mahowald (2021), “Key Issues Facing People With Intersex Traits”, The Center for American Progress, https://www.americanprogress.org/article/key-issues-facing-people-intersex-traits/.
[12] Meyer, I. (2010), “Identity, Stress, and Resilience in Lesbians, Gay Men, and Bisexuals of Color”, The Counseling Psychologist, 38(3), 442–454, https://doi.org/10.1177/0011000009351601.
[13] Meyer, I. (2003), Prejudice, social stress, and mental health in lesbian, gay and bisexual populations: conceptual issues and research evidence, Psychol Bull. 2003;129:674-697.
[25] Mishel, E. (2016), Discrimination against queer women in the U.S. workforce: A résumé audit study, Socius: Sociological Research for a Dynamic World, 2, 1–13.
[43] Movement Advancement Project (2020), “The disproportionate impacts of COVID-19 on LGBTQ households in the U.S.”, http://www.lgbtmap.org/2020-covid-lgbtq-households.
[19] National Academies of Sciences, Engineering, and Medicine (2020), Understanding the Well-Being of LGBTQI+ Populations, Washington, DC: The National Academies Press, https://doi.org/10.17226/25877.
[47] OECD (2023), Joining Forces for Gender Equality: What is Holding us Back?, OECD Publishing, Paris, https://doi.org/10.1787/67d48024-en.
[4] OECD (2023), The Road to LGBTI+ Inclusion in Germany: Progress at the Federal and Länder Levels, OECD Publishing, Paris, https://doi.org/10.1787/977b463a-en.
[48] OECD (2022), The Economic Case for More Gender Equality in Estonia, Gender Equality at Work, OECD Publishing, Paris, https://doi.org/10.1787/299d93b1-en.
[32] OECD (2021), “COVID-19 and Well-being: Life in the Pandemic”, OECD Publishing, Paris, https://doi.org/10.1787/1e1ecb53-en.
[34] OECD (2021), “Supporting young people’s mental health through the COVID-19 crisis”, OECD Policy Responses to Coronavirus (COVID-19), OECD Publishing, Paris, https://doi.org/10.1787/84e143e5-en.
[33] OECD (2021), “Tackling the mental health impact of the COVID-19 crisis: An integrated, whole-of-society response”, OECD Policy Responses to Coronavirus (COVID-19), OECD Publishing, Paris, https://doi.org/10.1787/0ccafa0b-en.
[46] OECD (2020), Over the Rainbow? The Road to LGBTI Inclusion, OECD Publishing, Paris, https://doi.org/10.1787/8d2fd1a8-en.
[1] OECD (2019), Society at a Glance 2019: OECD Social Indicators, OECD Publishing, Paris, https://doi.org/10.1787/soc_glance-2019-en.
[22] Pachankis, J. and M. Hatzenbuehler (2013), The Social Development of Contingent Self-Worth in Sexual Minority Young Men: An Empirical Investigation of the ‘Best Little Boy in the World’ Hypothesis., Basic and Applied Social Psychology 35(2):176–90.
[3] Robertson, R. et al. (2018), Estimates of Non-Heterosexual Prevalence: The Roles of Anonymity and Privacy in Survey Methodology, Archives of Sexual Behavior 47 (4): 1069-84.
[15] Rosario, M., E. Schrimshaw and J. Hunter (2004), “Ethnic/racial differences in the coming-out process of lesbian, gay, and bisexual youths: a comparison of sexual identity development over time.”, Cultur Divers Ethnic Minor Psychol. 2004 Aug;10(3):215-28, https://doi.org/10.1037/1099-9809.10.3.215.
[53] Rosenwohl-Mack, A. et al. (2020), “A national study on the physical and mental health of intersex adults in the U.S.”, PLoS One. 2020 Oct 9;15(10):e0240088, https://doi.org/10.1371/journal.pone.0240088.
[24] Tilcsik, A. (2011), Pride and prejudice: Employment discrimination against openly gay men in the United States, American Journal of Sociology, 117(2), 586–626.
[23] Trans Legislation Tracker (2024), “2024 anti-trans bills tracker: Anti-trans bills under consideration and passed, 2021-2024”, Trans Legislation Tracker, https://translegislation.com/.
[2] Valfort, M. (2017), “LGBTI in OECD Countries: A Review”, OECD Social, Employment and Migration Working Papers, No. 198, OECD Publishing, Paris, https://doi.org/10.1787/d5d49711-en.
[42] Wenham, C. (2020), “The gendered impact of the COVID-19 crisis and post-crisis period”, European Parliament, Brussels, http://www.europarl.europa.eu/supporting-analyses.
[49] World Health Organization (2001), Macroeconomic and Health: Investing in Health for Economic Development, Comission on Macroeconomics and Health. Prepared for the World Health Organization.
Notes
← 1. Research has found that people with intersex traits report identifying as non-cisgender or non-heterosexual at higher rates than people who are not intersex (Medina and Mahowald, 2021[51]; Rosenwohl-Mack et al., 2020[53]; Jones et al., 2016[52]). Yet, the HPS questionnaire does not allow distinguishing intersex individuals among those who self-identify as LGBTI+.
← 2. For transgender individuals, it is possible that some respondents identify their sexual orientation based on their sex assigned at birth, while others might use their gender identity. Given that the HPS sample does not allow distinguishing between these two reporting strategies, non-cisgender heterosexual and non-cisgender non-heterosexual are combined in one group.
← 3. While the labour market penalties faced by LGBTI+ Americans are likely the primary factor leading to their lower household income, several other factors could also contribute to the LGBTI+ income penalty, such as lower family economic support and discrimination in the housing and financial markets.
← 4. In particular, the OECD long-term model is based on a standard Cobb-Douglas production function featuring physical capital stock, total employment of adults aged 15‑74, and total factor productivity. The baseline scenario is grounded in a set of OECD long-run projections on total employment, labour productivity per worker, and capital stock in the United States (Guillemette and Turner, 2021[44]).
← 5. We recognise in our projections that both the share of self-identified LGBTI+ individuals and the extent of their labour market disparities vary by cohort. Given that younger generations not only have a higher proportion of self-identified LGBTI+ individuals but also face, on average, greater labour market disparities, our projections yield an increase in both the proportion of self-identified LGBTI+ individuals and an increase in the extent of their labour market disparities within the total population. This assumption explains why GDP gains continue to increase even after achieving full labour market parity by the target year.