The OECD is regularly updating its data, stay aware of the latest releases
Data
Trusted statistics supporting evidence-based policy

Find the data you are searching for
-
Find, understand, and use the data you needLearn more
-
Release dates for OECD monthly and quarterly statistical news releases. Statistical news releases are published at 12:00 CET.Learn more
Featured

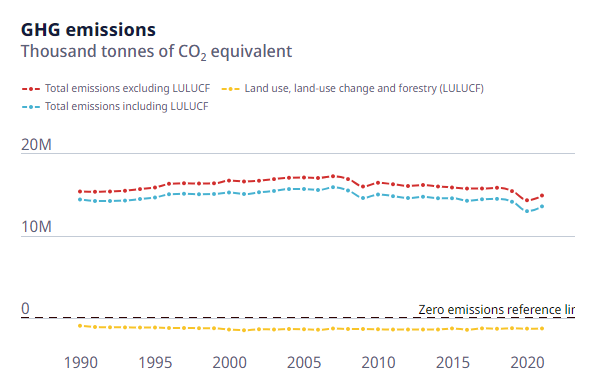
OECD Climate Action Dashboard
International Programme for Action on Climate
OECD

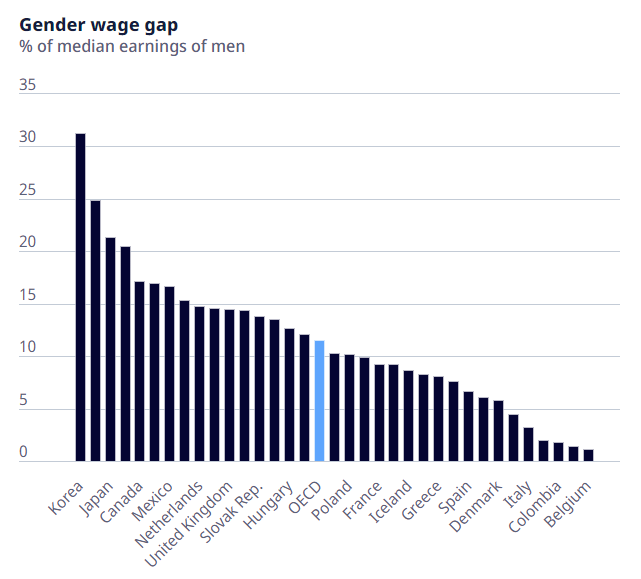
Gender wage gap
Directorate for Employment, Labour and Social Affairs
Gender equality
OECD
Indicators and statistics
-
IndicatorThe gender wage gap is defined as the difference between median earnings of men and women relative to median earnings of men.
-
IndicatorThe foreign-born employment rate is calculated as the share of employed foreign-born persons aged 15-64 in the total foreign-born population (active and inactive persons) of that same age.
-
IndicatorPotential years of life lost is a summary measure of premature mortality, providing an explicit way of weighting deaths occurring at younger ages, which may be preventable.
-
IndicatorThe foreign-born participation rate is calculated as the share of employed and unemployed foreign-born persons aged 15-64 in the total foreign-born population (active and inactive persons) of that same age.
-
IndicatorHealth spending is the final consumption of health care goods and services including personal health care and collective services.
-
IndicatorNet childcare costs are the household expenses of using full-time centre-based childcare, after any benefits designed to reduce the gross childcare fees.
Insights from the latest data
-
Gross domestic product (GDP) in the OECD rose by 0.5% in the third quarter of 2024, slightly up from 0.4% in the previous quarter, according to provisional estimates.Learn more
-
The OECD unemployment rate remained unchanged at 4.9% in September 2024, having been at or just below 5.0% for 30 consecutive months.Learn more
-
Real household income per capita in the OECD rose by 0.4% in the second quarter of 2024 compared with 1.3% in the previous quarter, while real GDP per capita grew by 0.3%.Learn more
-
In this final volume of the PISA 2022 initial report, Volume V: Learning Strategies and Attitudes for Life takes a deep dive into one of the most critical aspects of modern education: students’ readiness for lifelong learning. This volume explores how education systems prepare students to navigate and thrive in an unpredictable future, focusing on their learning strategies, motivation and self-beliefs. It also delves into the role of socio-economic background, gender and the support students receive from parents and teachers in shaping their readiness for sustained lifelong learning.Learn more
-
Year-on-year inflation in the OECD as measured by the Consumer Price Index (CPI) slowed to 4.4% in September 2024 from 4.7% in August.Learn more
-
Stay updated on OECD Data Explorer new features, dataset structural modifications and data availability issues. (access via your MyOECD account)Learn more
Dashboards
-
Dashboardhis platform presents country and regional indicators on the contribution of FDI to productivity and innovation, job quality and skills development, gender equality, and the green economy.
-
DashboardEconomic growth always gets a lot of attention but when trying to determine how well people are doing it is also interesting to look at indicators that highlight households’ economic activity.
-
DashboardThe OECD Data Lake is the go-to platform for accessing essential statistics, policy insights, and visualisation tools on SMEs and Entrepreneurship, their business conditions and policies. It proposes a comprehensive overview of the evidence base, data and action taken across OECD countries to unlock the potential of SMEs and entrepreneurs for innovation, competitiveness, economic development, and sustainability.
-
DashboardThe OECD Short-Term Indicators Dashboard, covers G20 countries and selected regional aggregates. It allows users to follow key macro-economic developments using interactive charts and tables.
-
DashboardThe Climate Action Dashboard by the OECD features key indicators to track progress towards climate objectives and provide a snapshot of country climate action. It is one of the four components of the International Programme for Action on Climate, set up to help countries pursue progress towards net-zero greenhouse gas emissions and a more resilient economy by 2050.
-
DashboardThe OECD Education GPS brings the world of education to your fingertips and provides you with easy access to the OECD's wealth of data on education policies and practices.gpseducation.oecd.org
Tools
-
ToolThe OECD has developed a new tool, the OECD Consumer Barometer that exploits and visualises consumer confidence data.
-
ToolThe Hub shows how digital technologies affect well-being, gathering people’s experiences and statistical data to guide informed decisions and healthy tech relationships.
-
ToolThis interactive platform supports the study and measurement of factors shaping quality in early childhood education and care (ECEC) settings.
-
ToolWith its more than 100 indicators, this OECD tool measures the distance towards the SDGs in more than 600 regions and 600 cities of OECD and partner countries.
-
ToolThe OECD Regions and Cities Atlas is a one-stop shop to access and visualise indicators for regions, cities and functional urban areas.
-
Tool(Quantitative) Structure-Activity Relationships [(Q)SARs] are methods for estimating properties of a chemical from its molecular structure. To increase the regulatory acceptance of (Q)SAR methods, the OECD is developing a QSAR Toolbox to make (Q)SAR technology readily accessible, transparent, and less demanding in terms of infrastructure costs.