Job creation has lowered unemployment, but the Belgian labour market still faces many challenges. Employment rates remain low, reflecting barriers to finding a job such as low levels of skills and weak work incentives. In addition, the changing nature of work will require faster adaptation of workers. In order to address these challenges, this chapter presents a detailed analysis of policy priorities, drawing notably on insights from the OECD Jobs Strategy. One priority should be that each worker has access to lifelong training, with additional allowances targeted to disadvantaged workers. To improve transitions into work, the use of tools for the profiling of individualised risks should be extended. A better combination of income support and incentives could be achieved through reforming both unemployment and in-work benefits. Reforming some aspects of employment protection legislation, such as those related to collective dismissals, and the wage formation system, would boost flexibility. Although Belgium has made good progress in addressing the social assistance needs and tax systems related to non-standard employment, some gaps remain vis-à-vis regular workers.
OECD Economic Surveys: Belgium 2020

Chapter 1. Addressing labour market challenges
Abstract
There have been a number of important recent reforms to increase labour force participation and employment in Belgium. Labour taxation has been reduced, with reductions being targeted, in particular, at low wage earners. Social security contribution reductions have been granted to new employers hiring their first worker. Construction related wage subsidies have been introduced in 2018. In addition, pension reforms, including increases in the statutory retirement age and stricter eligibility requirements for early retirement, have helped to increase the participation and employment of older workers in the labour market.
To lower the rigidity of labour markets, the flexibility of working hours was increased in some industries and notice periods during the initial months of employment have been shortened. Furthermore, the scope for the Flexijob scheme, which allows an employer to employ an employee – who works at least 4/5 for another employer – on flexible hours (e.g. at peak moments) and at favourable terms (e.g. reduced taxation and social security contributions), has been extended. To better take into account international cost competitiveness, wage indexation was temporarily suspended to help close the wage gap, which had accumulated between Belgium and its neighbouring countries. To prevent gaps from re-emerging, the definition of the wage norm, which sets a ceiling on the maximum increase in wages in sectoral collective agreements, was amended in 2017.
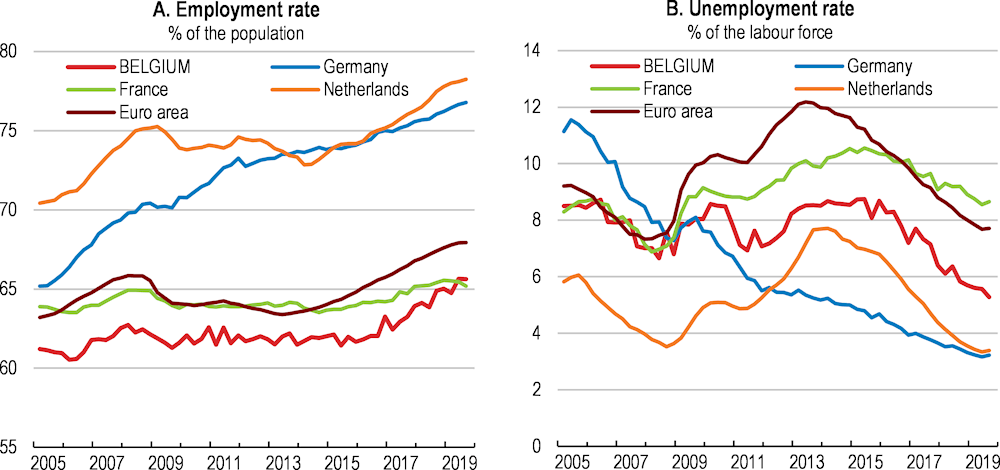
These reforms, combined with moderate but sustained economic growth, have contributed to an improvement of the labour market in Belgium in recent years. The employment rate of the population aged 15 to 64 years increased from 61.8% in 2015 to 64.5% in 2018. The unemployment rate fell to historically low levels, from a peak of 8.5% in 2015 to 5.2% in the third quarter of 2019 (Figure 1.1).
Figure 1.1. The labour market has improved
15-64 year olds
This marked improvement, however, masks a number of challenges. According to the OECD’s new Job Strategy indicators, low employment, primarily due to high levels of inactivity, and a large employment gap for disadvantaged groups are key weaknesses of Belgian labour markets (Figure 1.2, Box 1.1). Growing shortages of high-skilled workers constrain productivity growth, which has been chronically low. There is low job turnover, potentially limiting the speed and effectiveness of efficiency-enhancing reallocation, and it is not clear that wage differentials across firms and individuals reflect productivity differences sufficiently. In addition, the changing nature of work, including through digitalisation, has the potential to significantly alter the content and organisation of work, the skills individuals need over their lives, and the risks they face in the labour market.
Box 1.1. The OECD’s New Jobs Strategy
The digital revolution, globalisation and demographic change are transforming labour markets just when weak productivity growth is limiting the space for public action. These deep and rapid transformations raise new challenges for policy makers. The new OECD Jobs Strategy, launched in December 2018, provides a coherent framework and detailed recommendations in a wide range of policy areas to help countries address these challenges. The new Jobs Strategy, in particular, goes beyond job quantity and considers job quality and inclusiveness as central policy priorities, while stressing the importance of resilience and adaptability for good economic and labour market performance in a changing world of work. The key message is that flexibility-enhancing policies in product and labour markets are necessary but not sufficient. Policies and institutions that protect workers, foster inclusiveness and allow workers and firms to make the most of ongoing changes are also needed to promote good and sustainable outcomes.
The OECD actively supports countries with the implementation of the OECD Jobs Strategy through the identification of country-specific policy priorities and recommendations. This is done through the preparation of chapters in the OECD Economic Surveys as well as analytical background papers on the implementation of the OECD Jobs Strategy in specific countries. The process will be concluded with a synthesis report that will draw lessons from the country reviews and highlight good practices across the full range of policy tools identified by the OECD Jobs Strategy.
The OECD Jobs Strategy makes use of a dashboard to assess the strengths and weaknesses of labour markets in different OECD and non-OECD economies. Belgium performs comparably well in terms of unemployment and earnings quality. The principal weaknesses of the Belgium labour market are low employment, primarily due to high levels of inactivity, and a large employment gap for disadvantaged groups, particularly in terms of the employment gaps of older and migrant workers relative to prime-age males. Belgium also ranks below the OECD average in terms of growth in labour productivity (Figure 1.2).
Source: OECD (2018a), Good Jobs for All in a Changing World of Work - The OECD Jobs Strategy, OECD Publishing, Paris.
This chapter assesses the capacity of Belgium to adjust to both new and existing challenges in the labour market, drawing notably on insights from the new OECD Jobs Strategy. It first positions Belgium in international perspective in terms of the key challenges it faces, including the changing nature of work. Then it discusses policies that could help adapt to these changes and promote a more inclusive labour market. These policies include those: i) to enhance skills to boost the employment of low-skilled workers and to align skills with evolving labour market needs and digitalisation (e.g. adult learning policies); ii) to increase the dynamism of labour markets to enable transitions from unemployment/inactivity to employment and across jobs (e.g. active labour market policies, wage policies and employment regulation); and iii) to increase the ability of the tax and benefit system to incentivise work (e.g. unemployment benefit schemes).
Figure 1.2. Aspects of job quantity and labour market inclusiveness show room for improvement
Dashboard of the labour market according to the new OECD Jobs Strategy¹
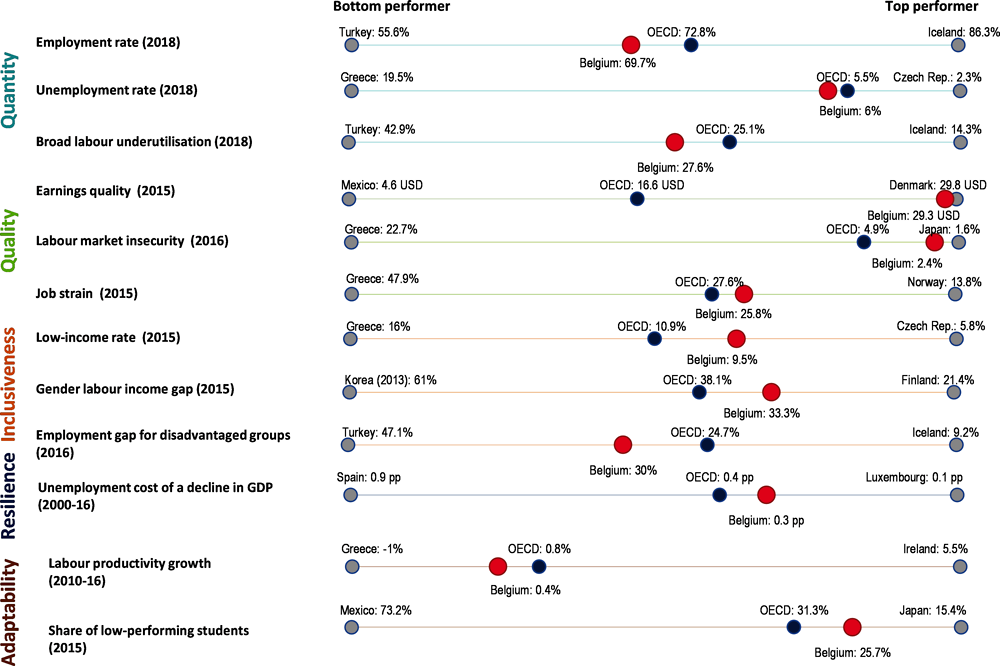
1. Employment rate: share of working-age population (20 to 64) in employment (%). Broad labour underutilisation: share of inactive, unemployed or involuntary part-timers (15 to 64) in the population (%), excluding youth (15 to 29) in education and not in employment. Earnings quality: gross hourly earnings in US dollars adjusted for inequality. Labour market insecurity: expected monetary loss associated with becoming and staying unemployed as a share of previous earnings. Job strain: share of workers in jobs in which there typically exists a high level of professional demand and insufficient resources to meet that demand. Low income rate: share of working-age persons living with less than 50% of median equivalised household disposable income. Gender labour income gap: difference between average annual earnings of men and women divided by average earnings of men (%). Employment gap for disadvantaged groups: average employment gap between prime-age male workers and five disadvantaged groups (women with children, young people not in education or full-time training, workers aged between 55 and 64, people born abroad, people living with disabilities), as a percentage of the employment rate for prime-age male workers. Resilience: average increase in unemployment rate over three years after a negative shock to GDP of 1% (2000-16). Labour productivity growth: average annual labour productivity growth per worker (2010-16). Share of low-performing students: share of 15-year-olds not in secondary school or scoring below Level 2 in PISA (%) (2015).
Source: OECD calculations based on statistics for 2018 or the last available year and various sources; OECD (2018), Good Jobs for All in a Changing World of Work: The OECD Jobs Strategy, OECD Publishing, Paris.
Key labour market challenges in Belgium
Low employment reflects worker-related barriers to employment
If accompanied by decent employment conditions, having greater numbers of people in work reduces their risk of poverty and promotes social inclusion. However, the employment rate (for those aged 15 to 64 years) in Belgium at 64.5% is lower than the OECD average of 68.6%. This low employment rate in part could reflect the presence of important worker-related barriers to employment rather than a shortage of job opportunities.
The job vacancy rate in Belgium has increased markedly since 2015, and at 3.4% is now well above the EU average of 2.4% (Figure 1.3). Together with low labour market participation, this could suggest some skills shortages, with the skills that firms need not necessarily corresponding to those of potential job-seekers. Indeed, according the OECD Jobs for Skills Database, the share of high-skilled occupations in total skill shortages at 67% is higher in Belgium than 54% in the OECD (OECD, 2019a). Labour shortages could also be compounded by insufficiently attractive working conditions and financial incentives, in part related to the design of taxation and social protection systems, particularly in the case of low wages.
Figure 1.3. Vacancy rates remain relatively high
Per cent
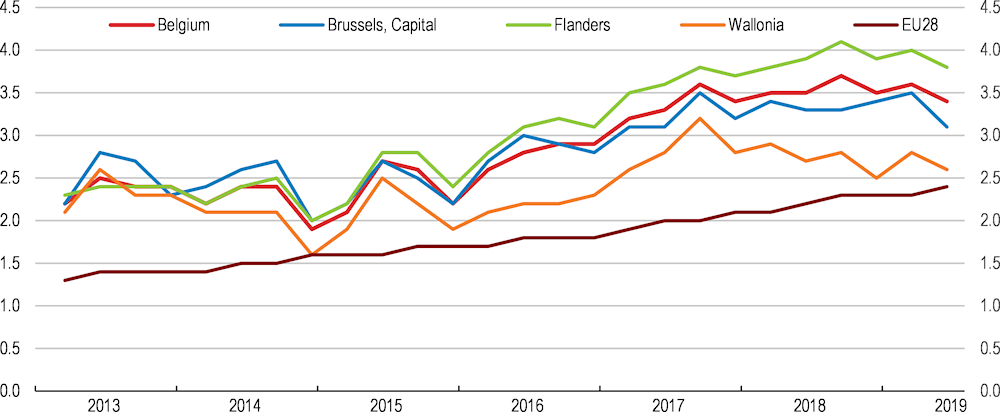
Note: Vacancy rates are computed as the ratio of the number of job vacancies to the sum of the latter and the number of occupied jobs. Jobs in the industry, construction and services sectors, excluding activities of households as employers and extra-territorial organisations and bodies.
Source: Eurostat (2019), Job Vacancy Statistics, Eurostat Database.
New OECD empirical evidence based on micro data for Belgium identifies three types of barriers to employment: work-readiness (low education and skills, low or no past experience), work-availability (health limitations or care responsibilities) and work‑incentives (high partner or non-labour income, or generous income-support). Low skills, both in terms of education and work experience, and health limitations represent the most common barriers in Belgium (Hijzen et al., 2020; Figure 1.4). Furthermore, more than 50% of those aged 18-64 that report to be long-term unemployed, inactive or to have a weak labour market attachment face a combination of these individual barriers to employment, which highlights the importance of tailored interventions (Box 1.2). In this context, profiling tools could help identify the multiple barriers faced by each unemployed person.
Figure 1.4. There are multiple worker-related barriers to employment
Per cent of the population that faces each identified employment barrier
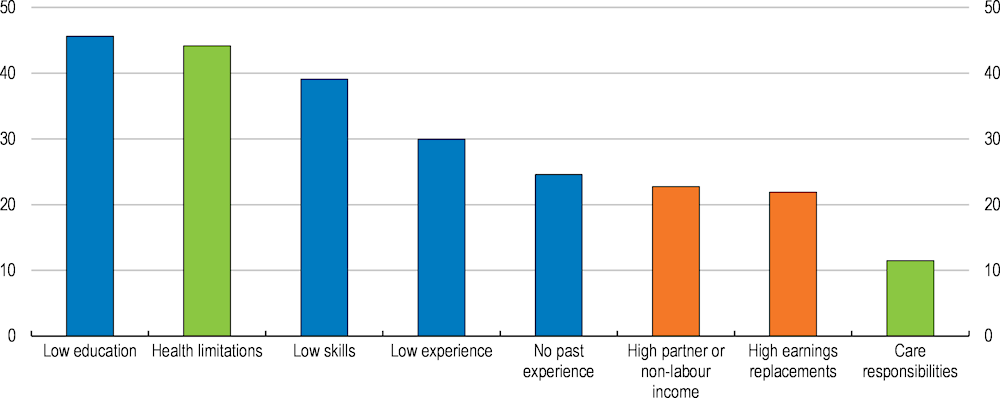
Note: The population experiencing major employment difficulties is defined as those aged 18-64 that report to be long-term unemployed, inactive or to have a weak labour market attachment (an unstable job, restricted working hours or with near-zero earnings), excluding full-time students and those in compulsory military service. Blue bars denote the prevalence of work-readiness barriers, green bars work-availability barriers and orange bars work-incentive barriers. The figure reports the proportion of this population that faces each identified employment barrier. As individuals can face multiple employment barriers, the bars do not sum to 100. See (Fernandez et al., 2016) for more details.
Source: Hijzen et al. (2020), “Lowering employment barriers in Belgium and Norway”, OECD Social, Employment and Migration Working Papers. Calculations based on EU-SILC 2017.
Box 1.2. Developing tailored interventions to tackle individual barriers to employment
The population of individuals, who are long-term unemployed, inactive or have a weak labour market attachment, in Belgium can be divided into ten groups that each face a different combination of the employment barriers identified in Figure 1.4. Table 1.1 presents the extent to which these ten groups face barriers related to the three categories of work availability, work readiness and work incentives.
Given individuals can face multiple barriers, it will be crucial to identify the needs of each individual worker for a tailored policy response. For example, Group 1 (relatively well-educated unemployed) will need assistance in job search, application and matching, while Group 5 (early retirees with low work incentives) will require lifelong learning policies (see below). Work incentives for two groups, which mainly consist of women with a working partner (Groups 3 and 4), could be improved by changing the taxation of second earners, while members of the group of women with childcare responsibilities (Group 6) could benefit from improved childcare services.
Table 1.1. Groups facing different combinations of employment barriers
|
Group |
Label |
Work readiness |
Work availability |
Work incentives |
|---|---|---|---|---|
|
1 |
Relatively well-educated unemployed |
More ready |
More available |
Stronger incentives |
|
2 |
Young lower educated part-time workers |
More |
More |
Stronger |
|
3 |
Part-time working women with a working partner |
More |
More |
Weaker |
|
4 |
Inactive women with high non-labour income |
More |
Medium |
Weaker |
|
5 |
Early retirees & low work incentives |
More |
Medium |
Weaker |
|
6 |
Women with care responsibilities |
More |
Less |
Stronger |
|
7 |
Inactive, no past experience & low education |
Less |
Medium |
Stronger |
|
8 |
Disabled, low education & high earnings replacement |
More |
Less |
Medium |
|
9 |
Women, care responsibilities & no past experience |
Less |
Less |
Stronger |
|
10 |
Low education & health limitations |
Medium |
Medium |
Stronger |
Note: The columns refer to the extent the groups face a barrier related to work availability (health limitations; care responsibilities), work readiness (low education; low work-related skills; no past experience) and work incentives (high non-labour income, high earnings replacements), calculated as an average across individual barriers and expressed in relative terms (whether a group faces a barrier less or more compared to other groups).
Source: Hijzen et al. (2020), “Lowering employment barriers in Belgium and Norway”, OECD Social, Employment and Migration Working Papers. Calculations based on EU-SILC 2017.
There are large disparities in employment between socio-economic groups and regions
There exist significant employment disparities, further underscoring the importance of tailored measures to improve outcomes. For instance, the employment gaps of disadvantaged groups (e.g. older workers, people with disabilities and migrants) with prime-age males are particularly large relative to the OECD average (Figure 1.5). Among the most disadvantaged are non-EU migrants, who are in a much more precarious position in the labour market than their EU peers. Furthermore, only a small part of the employment gap between natives and foreign born from outside the EU is due to their individual characteristics, such as age, gender, level of education or region of residence (HCE, 2018).
Labour market outcomes also differ by region, with varying reasons behind these differences (Table 1.2). For example, the relatively high employment rate in Flanders reflects lower unemployment and inactivity rates than the national average. Both in Wallonia and the Brussels-Capital Region, the relatively low employment rate reflects higher inactivity and higher unemployment, as compared to the national average, though in the Brussels-Capital Region, demographic changes have translated to a strong increase in the working age population. Limited regional mobility between Flanders and Wallonia, due to lengthy commuting times, inadequate public transport links in some cases, and language barriers, is one factor that can help explain regional labour market differences. However, different industrial structures, which contribute to regional productivity differences, as well as education and skill differences across the workforce, could also play a role.
Figure 1.5. Disadvantaged groups face large employment gaps
Employment gap¹, per cent, 2016
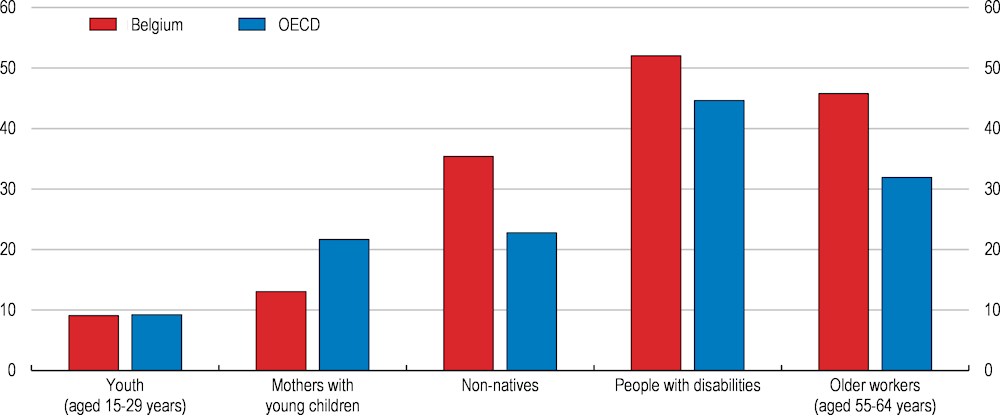
1. The employment gap is defined as the difference between the employment rate of prime-age men (aged 25-54 years) and that of the group, expressed as a percentage of the employment rate of prime-age men. Youth excluding those in full-time education or training. Mothers with young children refers to working-age mothers with at least one child aged 0-14 years. Non-natives refers to all foreign-born people with no regards to nationality.
Source: OECD (2018), Good Jobs for All in a Changing World of Work: The OECD Jobs Strategy, OECD Publishing, Paris; Eurostat (2019), Employment rates by sex, age and country of birth, Eurostat database.
Table 1.2. Regional disparities in labour markets are sizable
2018
1. Aged 15-74.
2. As a % of active population.
3. Aged 15-24.
4. Aged 15-64.
Source: Eurostat.
There is a disconnect between labour productivity and wages
As has been the case in many other OECD countries, Belgium has experienced a fall in its labour share of income over recent decades, but to a lesser extent than other EU countries, with wages growing somewhat less than productivity since 1995, though the reverse was true for the sub-period 2007-17 (Schwellnus, et al., 2018). In the last decade, the slow growth in both productivity and real wages have prevented a significant deterioration in external competitiveness. Nevertheless, a combination of weak productivity growth and the current wage-setting system, which accounts for price and wage, but not productivity developments, neither internal nor in neighbouring countries, can create vulnerabilities.
According to the OECD In-Depth Productivity Review of Belgium, one factor contributing to subdued productivity growth could be a lack of responsiveness of wages to productivity differences at the firm level. Indeed, Belgium firms that are 10% more productive than other firms within the same sector pay on average 2.7% higher wages, lower than the 5.4% on average elsewhere in the OECD (OECD, 2019a). This weak association between productivity and wages at the firm level could lead to an inefficient allocation of employees across firms, with more productive firms finding it relatively difficult to attract skilled workers (OECD, 2018b).
Labour market transitions are relatively low
Low dynamism in people’s careers can constrain productivity growth and lower the efficiency of labour allocation. For example, transitions from inactivity and unemployment to employment are low in Belgium (Box 1.3), as are job-to-job transitions (OECD, forthcoming). These observations can be linked to certain characteristics of the labour market such as the link between pay and seniority, the strict rules on collective dismissals, the design of social protection schemes and the efficiency of active labour market policies.
Box 1.3. Labour market transitions: empirical evidence based on EU-SILC
Following the methodology in Garda (2016), new research uses longitudinal data from the European Union’s Statistics on Income and Living Conditions (EU-SILC) for the period 2005 to 2015 to analyse the patterns and drivers of various types of employment transitions.
Figure 1.6 displays the cross-country differences among the flows into and out of unemployment and inactivity. While the rates of transitions from employment to inactivity or unemployment are close in Belgium, the former is higher than the EU average, while the latter is below the EU average (Panels A and B). The probability of moving from joblessness (economic inactivity or unemployment) to employment, conditional on being jobless at the end of the previous year, is relatively low in Belgium (Panels C and D).
Figure 1.6. Labour market transitions
Per cent¹
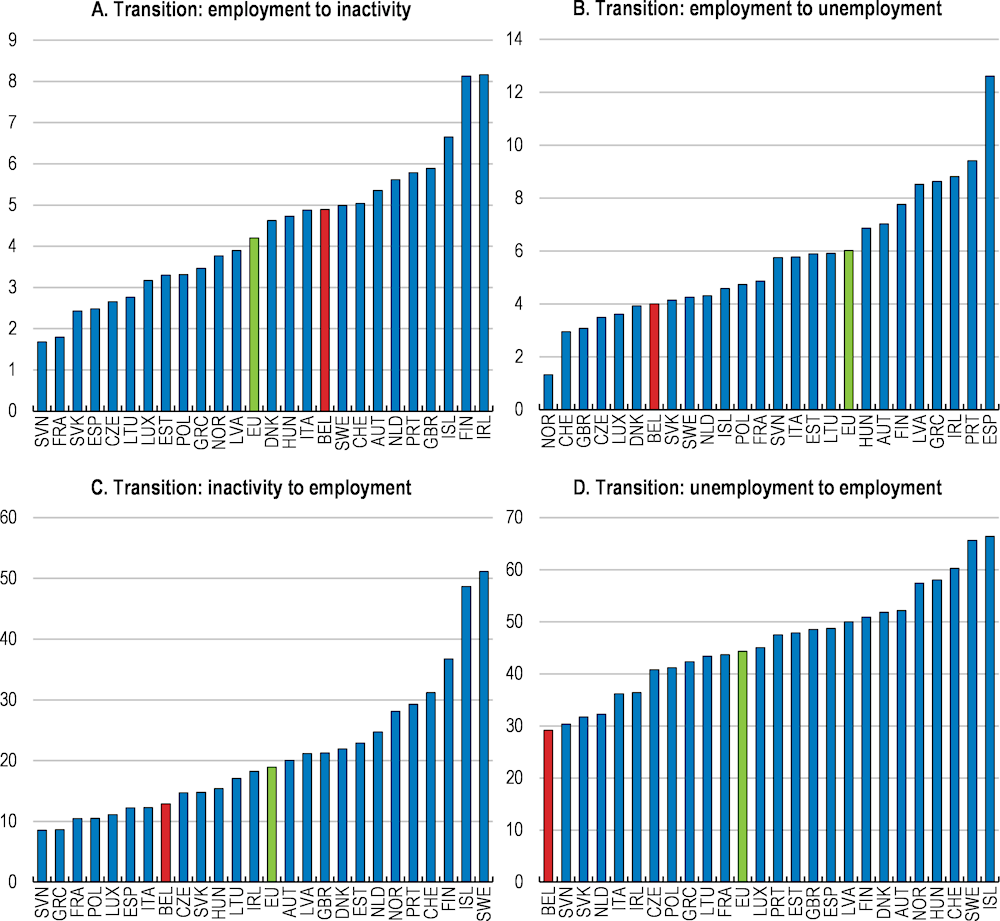
1. Probability of changing labour market status in year t, conditional on being in the previous status at the end of year t-1. Averages from weighted sample for the period 2005-2015. EU is the simple average across the 22 countries included in the sample (all EU countries that are also members of the OECD, with the exception of Germany for which data are not available). The calculations are based on self-assessed answers by the survey respondents.
Source: OECD calculations based on Eurostat's EU-SILC data.
New challenges will emerge as the type and nature of work changes
The prevalence of non-standard work
Non-standard forms of work are all those that deviate from full-time permanent employment and can include platform and temporary work, part-time work and self‑employment. These work arrangements can provide greater flexibility for workers and firms, facilitate the emergence of new business models and could provide a stepping stone to standard employment for some, including for young and low-skilled workers. However, they can also raise concerns about job quality and potentially increase disparities, which might require a fundamental change in labour market, skills and social policies (OECD, 2019b). While it is essential to ensure compensation for the increased business risks that the non-standard workers face, the different tax and pension treatment of these workers (i.e. reduced taxation and lower mandatory pension contributions), as discussed below, can create new distortions. The prevalence of non-standard forms of work may also have important implications for productivity, with self-employed, in particular own-account workers, usually having much lower levels of labour productivity than employees, for example.
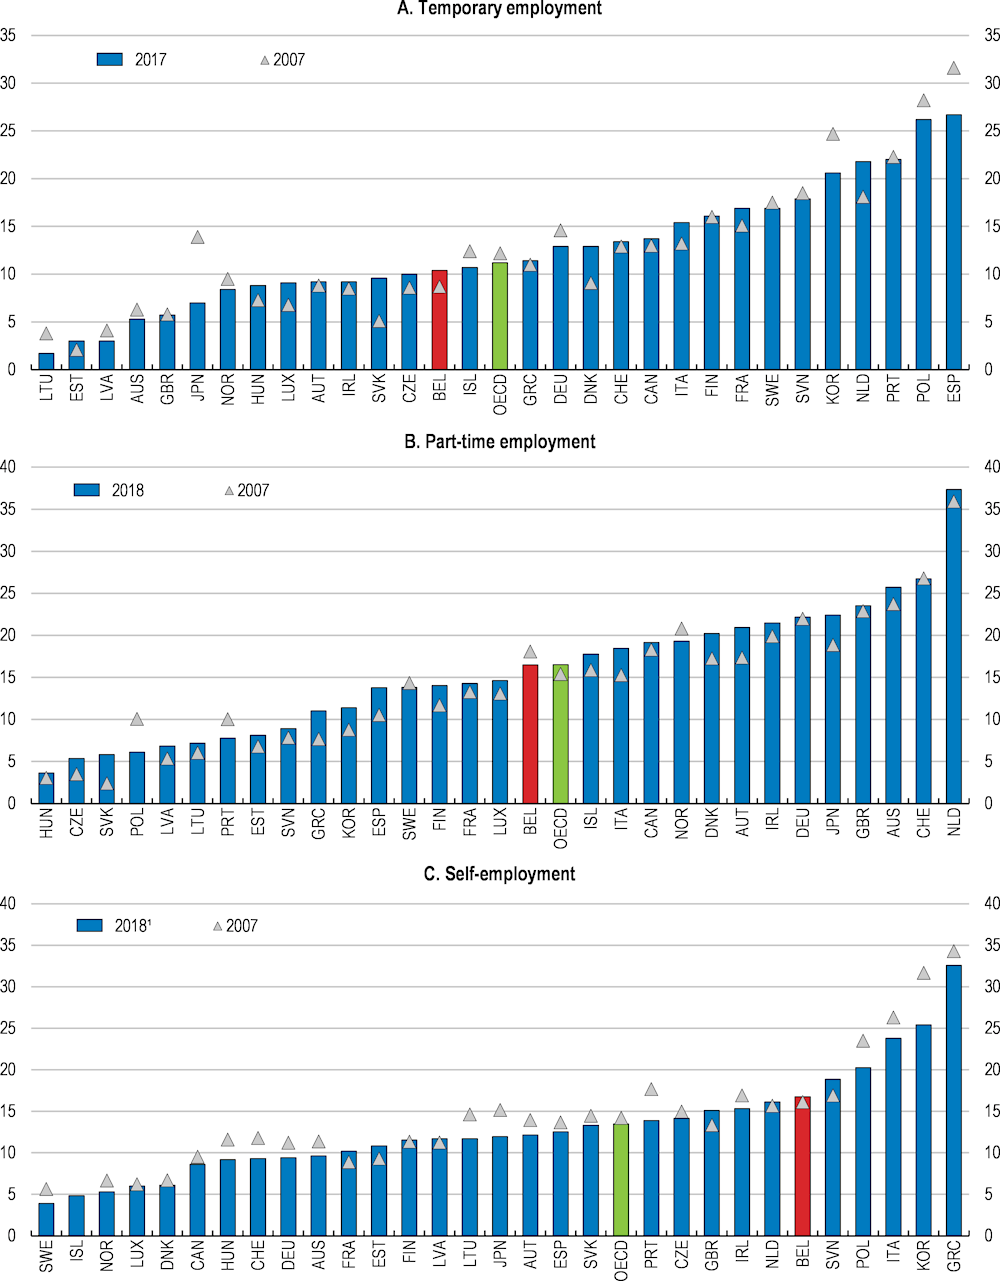
The share of temporary and part-time employment in Belgium is around the OECD average (Figure 1.7, Panels A and B). Self-employment makes up approximately 15% of total employment, which is higher than that of a number of peer countries, such as Denmark, France and Germany (Figure 1.7, Panel C). Own-account workers represent a significant proportion of these (9.4% of total employment in 2016), though this proportion has declined over the last two decades. On the other hand, the share of own-account workers who generally do not have more than one client, increased between 2010 and 2015. This could be indicative of an increase in false self-employment (OECD, 2018a), leading some individuals to not fully benefit from the rights and protections afforded to employees.
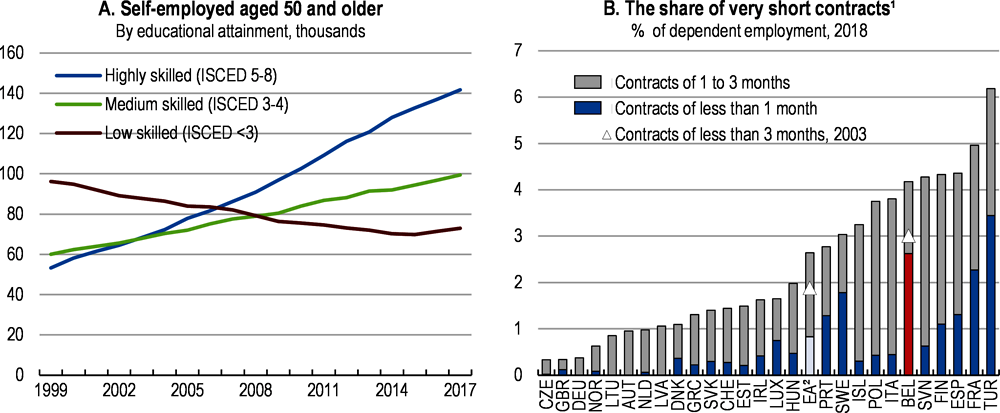
The use of non-standard types of work could increase in the future, as globalisation, and technological change persist, as well as a result of policy change. For example, recent policy reforms introduced the possibility for pensioners (either aged 65 or having had a 45 year career) to combine income from pensions with income from either independent or salaried activity. This could help enhance flexibility and increase the participation and employment of older workers, including self-employment. For those aged 50 and over, there has been a steady increase in self-employment for the high- and middle-skilled (Figure 1.8, Panel A). The prevalence of high- and middle-skilled in self-employment in Belgium is related to the high proportion of liberal professions in self-employment (Nautet and Piton, 2019).
The incidence of temporary employment and the probability that a person with a fixed-term contract will have an open-ended contract three years later in Belgium are around the OECD average (OECD, 2018a). Temporary contracts not only provide flexibility to firms, but potentially also to workers, especially at the start of a career, give opportunities for employment to those who might otherwise have been involuntarily unemployed and can provide an important gateway to permanent employment. Between 2016 and 2017, approximately 40% of individuals on temporary contracts moved to permanent ones in Belgium (Nautet and Piton, 2019).
Figure 1.7. The share of non-standard forms of work in total employment
As a percentage of total employment
1. Or latest year available.
Source: OECD (2019), OECD Labour Force Statistics and OECD National Accounts Statistics (databases).
Nevertheless, seven out of twenty people on temporary contracts are involuntarily on temporary contracts, and the share of very short-term contracts (contracts of less than one month) is high (Figure 1.8, Panel B). Although short-term contracts may be repeatedly offered by the same employer, it can affect workers’ access to training and well-being (OECD, 2018a), with a cost for public expenditures through unemployment benefits. In addition, certain groups are overrepresented in temporary employment, such as non-EU workers, who are around three times more likely to be hired on temporary contracts than Belgians.
Figure 1.8. Emerging trends in non-standard work
1. Rate of very short contracts among fixed-term contracts.
2. Euro area, 19 countries.
Source: Federal Bureau of Planning (2018), estimates based on EUKLEMS data; Eurostat (2019), Detailed annual results of the Labour Force Survey, Eurostat Database.
Digitalisation and automation
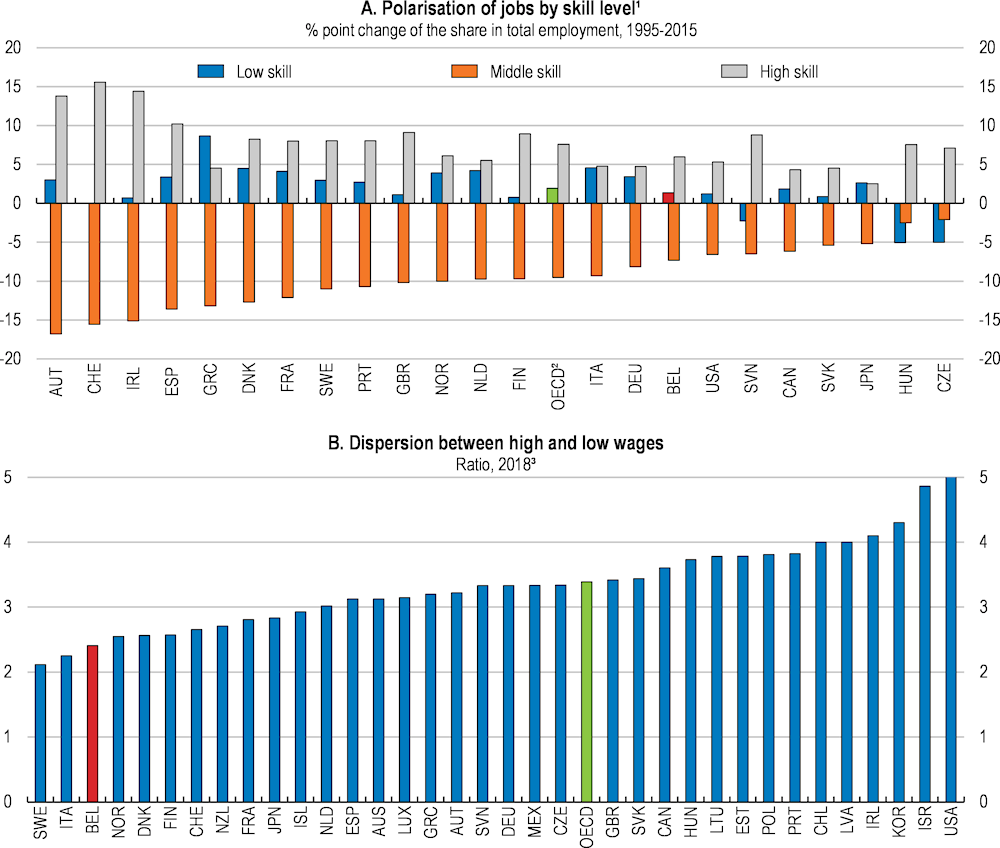
Structural changes, including digitalisation, are also likely to have important consequences for how the nature of work is evolving. As in other countries, the labour market in Belgium has become increasingly polarised over the last few decades (Autor, Katz and Kearney, 2006; Goos and Manning, 2007; Goos, Manning and Salomons, 2009; OECD, 2017a). That is, while the share of highly-skilled and to a lesser extent low-skilled jobs in total employment has increased, the share of middle skilled jobs has declined (Figure 1.9, Panel A; de Sloover and Saks, 2018). Despite these labour market changes, wage dispersion has remained low and stable in Belgium (Figure 1.9, Panel B).
Figure 1.9. The labour market is polarising, but wage dispersion remains low
1. Highly skilled professions are defined as jobs that are classified in the broad groups 1, 2 and 3 of ISCO-88. Medium-skilled professions are defined as jobs that are classified in the broad groups 4, 7 and 8. Low-skilled professions refer to jobs that are classified in the broad group 5. See OECD (2017a) for further details.
2. Simple average of the 23 countries for which data are available.
3. Ratio between the ninth and first wage deciles, gross-earnings of full-time employees; 2018 or latest year available.
Source: OECD (2017), OECD Employment Outlook 2017, OECD Publishing, Paris; OECD (2019), OECD Earnings Statistics (database).
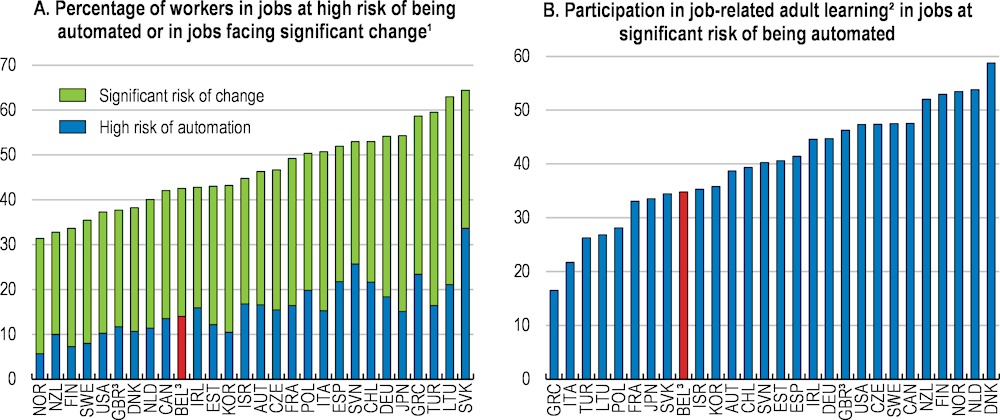
Digitalisation may have profound implications for the labour market, as it creates possibilities for the substitution of workers for machines for a range of tasks. On the other hand, it can help people perform their tasks, improving working conditions and boosting productivity and efficiency. The High Council of Employment has estimated that 39% of jobs in Belgium could be fully digitalised (HCE, 2016). In addition, OECD estimates find that 42% of jobs in Belgium are at significant risk of change or high risk of automation (Figure 1.10, Panel A). While this challenge is less acute than in other OECD countries, the significant share of workers, who are likely to be displaced, and the significant changes in the skill contents of jobs that survive will require better lifelong learning policies. However, participation in lifelong learning at 34.8% is low among workers facing a significant risk of automation in Belgium (Figure 1.10, Panel B).
Figure 1.10. Re-skilling will be required to address the risk that jobs will significantly change due to automation
1. Significant risk of change and high risk of automation refer to probabilities of automation ranging between 50 and 70% and higher than 70%, respectively.
2. Percentage of workers participating in adult learning in the 12 months preceding the survey.
3. The data are based solely on Flanders for Belgium and England and Northern Ireland for the United Kingdom.
Source: Nedelkoska, L. and G. Quintini (2018), “Automation, Skills Use and Training”, OECD Social, Employment and Migration Working Papers, No. 202, OECD Publishing, Paris.
Enhancing skills for evolving labour market needs and digitalisation
Boosting digital skills
Digital technologies offer significant potential to enhance productivity, with a vast literature documenting the existence of positive links between the adoption of digital technologies and firm level productivity (Draca et al., 2009; Syverson, 2011). For example, OECD estimates suggest that across EU countries, an increase in the use of high-speed broadband internet (cloud computing) at the industry level is associated with increased multi-factor productivity for the average firm in that industry. However, productivity gains are weaker in the presence of skills shortages (Gal et al., 2019), which may relate to the complementarities between digital technologies and other forms of capital (e.g. skills, organisation, or intangibles) (OECD, 2019c). Indeed, high-skilled workers are generally better placed to exploit these complementarities, benefiting through both increased labour market participation and higher wages (OECD, 2015a).
The spread of information and communication technology (ICT) in the workplace has been relatively rapid in Belgium, outpacing neighbouring countries. From 1995 to 2014, the level of ICT capital services per hour worked increased by over 450%, likely contributing to significant ICT skills shortages (Figure 1.11). According to Eurostat’s Digital Skills Survey, 57% of working age Belgians had “basic or below-basic” digital skills in 2017. This share is also high for young people aged 16 to 24 relative to other European countries (Figure 1.12). Digital skills are weaker for those with lower education and income. Therefore, for both firms and workers to reap the full benefits of digitalisation, both the distribution and overall level of digital skills should be improved.
Figure 1.11. The rapid spread of ICT has contributed to ICT skills shortages
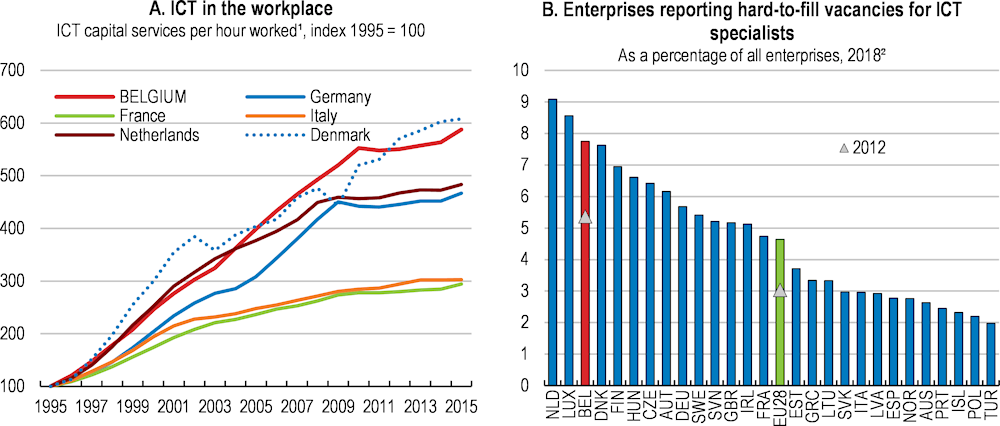
1. Information and communication technologies capital intensity per hour worked refer to the CAPIT_QPH variable in the EU KLEMS database. Data series were extended using growth of the numerator and denominator of the ICT intensity ratio using the various releases of the EU KLEMS database (2009, 2013, and 2017). Values for Denmark have been adjusted to account for abnormally large increases in ICT intensity within the mining industry.
2. Data refer to the 2015/16 fiscal year for Australia and 2017 for Iceland.
Source: OECD (2019), OECD Employment Outlook 2019, OECD Publishing, Paris; calculations based on data from EU KLEMS' growth and productivity accounts; OECD (2019), Measuring the Digital Transformation, OECD Publishing, Paris.
A number of individual initiatives already exist to raise the level of digital skills in Belgium, such as subsidies for various digital projects, the organisation of digital skills fairs, the establishment of a digital hub and digital training for teachers (Box 1.4), which should be evaluated and may benefit from a degree of streamlining. Greater targeting of training in digital skills to low-income and low-qualified individuals would help address the digital skills gap described above and boost the overall level of digital skills. For example, the Public Digital Space for Training in the Brussels-Capital Region organises digital training targeted to low-qualified prisoners. Increasing graduates in STEM fields could also help (see below), while intermediate ICT skills could be further enhanced by generalising access to ICT minors for all tertiary education students, as recommended in the 2017 Economic Survey of Belgium.
In addition, various reforms have either been undertaken or are ongoing in relation to compulsory education, which should enhance the digital skills of students. The French‑speaking Community adopted a Strategy for Digital Education in 2018 and a decree in relation to the initial training of teachers, which introduces new content in ICT, the possibility of training teachers in the implementation of teaching devices integrating digital tools, and a master’s degree specialising in techno-pedagogy in February 2019. Similarly, in Flanders, a curriculum reform was adopted in 2018, to be phased in from September 2019, which sets new learning outcomes and attainment targets related to ICT in the first stage of secondary education.
Figure 1.12. Digital skills are low, especially for some groups
Percentage of respondents claiming to have basic and lower-than-basic digital skills¹, 2017
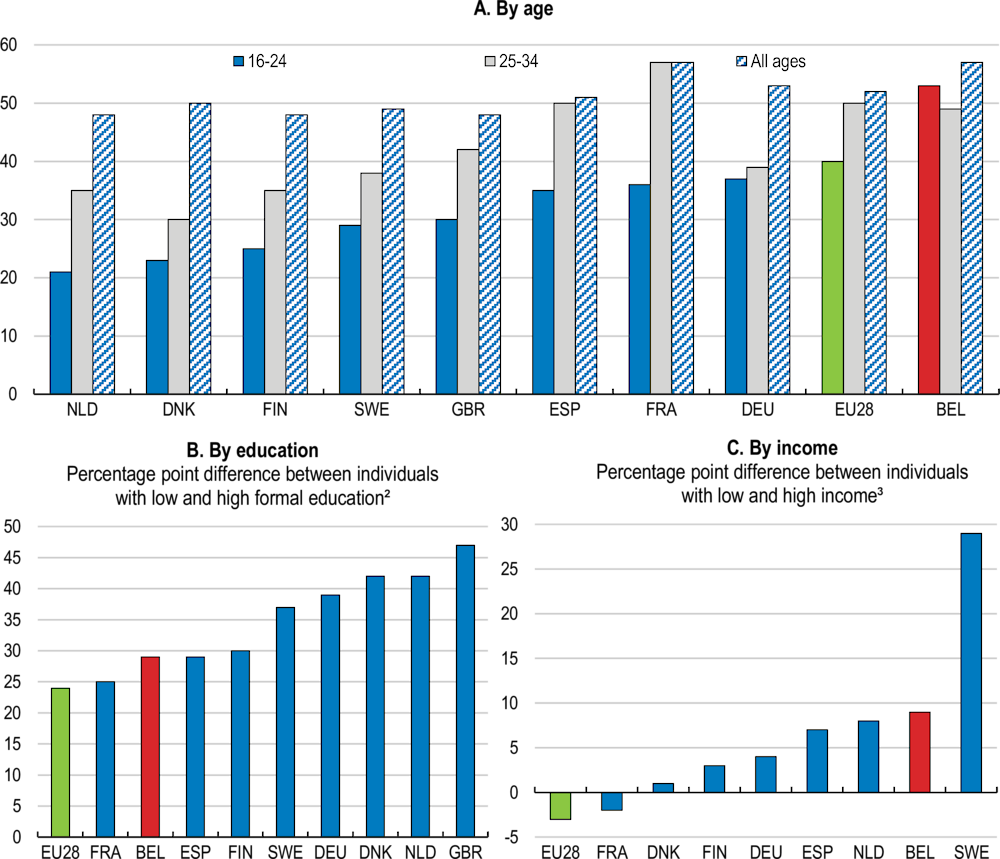
1. Excluding individuals that reported not to have used the internet in the 3 months preceding the survey and were not interviewed about their digital skills.
2. Individuals aged between 25 and 54 years.
3. High income refers to individuals living in a household with income in the fourth quartile and low income refers to individuals living in a household with income in the first quartile.
Source: Eurostat (2019), Self Reported Skills Statistics, Eurostat Database.
Facilitating greater participation in adult education and training, which is low in Belgium (see below), would also help to increase the level of digital skills. There may be scope to improve the efficiency with which such training is provided to employees and increase the transferability of the skills acquired across firms and sectors. In particular, much of the training of employees is organised at the sectoral level in Belgium, with 51% of employees being part of a sector that has taken concrete measures in order to foster training at the sectoral level. Of these, 58% benefitted from two days of training on average per year, with a further 14% benefitting from five days on average (SPF Emploi, Travail et Concertation Sociale, 2017). Greater cooperation and coordination in digital skills training by social partners, for example through the establishment of a centralised training fund, could be of benefit.
Box 1.4. Selected initiatives to boost digital skills development
Digital Belgium Skills Fund: Launched in April 2017, this fund finances projects that enhance the digital skills of socially vulnerable children and young adults. Subsidies of between EUR 50 000 and EUR 500 000 are available for selected projects, with 37 receiving financial support in 2018.
DigitalChampions.be: The Belgium National Coalition for Digital Skills and Jobs brings together stakeholders from government, education and the private sector. It undertakes initiatives such as training, workshops and certifications to enable citizens of all ages and backgrounds to strengthen their digital skills. In addition, DigitalChampions organised its first Digital Skills Fair in May 2017, with another taking place in 2018.
BeCentral: A digital hub in Brussels was established in 2017 by the partners of the National Coalition and more than 40 entrepreneurs. Its objective is to provide at least 10 000 people with digital skills, with over 30 digital initiatives, including coding schools and cybersecurity programs.
WallCode.be: Digital Wallonia aims to increase digital skills of young people with #WallCode by introducing them to coding, algorithmic logic and programming languages. Actions include coding animations for students, digital training for teachers and the organisation of coding weeks.
Coderdojo: CoderDojo organises free coding workshops for those aged 7 to 18 years. It is supported by the Flemish government together with other initiatives such as CodeFever (more formal training programme) and CodeSchools (within school environment).
FabLab Mobile: FabLab Mobile, funded by the Brussels Institute for Innovation (Innoviris), is a TechTruck where young people (aged 10 to 18) are involved in projects related to digital technologies and coding.
Improving vocational education and training
Youth unemployment and the share of youth that is neither employed nor in education and training (NEET) are relatively high in Belgium (Figure 1.13). Vocational education and training (VET) can play an important role in preparing young people for work, developing skills and responding to labour market needs. Programmes including work‑based learning in particular have been widely recognised as an effective means of equipping people with both generic and job relevant skills, by combining learning and work (OECD, 2010). Soft skills, whose importance is growing (Deming and Kahn, 2018), tend to be more easily acquired in workplaces than in classrooms (OECD, 2010). Furthermore, evidence suggests that work-based learning, such as through apprenticeships, can have a positive effect on labour market outcomes in terms of both duration of job search and job tenure for the young in relation to their first job (Bratberg and Nilsen, 1998). From the employers’ perspective, work-based learning provides benefits in terms of useful work matching their needs and as a means of recruitment (Mühlemann, 2017; Kuczera, 2017).
Figure 1.13. The labour market outcomes of the youth are relatively weak
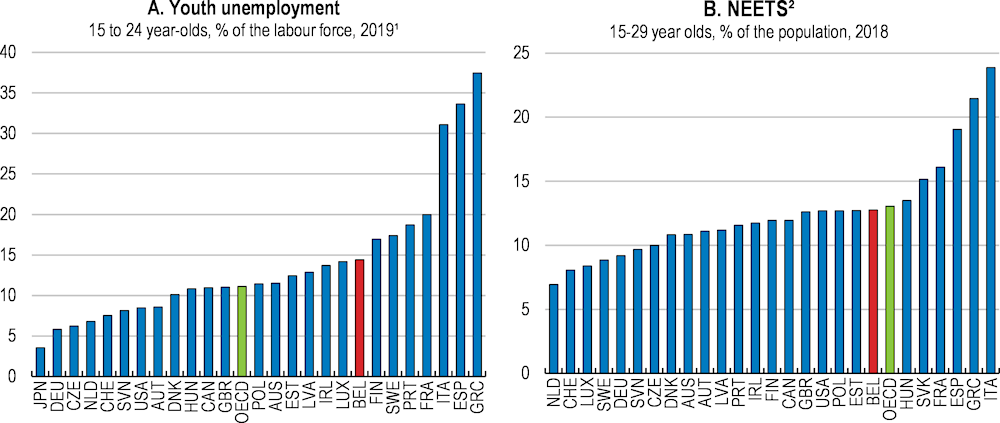
1. Average of the last four quarters.
2. Youths neither in employment nor education or training.
Source: OECD (2019), OECD Labour Force and OECD Education Statistics (databases).
The share of all upper-secondary students enrolled in vocational programmes is high in Belgium at 59%, compared to the OECD average of 44%. However, the proportion of students in vocational programmes, which combine school and work-based learning, is only 3%, which is significantly below the OECD average of 11% (Figure 1.14, Panel A). The low share of students in combined VET programmes goes together with a relatively high proportion of VET graduates neither in education and training nor employment (NEET), at approximately 24% (Figure 1.14, Panel B).
A number of recent initiatives aim to improve the work-based learning component in VET. The Flemish Community approved a new decree on dual learning, starting from September 2019 with 87 study programmes. One important component of the new model is an online tool (werkplek duaal), where firms can apply for accreditation of their apprenticeship place (Syntra Vlaanderen, 2017). In the French Community, a pilot project to organise immersions in business was developed in sectors/subjects with labour shortages. The 2020 Training Plan of the Brussels-Capital Region, adopted in December 2016, includes a number of measures such as the creation of the “training company” label to signal quality offers of training.
Across the OECD, the risk of being NEET is typically higher for VET graduates compared to graduates of general programmes, in part reflecting differences in the likelihood of continuing to higher education. The proportion of graduates of post-secondary VET programmes studying at tertiary level at 2.4% is low in international comparison (Figure 1.14, Panel C). Some recent measures can strengthen the link between VET and higher education. From September 2019, the provision of post-secondary VET will be transferred from adult education centres to higher education institutions in the Flemish Community (OECD, 2018c). Similarly, in 2016, the French Community approved a decree that makes it possible to acquire some higher education degrees dually in an institution-based setting and workplace (OECD, 2018c).
Figure 1.14. There is room to improve vocational education
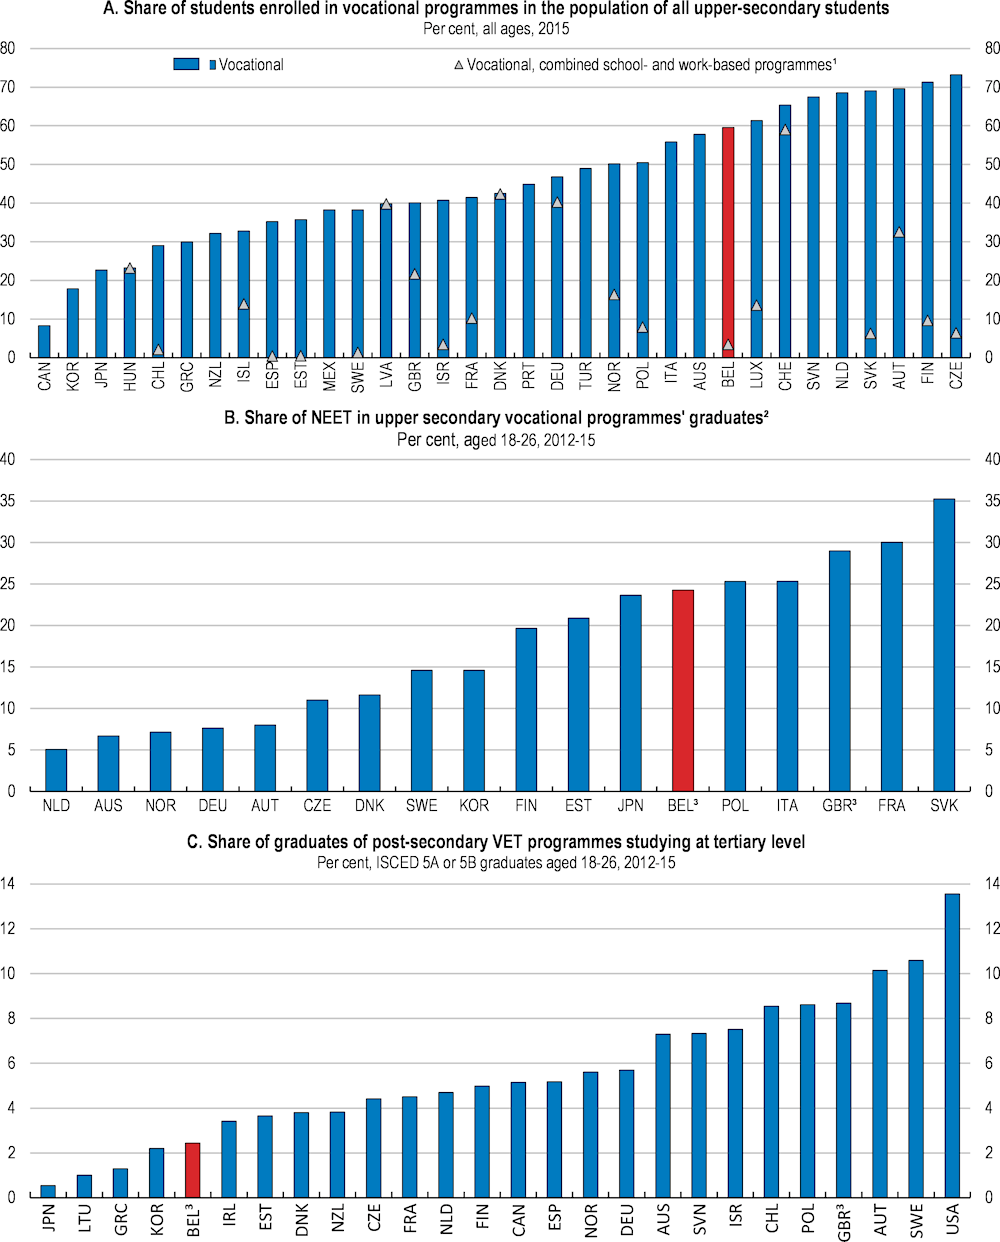
1. Vocational programmes combining school and work-based learning are defined as those in which 25%-90% of the curriculum is delivered in the work environment. Information on combined programmes is missing or the category does not apply for Australia, Canada, Greece, Italy, Japan, Korea, Mexico, the Netherlands, New Zealand, Portugal, Slovenia and Turkey.
2. Neither in employment, education or training. Upper secondary VET includes programmes classified as ISCED 3C long, ISCED 3B and ISCED 3A identified by countries as vocationally oriented.
3. Data for Belgium and the United Kingdom refer solely to, respectively, the Flanders region and England.
Source: OECD (2017), OECD Education at a Glance 2017, OECD Publishing, Paris; OECD calculations based on OECD (2015), OECD Survey of Adult Skills, PIAAC (databases 2012-2015).
As Belgium has a relatively high share of small firms, the fixed costs of providing work-based learning and apprenticeships, related to administration, supervision and training for supervisors, can be prohibitive for many firms. Greater use of online training for workplace trainers could help, as would further efforts to promote training alliances to support companies that cannot provide a full range of skills to apprentices required for the specific occupation. For instance, some provinces in Austria support training alliances by providing information and support to companies about possible partner enterprises and educational institutions, and co-ordinating different training activities (Austrian Federal Ministry of Science, Research and Economy, 2014).
In addition, the new model of dual vocational learning and the various pilot projects should be evaluated from the perspective of both students and companies. For example, a variety of direct subsidies are utilised in different regions in Belgium. Evidence from Switzerland suggests that direct subsidies are more effective for firms not yet involved in workplace training than those firms that already provide training (OECD, 2015b). In some other OECD countries, apprentices are paid a stipend to make apprenticeships an attractive option to both students and employers. In Australia and Norway, there are special bodies that aim to facilitate apprenticeships by matching employers with students looking for workplace training and also facilitate cooperation amongst SMEs in dealing with administrative duties involved in apprenticeship training. Existing financial incentives around dual learning, such as direct subsidies, for both companies and students should be assessed, extended and enhanced, where appropriate. These could be accompanied by compulsory accreditation for companies and renewal of that accreditation, in order to ensure quality is maintained.
Increasing the attractiveness of STEM studies
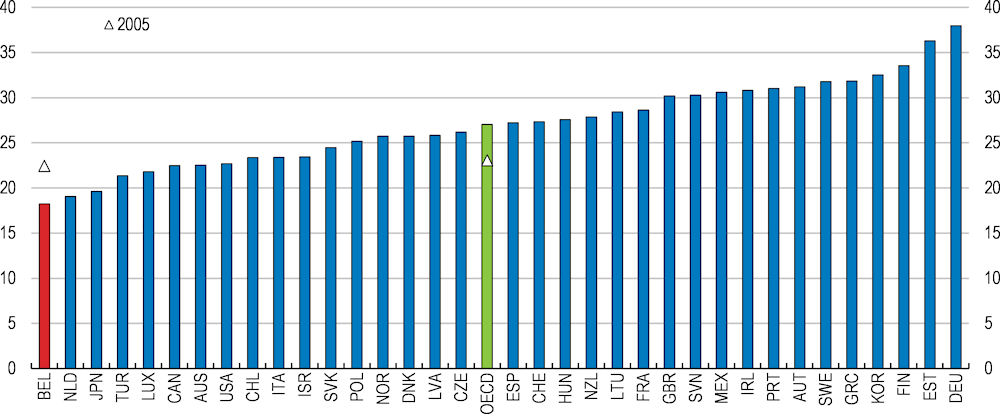
Only 18.2% of tertiary students in Belgium graduated from science, technology, engineering and mathematics (STEM) fields in 2017, down from 22.4% in 2005, and well-below the OECD average of 27% (Figure 1.15). Similarly, among upper secondary graduates from vocational programmes, only 25% graduated with a degree in engineering, manufacturing and construction in 2015, compared with 34% across the OECD. According to the OECD Jobs for Skills Database, professional, scientific and technical activities, and information and communication are amongst sectors facing occupational shortages in Belgium (OECD, 2018d).
A large number of initiatives have been taken to increase the number of graduates in STEM fields. Two of the five key targets of the Flemish 2012-2020 STEM Action Plan to raise the supply of graduates with a STEM education have already been met (e.g. between 2010 and 2017, the percentages of new entrants choosing STEM in professional bachelor programmes increased from 23.8% to 26.6%). The plan included improving the marketing and communication of STEM education, strengthening the training of teachers in STEM fields, improving the process by which career and study choices are made, and attracting more girls to STEM courses and occupations. The French Community has no specific STEM action plan, but introduced various initiatives to promote participation in STEM. Further dissemination of data on wage premia by field of study, instead of just level of study, could also entice more prospective students to choose these fields (OECD, 2017a).
Another factor affecting the number of STEM graduates could be the relative wages of STEM and non-STEM graduates. While graduates of STEM fields in Belgium earn higher wages on average relative to non-STEM graduates, evidence suggests this wage premium is low relative to other countries in the EU (Goos et al., 2013), although this will depend on the level of the STEM qualification (secondary, bachelor or masters). Hence, employers may need to improve the compensation package offered to STEM professionals to attract more students to these fields.
Figure 1.15. The share of STEM graduates in tertiary education is low
Tertiary graduates in natural sciences, engineering and ICT, % of all tertiary graduates¹, 2017
1. Tertiary graduates refer to tertiary education attainments from level 5 to level 8 of the ISCED classification. Graduates in the ICT field are included in other fields for Japan, while data for the Netherlands exclude doctoral graduates.
Source: OECD (2019), OECD Education Statistics - Graduates by field (database).
Creating a new culture of lifelong learning
Lifelong learning can help to prevent skills from depreciating or becoming obsolete and facilitate transitions from declining jobs and sectors to new emerging occupations in a context of rapid technological change. The importance of lifelong learning is further reinforced by population ageing, which increases the need for individuals to maintain and update their skills over longer working lives (OECD, 2019b). This will be especially important in Belgium, where the success of recent pension reforms, such as the tightening of early retirement conditions and the increase in the statutory retirement age, will depend on keeping older workers attached to the labour market.
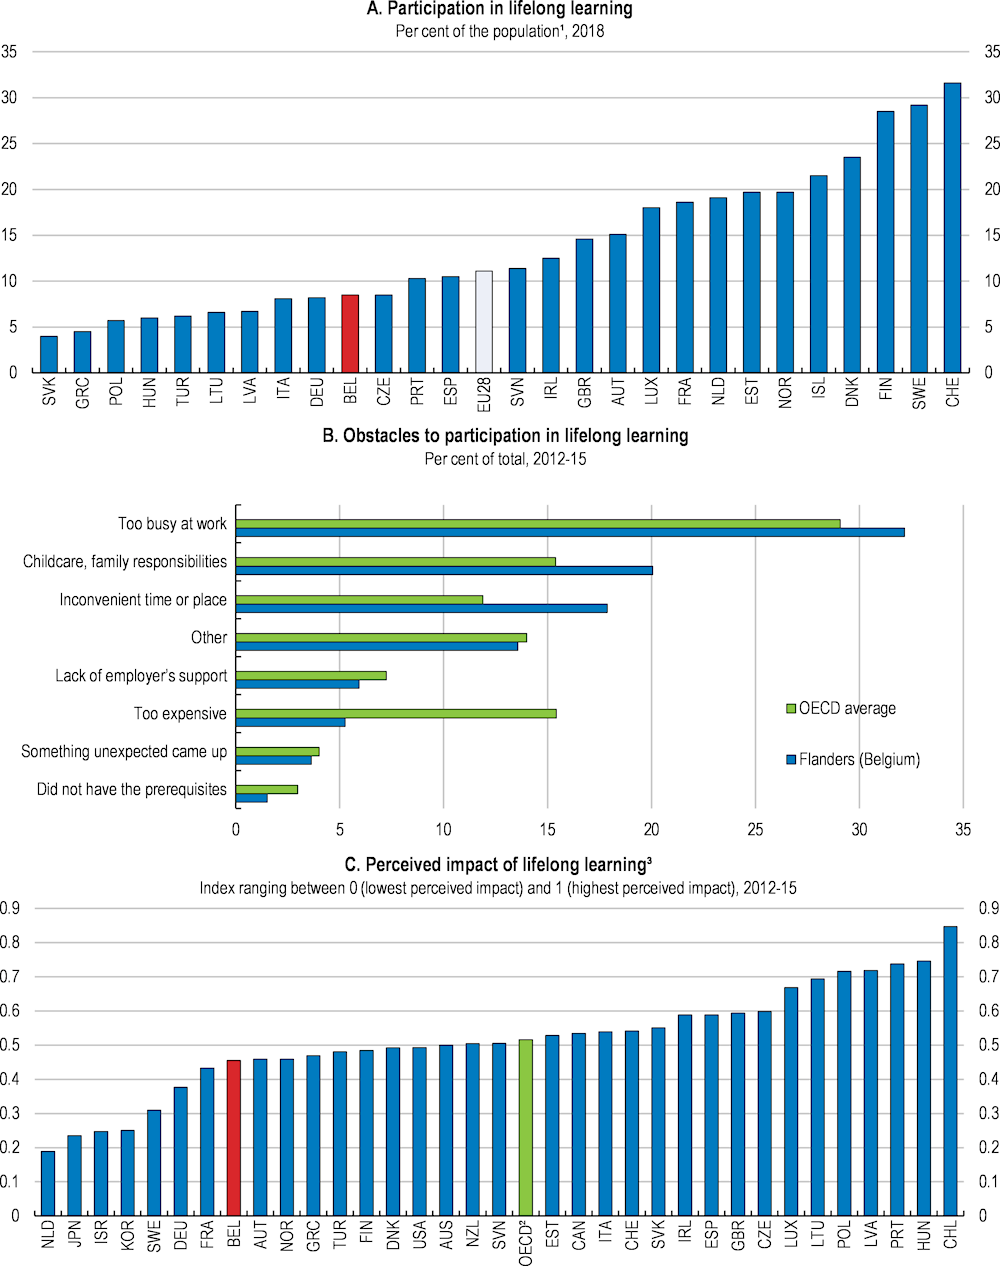
Participation in lifelong learning in Belgium, at 8.5% in 2018, is below the EU average of 11.1% and the EU average target of 15% set by the Education and Training 2020 framework (Figure 1.16, Panel A). In addition, there are strong regional differences, with Brussels’ participation rate of 12.6% nearly twice that of Wallonia at 6.7%. Time constraints due to work, competing family responsibilities and inconvenient time or place of adult education offers are cited as the most important factors limiting the participation of adults in Flanders, which are more widespread than in the OECD on average. While cost is also mentioned as an important barrier by some, in contrast to other OECD countries, this appears to be less of an issue in Flanders (Figure 1.16, Panel B).
Participation in adult learning can have an impact on many different outcomes, which are not always easy to measure. A new OECD indicator on the impact of adult learning focuses on four key outcomes, including self-reported satisfaction, skill use, labour market outcomes, and the wage returns of training participation. The indicator suggests that the perceived impact of adult learning is relatively low in Belgium (Figure 1.16, Panel C; OECD, 2019d).
Figure 1.16. There is room to improve lifelong learning policies
25-64 year-olds
1. Adults participating in education and training in the 4 weeks preceding the survey.
2. Unweighted average of 34 countries.
3. The indicator measures the perceived impact of participation in adult learning by focusing on 4 self-reported dimensions: usefulness of training, use of acquired skills, labour market outcomes and the wage returns of training participation.
Source: Eurostat (2019), Adult learning statistics, Eurostat Database; OECD (2019), OECD Skills Strategy Flanders, OECD Publishing, Paris; OECD (2019), Getting Skills Right: Future-Ready Adult Learning Systems, Getting Skills Right, OECD Publishing, Paris.
There are also significant disparities in participation in lifelong learning by individual characteristics. The participation rate of low skilled adults is around 38 percentage points lower than that of the high-skilled (Figure 1.17, Panel A). They also face different barriers, with the low-skilled citing a lack of time due to child care or family responsibility and the high-skilled being too busy with work. This suggests that policy interventions may have to focus on different obstacles for different groups (OECD, 2019e). Seniors’ participation in training is 30 percentage points below that of their younger counterparts (Figure 1.17, Panel B). Finally, despite being more willing to attend training, the participation of temporary workers is over 15 percentage points less than that of full-time permanent workers, which is one of the highest relative differences in the OECD (Figure 1.17, Panel C).
A number of measures have been taken recently to increase participation in lifelong learning. For example, in 2018, reforms of paid educational leave, which requires that every employee in the private sector will have 125 hours annual paid leave for education, were introduced in Flanders, as well as a new decree to boost recognition of prior learning (OECD, 2019e). The French speaking community passed a decree in 2017 to harmonise valuation practices within educational institutions and to promote the recognition of prior learning, with an aim to increase the participation rate of adults in lifelong learning. In the Brussels-Capital Region, reforms have improved the validation of skills acquired outside conventional training pathways.
Nevertheless, there remains considerable scope to increase participation in lifelong learning. At the federal level, the training system was changed in 2017 from requiring that firms devote 1.9% of their payroll to lifelong learning programmes to instead providing at least five days of training on average per year. In the short term, the priority should be to ensure that the law is effectively implemented and enforced, as recommended in the 2017 Economic Survey of Belgium. However, this set-up does not guarantee that the workers who need it the most will get training, since the requirement is at the firm rather than individual level. Hence, a good first step would be to ensure that the entitlement applies to each individual worker, rather than all employees on average.
In the long term, a number of changes to the system can ensure that workers get training in the right areas to boost their skills relevant to the labour market. First, collection of high quality skills assessment and anticipation information to identify current and future skill needs is key. Second, this information can be used to provide guidance to workers and employers, set targeted incentives for them, and offer training options that are in line with skill needs (OECD, 2019d). Finally, in order to ensure access to the relevant training for all workers and keep track of all the training and qualifications of the worker, which could be useful as they change jobs, individualised training allowances could be introduced.
The introduction of individualised training allowances should be accompanied by high quality training provision in areas of skill needs and most importantly individual guidance on the choice of training programmes. To ensure that these training allowances are genuinely used for training that will increase the skills of the worker, the individual allowances could be established in monetary terms instead of hours, as was done in France in 2018. As the cost of training is lower for low-skilled workers, monetary entitlements can enable them to get more training (OECD, 2019f). In addition, targeted support, such as higher training time and/or funding requirements, could be introduced for disadvantaged workers, as is already the case for some training measures in Flanders.
Figure 1.17. Despite their willingness, training opportunities are limited for some disadvantaged groups
2012-2015
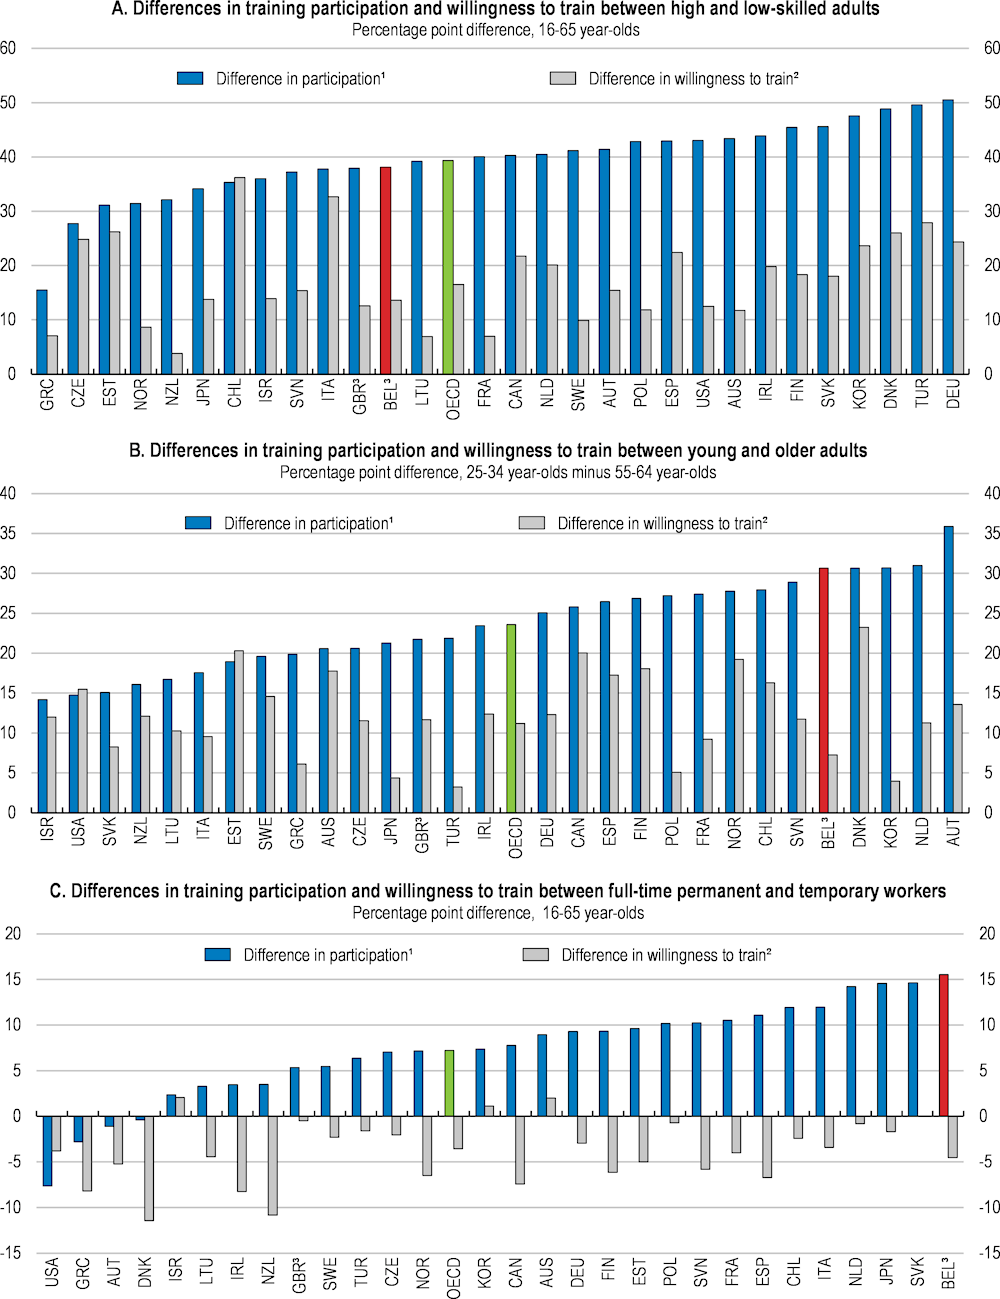
1. The difference in participation is the percentage point difference in the share of adults who participated in training over the previous 12 months. Positive values indicate that high-skilled adults participated in training more than low-skilled adults (Panel A), that younger adults participated in training more than older adults (Panel B) and full-time permanent employees participated in training more than temporary ones (Panel C).
2. The difference in willingness to train is the percentage point difference in the share of adults who did not participate in training but would have liked to, according to answers to the PIAAC questionnaire.
3. The data are based solely on Flanders for Belgium and England and Northern Ireland for the United Kingdom.
Source: OECD (2019), OECD Employment Outlook 2019: The Future of Work, OECD Publishing, Paris.
To complement the greater access to training, which individualised options above would bring, and to help foster more of a learning culture amongst adults in Belgium, greater emphasis could be placed on public awareness campaigns. However, when such programs have been implemented in many OECD countries, they have often proved ineffective in reaching out to the low-skilled (European Commission/EACEA/Eurydice, 2015; OECD, 2019g). To address this challenge, several countries have started to put in place more proactive initiatives to reach the low-skilled in the particular workplaces, kindergartens, schools, public spaces and other places they are more likely to frequent regularly (OECD, 2019g). For example, in 2017, the city of Brussels launched a mobile information centre (Formtruck) to engage low-qualified and young job-seekers in adult learning (OECD, 2018a).
Labour market reform to boost employment and productivity
Better targeted activation policies to combat job displacement
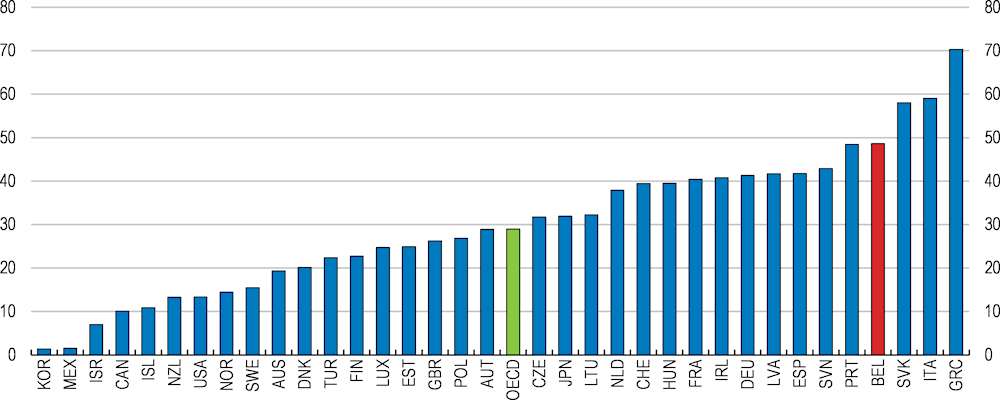
The share of long-term unemployed in total unemployment is high, at around 50% (Figure 1.18). This highlights the potential for active labour market policies (ALMPs), which provide counselling, training support and other re-employment assistance, to help displaced workers match to jobs. International evidence demonstrates that well-designed and targeted activation measures can increase the employability of job-seekers in a cost‑effective manner (OECD, 2015c). Such policies will become increasingly important with the changing nature of work and the continuing digitalisation of the economy. In addition, reforms to enhance labour market flexibility and create more opportunity for transitions from unemployment or inactivity to work (see below) would increase the need for effective ALMPs.
Figure 1.18. The incidence of long-term unemployment is high
Unemployed by more than 1 year as a percentage of total unemployment, 2018
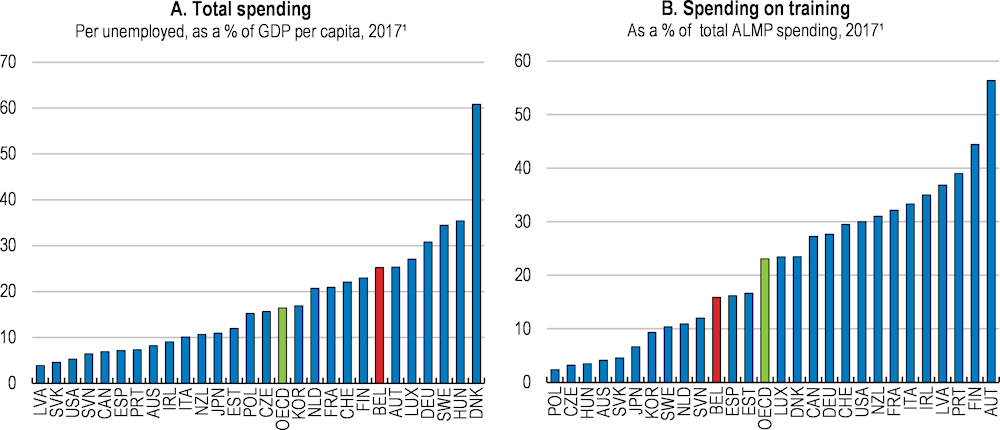
ALMP spending per unemployed, as a percentage of GDP per capita, is 25% in Belgium, above the OECD average of around 16% (Figure 1.19, Panel A). Following the sixth state reform in 2011, ALMPs are largely the responsibility of regions. Aside from the federal employer social security contribution reductions for low-wage employment, support exists in each region for certain groups of jobseekers, in the form of reductions in employer social security contributions and work allowances. In addition, individualised guidance or coaching is available to jobseekers. Nonetheless, spending on activation policies remains below that of Denmark and Germany.
There is scope to increase public expenditure on training, which at 0.15% of GDP in 2016, is around the OECD average, but well below that in neighbouring countries. Furthermore, as a share of total ALMP spending, spending on training is relatively low in Belgium, at approximately 15% compared to the OECD average of 23% (Figure 1.19, Panel B). There is significant international evidence that resources devoted to training have raised both the employability of individuals and the quality of their jobs in the medium and long-term (Card et al., 2018; Wulfgramm and Fervers, 2013). Benefits are likely to be large in Belgium, where low skills are a large barrier to employment (Hijzen et al., 2020). Any increase in public expenditures on training should, however, initially aim to improve the skills of those with lower educational attainment and go hand in hand with efforts to foster an improved culture of lifelong learning, as discussed above.
Figure 1.19. The share of ALMP spending on training is relatively low
1. 2015 for Italy and 2016 for New Zealand.
Source: OECD (2019), Statistics on Labour Market Programmes (database).
Given the significant disparities in labour market outcomes in Belgium, the benefits of public employment services (PES) making greater use of statistical profiling tools, are likely to be significant. This is because more costly and intensive services can be better targeted at jobseekers who are more at risk of becoming long-term unemployed, interventions can be made at an earlier stage, and services can be tailored more closely to the individual needs of jobseekers. Statistical profiling tools rely on a statistical model to predict labour market disadvantage as opposed to rule-based profiling, which uses eligibility criteria, or caseworker-based profiling, which relies more on judgement, to classify jobseekers into client groups. As the availability of real-time data has increased, together with the necessary computing power, the use of statistical profiling tools has become more widespread across the OECD (Desiere, Langenbucher and Struyven, 2019; Box 1.5).
Box 1.5. Statistical profiling in Austria
The statistical profiling tool of the Austrian public employment services (AMAS) consists of two functions and predicts the likelihood of re-employment among unemployed jobseekers in the short and long-term with a very high level of accuracy. The short-term function assesses the probability of moving into unsubsidised employment for a duration of at least three months within the first seven months after the start of unemployment.
The long-term function estimates the probability of moving into unsubsidised employment for at least six months over 24 months. Clients are then assigned to three different client groups: high, medium and low chance of labour market reintegration. The model relies on administrative data sources only. It makes use of socio-economic variables (gender, age, nationality), information on job readiness (education, health limitations, care responsibilities), and opportunities (regional labour market situation). An important feature is the use of detailed labour market histories for each jobseeker, including on prior work experience (type and intensity), frequency and duration of unemployment, and past participation in active labour market programmes.
Source: Desiere, S., K. Langenbucher and L. Struyven (2019), “Statistical profiling in public employment services: An international comparison”, OECD Social, Employment and Migration Working Papers, No. 224, OECD Publishing, Paris.
Statistical profiling tools are not widely used in Belgium. However, as part of a new contact strategy that has been rolled out in October 2018, the Flemish Public Employment Service has developed a statistical profiling model, called “Next Steps”, which estimates the probability of being unemployed for a period of greater than 6 months. The model uses a modern machine-learning algorithm and exploits multiple sources of information such as jobseekers’ socio-economic characteristics, labour market history and “click data”, which monitors jobseekers’ activity on the PES website in order to account for job search behaviour and motivation. The contact strategy aims to reach and screen all new jobseekers within six weeks after registration at the PES. Counsellors develop tailor made activation programmes to those identified as high-risk jobseekers by the profiling model (Desiere, Langenbucher and Struyven, 2019).
Greater use of statistical profiling tools to identify those at the risk of becoming long-term unemployed, such as the “Next Steps” model, should be made in all regions in Belgium. Synerjob, a joint organisation of the regional public employment services, would provide an excellent avenue through which the outcomes of implementing “Next Steps” in Flanders could be shared. This innovative profiling tool could also be further enhanced, for example, by adding more behavioural information to the model using a short online questionnaire to capture jobseekers’ motivation and self-reliance.
Promoting labour market flexibility through sound regulation
The Belgian labour market shows signs of rigidities with few workers moving between firms and long job tenure rates. On one hand, employment protection legislation provides a degree of worker security encouraging employees to invest in firm-specific expertise and employers to invest in their staff, which can boost innovation (Belloc, 2019; Kleinknecht et al., 2014). On the other hand, a more efficient allocation of labour can enhance productivity growth and improve innovation by increasing the willingness of firms to take more risks (Bartelsman, Gautier and De Wind, 2016) and facilitating the diffusion of new technologies and ideas to firms by new workers. Furthermore, with higher labour market mobility, flows into and out of unemployment are typically higher, while the average unemployment duration is lower (Cournede, Denk and Garda, 2016).
The stringency of protection for regular contracts against individual dismissals in Belgium is around the OECD average (Figure 1.20, Panel A). The reason that the OECD indicator is not lower for Belgium is, primarily, for two reasons. First, the employer can choose either a notice period or severance pay, which makes job protection lighter for regular contract workers against individual dismissals. However, both notice periods and severance pay are relatively high, at 3.5 months and 3.5 times the monthly wage, with 4 years of job tenure, respectively. This compares to France, for example, where, for the same job tenure, the notice period is higher than the severance pay requirement, at 2 months and 1 monthly wage, respectively. The second reason is the lack of probationary periods for workers on regular contracts (OECD, 2019a), although this is to some degree compensated for by reduced notice periods for very short job tenures (1 week for job tenure of 3 months or less).
With respect to employment protection for regular contracts against collective dismissals, Belgium has the second most stringent legislation in the OECD (Figure 1.20, Panel B). In Belgium, these regulations apply to firms with more than 20 workers that dismiss between 10 and 30 workers within a period of two months depending on firm size, and the difference in stringency between individual and collective dismissals is particularly high.
The stringency of collective dismissals is due to several features. First, in the event of a collective dismissal, two notifications are required. The first notification goes to staff representatives and the public authorities, and must be followed by a consultation procedure. This procedure is lengthy and involves significant legal uncertainty as the law is not clear when the consultation is closed, meaning employees can easily challenge the notification procedure. The firm may send the second notification to the public authorities with details on the planned redundancies only when the consultation is closed and no dismissals can occur in the 30 to 60 days after the second notification is issued. Second, alternatives to a dismissal need to be considered before a collective dismissal to show that the dismissal cannot be avoided. Finally, as opposed to individual dismissals, where the employer can choose between a notice period and severance pay, dismissed workers are eligible to both a notice period and compensation in the case of collective dismissals.
To facilitate greater labour market flexibility employment protection against collective dismissals could be reduced in a variety of ways, as recommended in the 2019 OECD In‑Depth Productivity Review of Belgium. Setting explicit criteria in the law or involving a third party, such as a social mediator, could help to clarify the end of the consultation procedure. Another option would be to simplify the two-step notification procedure so that it becomes more similar to the procedures in Germany and the Netherlands, where only one notification is required. New forms of collective contract termination, mutually agreed by the firm and workers, such as the one adopted in France in 2017 (“rupture conventionnelle collective”), could also be used (OECD, 2019a).
Figure 1.20. Employment protection against collective dismissals is relatively strong
Employment protection legislation indicators for workers in regular employment¹
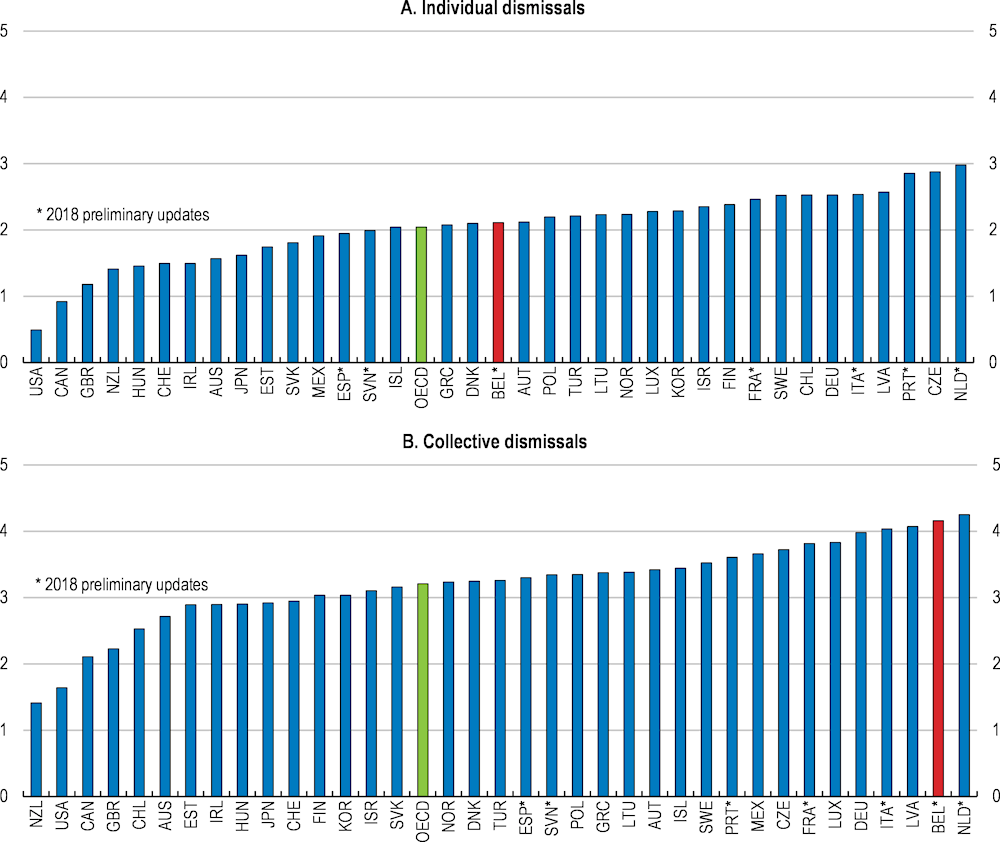
1. The data for most countries refer to 2013, the latest year in the database. The data for the United Kingdom refer to 2014 and for Lithuania to 2015. The data for Belgium, France, Italy, the Netherlands, Portugal, Slovenia and Spain are preliminary updates for 2018. The indicator for collective dismissals assumes that the range of the indicator for specific requirements for collective dismissals is 40% of that of the indicator for individual dismissals, to match the current joint indicator for individual and collective dismissals. The range for individual dismissals is 0-6 and for collective dismissals 0-8.4. The OECD number is the unweighted average of all 36 OECD countries. See OECD (2019a), In-Depth Productivity Review of Belgium for more details.
Source: OECD estimates based on the OECD Employment Protection Legislation Database.
Enhancing links between wages and productivity at the firm and worker level
A number of institutional design features can affect incentives of workers and firms with implications for reallocation and productivity. Among these, the collective bargaining system and seniority-based pay have been highlighted as two potential reform areas in the 2017 Economic Survey of Belgium and the 2019 In-Depth Productivity Review of Belgium.
The wages of older white-collar workers are relatively high compared to those of the young in Belgium, which can reduce the employability and job mobility of older workers. It will be important to ensure that senior workers can maintain their attachment to the labour market for success of pension reforms. While other factors such as lifelong learning will also play a role, reducing the steepness of seniority-based wage profiles through the tri-partite wage bargaining process can also help. In this regard, the forthcoming report by the Central Economic Council on this issue is welcome.
Belgium has a high degree of both wage centralisation across firms and wage coordination across sectors. Such wage bargaining systems have been linked to higher employment, and lower wage inequality on one hand and lower productivity growth on the other (OECD, 2018b). In principle, wage coordination should allow for a better alignment of wages and macroeconomic conditions, contributing to resilience and adaptability. It will be important to assess to what extent the reform of the wage setting system in 2017 contributed to international competitiveness, as recommended in the 2017 Economic Survey of Belgium.
There could be a need for introducing more flexibility into the wage setting mechanism at the micro-level, while preserving the integrity of sector-level bargaining. This can be achieved by allowing the sectoral framework agreement to leave space for some adaptation at the firm level, as is the case in Austria, Denmark, Germany, the Netherlands, Norway and Sweden, which are classified as organised decentralised and coordinated systems (OECD, 2018a; 2019a). For example, the possibility of opt-outs are utilised in Austria and Germany, but rarely in Belgium. Given the relatively high levels of trade union membership and the strong role for social partners in the wage setting process in Belgium, the approach could be similar to that taken in the Nordic countries. In Denmark and Sweden, leaving the application of the favourability principle, which allows for departing from regulations in the employee’s favour under the terms of the contract of employment, to social partners is used to increase the flexibility of the system and allow for a stronger link between wages and firm performance.
For a tax and benefits system that is fair and incentivises work
Inclusive social protection that encourages work
Unemployment benefits
The optimal design of unemployment benefits over the unemployment spell has been the subject of intense debate in Belgium, resulting in an important reform in 2012 that extended the number of workers facing declining unemployment benefit (UB) schedules and made the decline steeper (Box 1.6). A well-designed UB system needs to strike the right balance between providing effective protection against income losses and maintaining incentives to work throughout the unemployment spell. This will depend on its coverage, the level and financing of benefits over the unemployment spell and the interaction of the system with other tax and benefit policies.
Box 1.6. The schedule of unemployment benefits in Belgium
A reform implemented in 2012, with the aim of increasing the incentives to work for the long-term unemployed, extended the number of workers facing declining UB schedules and made the decline steeper. For many workers, this was achieved by increasing the replacement rate for the first few months (from 60% to 65% of recent earnings), while decreasing the effective replacement rates later in the spell. The reform made the long-term level of the UB independent of previous earnings for all unemployed (before the reform, this was already the case for long term cohabitants), therefore moving towards a system aiming to provide a minimum level of income over the long-term, rather than smoothing income variations per se.
Figure 1.21 illustrates the main implications of the reform using a specific example (a single earner couple with two children) for workers with different contributions (6 and 21 years). Before the reform, the UB settled at its long-term level at 12 months for both workers. After the reform, they both receive higher UB in the short term, but they also face more frequent changes (at 3, 6 and 12 months). Eventually, for both work histories, the UB converges to the same replacement rate, but the speed of this convergence is faster for the worker with the shorter work history.
Figure 1.21. Unemployment benefit schedule over the unemployment spell
% of the previous wage for a worker on low-pay in a single-earner couple with two children¹
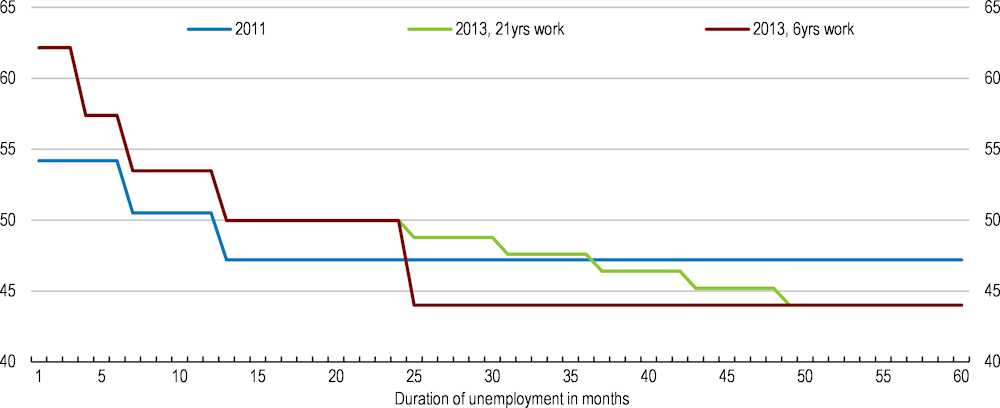
1. The figure shows the evolution of net UB levels over 60 months (before and after the reform) for a worker on low pay (67% of the year-specific average wage) who is the sole earner of a couple with two children. Two work history profiles are considered, one for a worker with 21 years of contributions and one with 6 years. For comparability across time, the UB levels are presented as a fraction of the previous wage.
Source: Hijzen and Salvatori (2020), OECD calculations based on the OECD's TaxBEN model.
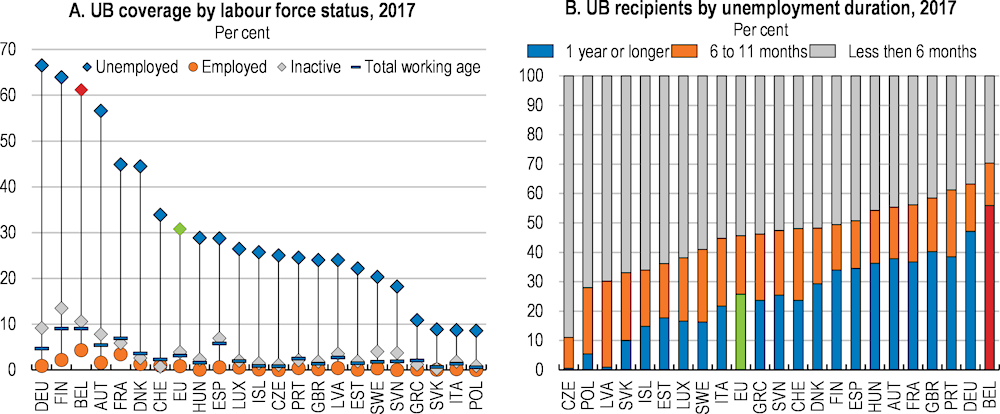
The OECD Jobs Strategy recommends that reaching a high coverage of unemployment and other out-of-work benefits, provided mutual obligations are enforced, plays a pivotal role in the success of activation strategies (OECD, 2018a). Unemployment benefit coverage in Belgium is high, with coverage among the unemployed in 2017 at over 60%, more than double the EU average (Figure 1.22, Panel A). In addition, coverage is high for all durations of unemployment, particularly for the long-term unemployed, who account for about 55% of total UB recipients. Such a share is close to that in Germany (47%), and well above the EU average of 26% (Figure 1.22, Panel B). To some extent, this reflects the fact that Belgium offers time-unlimited access to unemployment benefits (linked with active job search), while in many other countries, there is a switch to means-tested social-assistance when UB entitlements are exhausted.
Figure.1.22. Unemployment benefit coverage is high
Belgium also has a high UB coverage among employed and inactive workers. Among the employed, this largely reflects part-time workers who can in some cases combine partial unemployment benefits (Allocation de Garantie de Revenus, AGR, or Inkomensgarantieuitkering, IGU) and work. These benefits ensure that working part-time yields a net income that is equal or higher than full unemployment benefits. Among inactive UB recipients, over 70% are not readily available for work, while the other 30% are “discouraged” workers who are available to work but are not actively searching (Hijzen and Salvatori, 2020). Both groups of inactive benefit recipients are likely to require tailored support to overcome barriers to employment to increase their work availability (e.g. child-care services), work readiness (e.g. training) and the effectiveness of their job search (e.g. job-search assistance) (Hijzen et al., 2020), which are discussed elsewhere in the survey.
Net replacement rates for low-paid workers are higher in Belgium than on average in the OECD, with the difference growing over the first year of unemployment (Figure 1.23), partly reflecting the time-unlimited access to unemployment benefits. Compared with neighbouring countries with long-lasting unemployment benefits, however, the Belgian system does not stand out as particularly generous, although this depends upon family type.
Figure 1.23. Net replacement rates are relatively high, particularly for the long-term unemployed
Proportion of previous in-work household income maintained after a certain period of unemployment¹, 2018
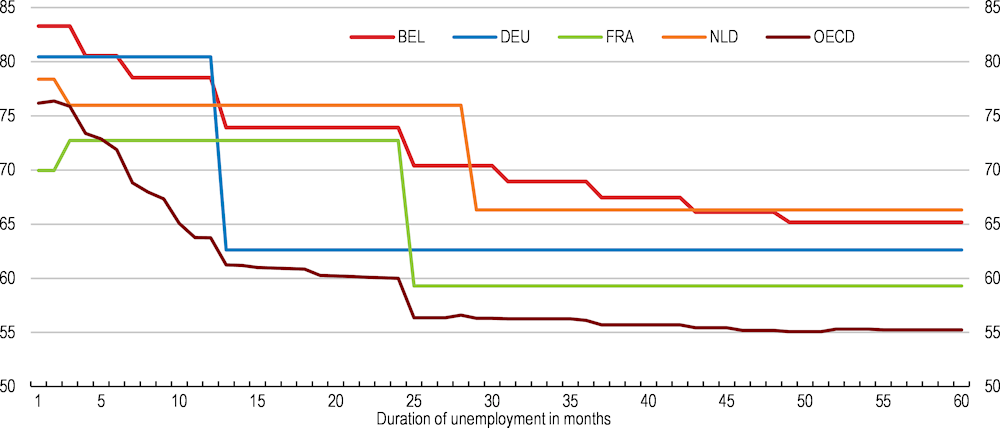
1. Net replacement rates refer to the net household income during unemployment as a fraction of total net household income before unemployment. Household income during unemployment includes unemployment insurance, unemployment assistance, family benefits, social assistance and housing benefits. The net replacement rates are computed for households where one adult aged 41 and with full working history becomes unemployed and their previous earnings equal 67% of the average wage. They are an average across six family types: single, single earner couple and dual earner couple (all with and without children).
Source: Hijzen and Salvatori (2020), OECD calculations based on the OECD's TaxBEN model.
Relatively high replacement rates for the unemployed (and formerly low paid workers) translate into relatively high levels of income adequacy, which refers to the household income during unemployment as a percentage of the median disposable income (Figure 1.24). This is the case for all unemployment durations and for most household types, with some notable exceptions. For instance, the net household income of a low-paid person with a dependent partner who has been unemployed for a very long time is well below the poverty line (50% of median income). Large differences in the net income position of the long-term unemployed across household types, after taking into account differences in household composition, are difficult to justify and should be avoided. This largely results from the fact that the long-term level of the unemployment benefit is flat and only varies across three broadly defined household types.
To ensure that the long-term level of support for the unemployed reflects household needs more closely, most OECD countries limit the duration of unemployment insurance benefits, while allowing the unemployed to move to either means-tested unemployment-assistance or social-assistance programmes after their expiration. Similarly, Belgium should switch from flat benefits to means-tested benefits for the long-term unemployed, which could be implemented in either way. The main advantage of introducing means-testing within the current UB system would be that they can continue to benefit from the activation system that comes with UB. Alternatively, social-assistance systems could be extended, by treating all persons living in poor households – whether long-term unemployed or inactive – in the same way. This would imply treating income support for the long-term unemployed in poor households as a social policy issue that is financed through general taxation rather than social security contributions.
Figure 1.24. High income support for low-wage workers tends to be associated with high participation tax rates
Average across six family types¹, 2018
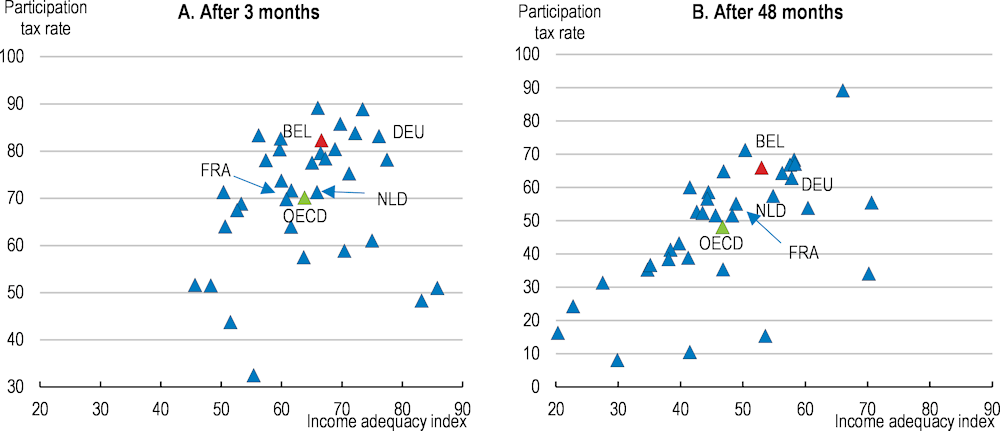
1. Income adequacy refers to the household income during unemployment as a percentage of the median disposable income. Participation tax rates refer to the fraction of additional gross earnings lost to either higher taxes or lower benefits when a jobless person takes up employment. The indices are computed for households where one adult aged 41 and with full working history becomes unemployed and their previous earnings equal 67% of the average wage. The indices are an average across six family types: single, single-earner couple and dual-earner couple (all with and without children).
Source: Hijzen and Salvatori (2020), OECD calculations based on the OECD's TaxBEN model.
Irrespective of the way means-testing is introduced, it is important to note that this would inevitably cause some UB recipients to lose income support. This is likely to be the case for the unemployed who are in households with other sources of income, such as those with a working partner, or those who have assets or savings, such as some older workers with long work histories. In addition, public employment agencies should continue their relationship with those in need of activation. The associated cost savings could be used to strengthen work incentives by lowering social security contributions for unemployment insurance or to further invest in activation support.
The relatively generous income support for the jobless (for most household types) tends to lower work incentives. As of January 2018, the participation tax rate, the share of additional earnings from work that is lost due to reduced benefits and increased taxes for workers with low wage (in previous and new job), was 82% after 3 months and 66% after 4 years of unemployment, higher than the OECD averages of 70% and 48%, respectively. The recent tax shift will have further reduced the participation tax rate for low-wage workers. Computations from the Belgian government, based on different assumptions on family types and unemployment benefits, suggests that accounting for all the effects of the tax shift, for a long-term unemployed who finds low-paid employment, the participation tax rate has been reduced by over 10%. These effects will be higher for workers whose re-employment wages might be lower than their previous one, which is often the case for reasons such as skill depreciation due to long spells of unemployment, employer discrimination against the long-term unemployed or a deterioration of the business cycle (Jacobson et al., 1993; OECD, 2013a).
There is scope for Belgium to reduce work disincentives, in particular for the long-term unemployed, while maintaining or even increasing the current level of income support. For example, 48 months into the unemployment spell, the Netherlands offers approximately the same level of income support as Belgium, but with lower participation tax rates. Germany has broadly similar participation tax rates, but a higher level of income support.
Belgium has already taken steps to increase work incentives for low-earners through the “tax shift” since 2016 that fully came into effect in 2019. Further improvements in work incentives could be pursued through additional measures to make work pay, in line with the shift in emphasis towards supporting those in work that has taken place in many OECD countries in recent years (Causa and Hermansen, 2017). One option is to extend to full-time workers with low earnings the possibility to cumulate unemployment benefits and income from work, building on the existing scheme for part-time workers (Allocation de Garantie de Revenus, AGR, or Inkomensgrantieuitkering, IGU). Alternatively, Belgium could consider the introduction of in-work benefits, like the long-standing Earned Income Tax Credit in the US or the Prime d’activité in France (Carcillo et al., 2019).
In the adoption of these reforms to make work pay, it is important to make sure that the measures are sufficiently well targeted at low-wage workers, both to limit their fiscal costs and to reduce the risk that employers capture some of these benefits. To the extent that wage floors – whether in the form of the statutory minimum wage or collectively agreed sectoral wage floors – are binding for low-wage workers, the risk that firms capture the benefits of well-targeted make-work-pay measures through bargaining is limited in Belgium.
One aspect of the 2018 “Jobs Deal” reform package, which comprises 28 measures to improve the functioning of the labour market and increase employment, proposed further reform of the UB system, but was not implemented. The proposal included further frontloading UB by raising its level in the first 6 months of unemployment and adapting the timing of stepwise declines or their corresponding levels of UB. However, the final level of the UB, occurring at the latest 48 months into the unemployment spell, would not be changed.
Evidence from Hungary suggests that reforms that frontload unemployment benefits can reduce unemployment and be revenue neutral, despite the increase in the level of unemployment benefits in the short term (Lindner et al., 2016; DellaVigna et al., 2017; Box 1.7). However, this does not necessarily imply that making UB steeper is socially desirable since the increase in the outflow rate from unemployment may in part reflect greater financial distress among the unemployed.
The social desirability of declining unemployment benefits over the spell depends on whether the cost in terms of lost income (and consumption) by the long term unemployed is offset by an increase in the entry rate into employment as a result of stronger work incentives. Whether this happens or not depends crucially on how the unemployed at different points of the unemployment spell respond to changes in income and financial incentives. Recent evidence from Sweden and Spain suggests that the long-term unemployed are less responsive to financial incentives than the short-term unemployed, weakening the case for declining benefit schedules (Campos, García-Pérez and Reggio, 2017; Kolsrud et al., 2018). Hence, to gain insights on how the unemployed respond to changes in the UB schedule in Belgium and help shape the national debate on this issue, an in-depth evaluation of the 2012 reform that increased the degressivity of UBs over time is needed.
Box 1.7. Frontloading unemployment benefits: Evidence from Hungary
In 2005, Hungary implemented a reform that frontloaded unemployment benefits. The amount paid over the first 90 days was increased, while that in the subsequent 180 days was reduced and the lower level beyond 270 days was left unchanged. The reform therefore resulted in a new step decline at 90 days and a reduced step decline at 270 days.
Evaluations of the reform suggest that the steeper decline in the time profile of unemployment benefits reduced unemployment (Della Vigna et al., 2017) and was revenue neutral despite the initial increase in benefits (Lindner et al., 2016). More specifically, Della Vigna et al. (2017) find that, following the reform, flows out of unemployment spiked around the 90-day threshold and then converged to their pre-reform levels later in the spell. These findings could be explained by workers’ “reference-dependent” preferences that adjust over time. Workers who become unemployed initially search intensively in an effort to restore income and consumption to the level when working. However, as they get used to the lower level of income and consumption when unemployed, they gradually lower their job-search intensity.
Pensions
Alleviating risks of old-age poverty can be particularly challenging for workers engaged in non-standard forms of work or the self-employed. For example, these workers may make low levels of pension contributions over time or have prolonged periods where they make no contributions at all (OECD, 2019b).
Several different minimum pensions exist in Belgium, including pensions for salaried and self-employed workers and the minimum right per career year for salaried workers only. Those who benefit from these receive pension benefits that exceed regular earnings-related pension benefits. For the minimum right per career year, the minimum contribution period that is required is 15 years of at least one third of a fulltime equivalent year. The minimum pension of the public sector requires 20 years of service. In the case of minimum pensions, the minimum contribution period that is required is relatively high (Figure 1.25) and may be challenging to meet for some, particularly those with unstable careers. Belgium has relatively good levels of non-contributory pensions, which are pensions not linked to contributions one makes over their working lives (OECD, 2019b). However, a reduction in the number of career years required to gain a minimum pension could further minimise the chance of poverty in old-age for non-standard workers.
Despite recent reforms of social protection of the self-employed, there remain some important differences in terms of access to pensions between employees and the self-employed. While obligatory, contribution rates for the self-employed are lower, and the maximum pension available to them after a full career is considerably less than that of an employee (approximately EUR 1 650 versus EUR 2 500 per month in 2018). This maximum pension for the self-employed is also only slightly higher than the corresponding minimum pension (approximately EUR 1 250 per month in 2018). With first pillar pensions for the self-employed largely unrelated to previous professional income due to relatively low maximum pensions, there is little incentive to declare high levels of income. Instead, private saving for retirement, for example, through tax advantaged private pension products, may be more attractive. Compared to other OECD countries with voluntary pension systems, however, the amount of assets held in voluntary pension funds as a share of GDP is relatively low (Figure 1.26; OECD, 2018e).
Figure 1.25. Required contributions for minimum pensions may be hard to meet for workers with unstable careers
Required contributions in years¹
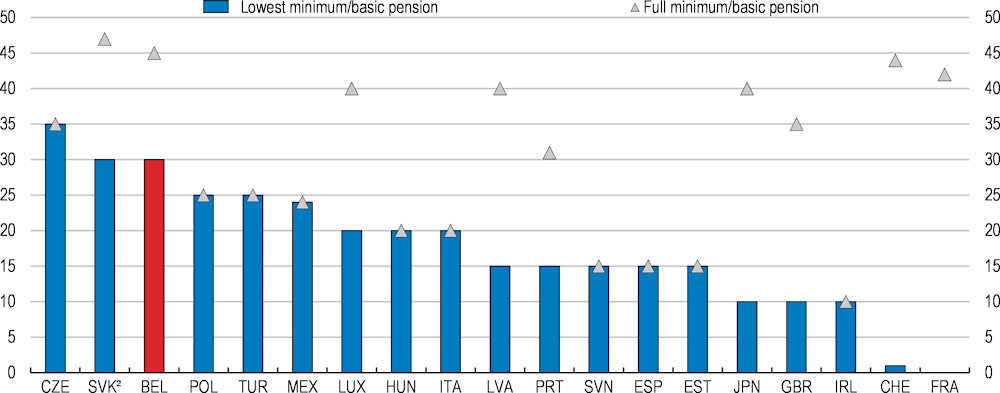
1. Data refer to minimum pension schemes, with the exception of Estonia, Japan, Ireland and the United Kingdom, where first-tier pension systems rely on basic pension schemes. Both minimum and basic pensions are paid in the Czech Republic and Luxembourg, where the corresponding contribution period for the basic pension is 35 years and 10 years, respectively. See OECD (2015) for details on the inclusion of credits in pension systems for unemployment and childcare across countries.
2. In the Slovak Republic, there is no upper limit for the minimum pensions as it increases with each additional contribution year.
Source: OECD (2019), OECD Employment Outlook 2019: The Future of Work, OECD Publishing, Paris.
The pensions system of the self-employed should be further aligned with that of dependent employees, for example through the harmonisation of contribution rates and pension calculations. Currently, a coefficient of harmonisation lowers the income of the self-employed before the pension calculation formula is applied. Further alignment of different schemes would help enhance social protection and reduce the risks of poverty in old age amongst this group. To assist with financing, clients of the self-employed could potentially be required to pay part of the pension contributions that are due for some categories of self-employed workers, as is the case in Austria, Germany, Italy and Portugal (OECD, 2019b). Changes to the second pillar of pensions for the self-employed could also help, to the extent that the objectives of this pillar are similar to those of the first pillar. For instance, most pension withdrawals are in the form of lump sums, however, a degree of annuitisation could provide benefits from a social protection standpoint. In addition, with around 50% of self-employed workers contributing to second pillar pension schemes, automatic enrolment with the ability to opt out, as is the case in New Zealand, could further increase participation.
Figure 1.26. Total assets in private pension funds
As a percentage of GDP, 2018¹
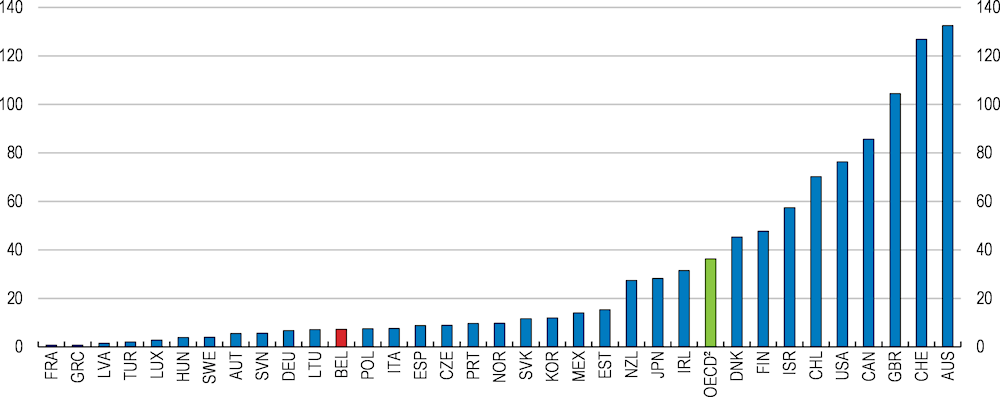
1. Data cover all funded plans (mandatory or voluntary, occupational or personal, for public or private-sector workers) that may be financed through pension funds, but exclude pension insurance contracts, employers' book reserves or other retirement vehicles. Preliminary data for 2018.
2. Unweighted average.
Source: OECD (2019), Pension Market in Focus, based on data collected from national pension authorities within the framework of the OECD Global Pension Statistics (GPS) project.
Sickness and disability benefits
Sickness and disability benefit systems should balance protection with work incentives to ensure the reintegration of sick workers, while restricting unwarranted inflows into these schemes. An effective system is essential as recent OECD analysis identifies health limitations as one of the major employment barriers in Belgium (Hijzen et al., 2020). Indeed, the share of disability benefit recipients is relatively high and has risen strongly in recent years (Figure 1.27, Panel A). Furthermore, an increasing share of the inactive population cites sickness and disabilities for the reason for inactivity (Figure 1.27, Panel B). In other countries, changes in other benefit schemes have resulted in the uptake of sickness and disability benefits because of the change in their relative attractiveness (Jousten et al., 2012). This could be part of the explanation for Belgium, where a number of reforms, including the gradual phase-out of early retirement schemes and the status of “older unemployed people” exempt from seeking work, have tightened conditions for other schemes.
Employers can play an important role in preventing long-term sickness absence and helping sick workers back into a job in the firm through a clear rehabilitation and return-to-work process (OECD, 2018a). Until recently, employers in Belgium were not obliged to ensure the reintegration of employees on long-term sickness leave. However, two royal decrees in 2016 introduced a compulsory reintegration procedure by employers for employees on long-term disability leave. This is welcome as a focus on capacity to work is a key part of successful reform of these schemes. There are also some pilot projects to activate workers on sickness and disability benefits through the public employment services, which should be extended.
Figure 1.27. Inflows into disability and sickness benefit schemes should be monitored
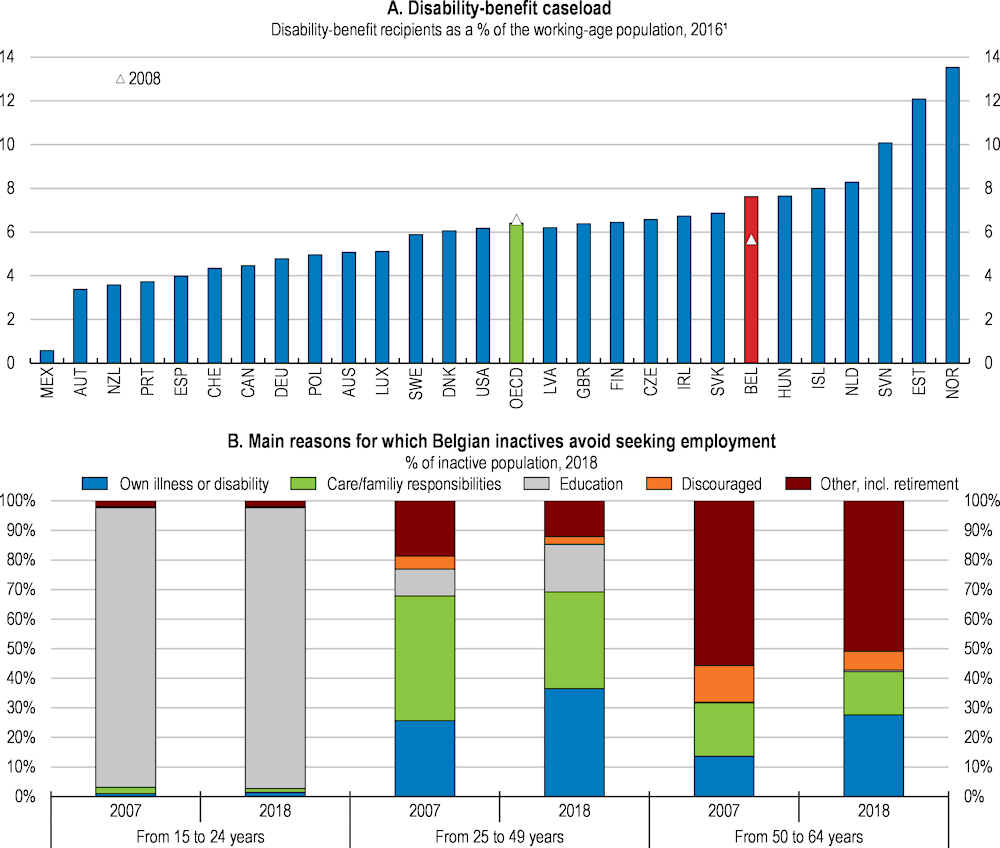
1. Or latest year available.
Source: OECD (2018), Good Jobs for all in a Changing World of Work, OECD Publishing, Paris; Eurostat (2019), Inactive population not seeking employment by sex, age and main reason, Eurostat Database.
While it is hard to fully assess the impact of these reforms yet, it will be important to monitor and evaluate the existing schemes regularly to ensure that the incentives for those with a partial ability to work are maintained. An initial assessment shows that 14% of those fulfilling their reintegration plan found another full-time job, but often the plans are abandoned, especially among older workers and those on invalidity benefits (Saks, 2017). Furthermore, the success of these reforms requires coordination between the employer, the employee and the consulting physician.
There are also some financial disincentives for single parents and to a lesser extent couples with children to start working after a period of long-term sickness and disability (Hufkens et al., 2017). In general, work incentives have been improved by a recent reform of sickness benefits. Hence, an evaluation of the existing schemes should pay particular attention to effects on different family types.
Legislative requirements in relation to the prevention of psycho-social risks are another important tool to protect workers from entering disability schemes (OECD, 2018a). In Belgium, the Well-Being at Work Act requires employers to draw up five-year prevention plans to address the problems identified by psycho-social risk assessments, establish annual action plans, and appoint a psycho-social prevention advisor to assist companies in implementing their risk prevention policy. However, evaluations suggest that the implementation of these obligations has so far been weak, reflecting a lack of awareness by employers and limited resources for prevention advisors (SPF Emploi, Travail et Concertation Sociale, 2011; OECD, 2013b).
Fair and efficient taxation
The taxation of labour and different tax treatment of standard and non-standard forms of work can have significant effects on both the level of employment and the allocation of work across different types of work as their relative prices are altered (OECD, 2019b). The tax burden on Belgian workers was the highest in the OECD in 2018 (Figure 1.28), and will remain high even after recent and ongoing reductions in labour taxation. This magnifies the potential for inefficient allocation of workers between differing forms of work due to differential tax treatment.
Figure 1.28. The tax burden on Belgian workers is high
Net average tax rate for a single worker at 100% of the average wage¹, as a % of the labour cost, 2018
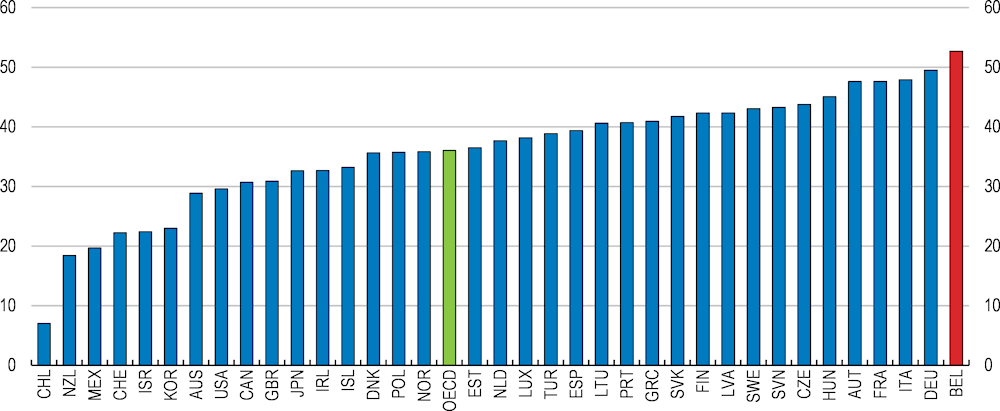
1. Including employee and employer social security contributions less cash benefits.
Source: OECD (2019), OECD Taxing Wages 2019, OECD Publishing, Paris.
As already discussed above, social security contributions are mandatory for the self-employed, but at somewhat reduced rates, and exemptions exist. Other possibilities exist for non-standard workers to benefit from reduced taxation and social security contributions in Belgium. One such avenue is through the Flexijob scheme. This scheme was introduced in 2015 in the hotel and catering sector, but has since been extended to additional sectors and pensioners, with a total of approximately 44 000 persons for which a flexijob spell has been registered during the first quarter of 2019.
The objective of the Flexijob system is to facilitate flexible labour during peaks of activity and reduce the wage cost of this flexible workforce. Flexijobs are only possible for workers already employed for at least 4/5 of a full-time job. It is not possible to perform a flexijob at an employer by whom the employee is already employed during that quarter for at least 4/5 of the time by another kind of employment contract. The flexijob salary of the employee is exempted from normal social security contributions and taxes, although the employer is required to pay a special contribution equal to 25% of the remuneration. Given the incidence of involuntary part-time employment is low in Belgium and those participating in flexijobs are already engaged in the labour market to a significant degree, the scheme may have little impact on activity or employment rates (EC, 2018).
Reduced taxation has also been introduced for workers who provide services up to a EUR 6 000 exemption threshold per year, including those through online (collaborative) platforms (i.e. transactions mediated by an app or a website that matches customers with service providers). The provision applies to platform workers, provided that the platform worker enrols on a platform and registers their activities. In order for the platform worker to benefit from the tax exemption, the platform needs to be formally recognised by the Belgian authorities, which comes with specific transparency requirements, but this is not compulsory (Basellier et al., 2018). The platform must share the income of the platform workers with the tax administration. Beyond EUR 6 000 per year, the platform worker must register as self-employed, which implies that he or she should also affiliate with the mandatory social security system for self-employed workers. The last restriction also applies for services provided informally without recourse to platforms.
In the case of both Flexijobs and the reforms relating to platform workers, an important benefit may be a reduction in informal work and an increase in the tax base. As the contribution of the sharing economy grows in Belgium, such benefits could be enhanced by making registration of platforms with the authorities compulsory. On the other hand, the Flexijobs scheme could be exploited by related companies seeking to minimise both employer and employee tax obligations. This could consequently erode the tax base, making monitoring of the scheme and appropriately penalising any such behaviour important. These workers could also not have access to collective bargaining and coverage of some labour law protections, which can adversely affect the dialogue between social partners. In order to limit distortions between different forms of labour, the tax treatment of different forms of work should be further aligned, by gradually phasing out tax deductions for non-standard workers.
Table 1.3. Recommendations on labour market challenges
|
FINDINGS (main in bold) |
RECOMMENDATIONS (key in bold) |
|---|---|
|
Enhancing skills for evolving labour market needs and digitalisation |
|
|
Participation in lifelong learning is low by older and low-skilled adults. Training requirements are at the firm level rather than the worker. |
Introduce individual training allowances and for disadvantaged workers, provide targeted support, such as higher training time and/or funding requirements. |
|
Digital skills are relatively weak for those with lower levels of education and income. |
Target training and education in digital skills to less-educated and low-income individuals, whose jobs might be at higher risk of automation. |
|
The proportion of students in vocational education and training programmes that combine school and work based learning is low. |
Assess and extend, where appropriate, financial incentives for dual learning, such as direct subsidies, for both firms and students. Introduce compulsory accreditation for companies offering vocational training and renewal of that accreditation. |
|
Labour market reform to boost employment and productivity |
|
|
The long-term unemployment rate is high and different groups face multiple employment barriers. |
Extend the use of statistical tools to identify job-seekers at risk of becoming long-term unemployed to develop tailor-made active labour market programmes. Improve the coordination between employment, health and education policies to help jobless individuals facing multiple barriers to employment. |
|
Despite relatively high levels of spending on ALMPs per unemployed, there is room to improve the allocation of ALMP spending. |
Increase spending on active labour market policies that is allocated to training. |
|
The labour market shows signs of rigidities with few workers moving between firms and long job tenure rates. |
Increase the flexibility of collective dismissals, for example by simplifying the two step notification procedure to one. Allow for more decentralisation of wage bargaining, within the framework of sector-level agreements, to better align wages with productivity at the level of the individual firm. |
|
Reforming the tax and benefits systems |
|
|
The design of the unemployment benefit system provides good income support, but may discourage job search. |
Increase work incentives for low-wage workers by introducing in-work benefits. Alternatively, extend the possibility to cumulate unemployment benefits and work income to full-time workers. Evaluate the 2012 unemployment benefit reform to assess how the benefit schedule over the unemployment spell can be improved. |
|
The system provides flat benefits to the long-term unemployed with potentially different household needs. |
For the long-term unemployed, use means-tested benefits rather than flat benefits. |
|
There is room to improve the fairness of the unemployment benefit system across income levels. |
Ensure that net replacement rate does not increase with the previous level of net income. |
|
The high contribution periods for minimum pensions are hard to meet for self-employed workers and workers without a full career. |
Lower required number of career years for receiving minimum pensions. |
|
The pension system remains complicated, with varying schemes for different workers. |
Harmonise contribution rates and pension calculations between the self-employed and employees. Consider partial annuitisation of second pillar pensions for the self-employed. |
|
The share of disability and benefit recipients is relatively high and increasing. |
Extend existing pilot projects to activate persons on disability and sickness benefits through the public employment services. Improve the effectiveness of policies assessing and preventing psycho-social risks. |
|
While differing tax treatment of standard and non-standard workers may help boost employment and flexibility in the short term, it may distort the allocation of labour in the long-term. |
Phase out gradually tax deductions that favour non-standard workers. |
References
Austrian Federal Ministry of Science, Research and Economy (2014), Apprenticeship: Dual Vocational Education and Training in Austria Modern Training with a Future, Federal Ministry of Science, Research and Economy, Vienna.
Autor, D., L. Katz and M. Kearney (2006), “The polarisation of the U.S. labour market”, American Economic Review, Vol. 96, No. 2.
Bartelsman, E., P. Gautier and J. De Wind (2016), “Employment protection, technology choice, and worker allocation”, International Economic Review, Vol. 57, No. 3.
Basellier, R., G. Langenus and L. Walravens (2018), “The rise of the sharing economy”, NBB Economic Review, September.
Belloc, F. (2019), “Institutional complementarities between labour laws and innovation”, Journal of Institutional Economics, Vol. 15, No. 2.
Bratberg, E. and Ø. Nilsen (1998), “Transition from school to work: Search time and job duration”, IZA Discussion Papers, No. 27.
Campos, R., J. García-Pérez and I. Reggio (2017), “Moral hazard versus liquidity and the optimal timing of unemployment benefits”, FEDEA Working Papers, No. 10.
Carcillo, S. et al. (2019), “Assessing recent reforms and policy directions in France: Implementing the OECD Jobs Strategy”, OECD Social, Employment and Migration Working Papers, No. 227, OECD Publishing, Paris.
Card, D., J. Kluve and A. Weber (2018), “What works? A meta-analysis of recent active labour market program evaluations”, Journal of the European Economic Association, Vol.16, Issue 3.
Causa, O. and M. Hermansen (2017), “Income redistribution through taxes and transfers across OECD countries”, OECD Economics Department Working Papers, No. 1453, OECD Publishing, Paris.
Cournède, B., O. Denk and P. Garda (2016), “Effects of flexibility-enhancing reforms on employment transitions”, OECD Economics Department Working Papers, No. 1348, OECD Publishing, Paris.
Desiere, S., K. Langenbucher and L. Struyven (2019), “Statistical profiling in public employment services: An international comparison”, OECD Social, Employment and Migration Working Papers, No. 224, OECD Publishing, Paris.
De Sloover, F. and Y. Saks (2018), “Is job polarisation accompanied by wage polarisation?”, NBB Economic Review, September.
DellaVigna, S. et al. (2017), “Reference-dependent job search: Evidence from Hungary”, The Quarterly Journal of Economics, Vol. 132, No. 4.
Deming, D. and L. Kahn (2018), “Skill requirements across firms and labour markets: Evidence from job postings for professionals”, Journal of Labour Economics, Vol. 36, No. 1.
Draca, M., R. Sadun and J. Van Reenen (2009), “Productivity and ICTs: A review of the evidence”, in C. Avgerou, R. Mansell and D. Quah (eds.), The Oxford Handbook of Information and Communication Technologies, Oxford University Press.
European Commission (2018), Country Report Belgium, Brussels.
European Commission/EACEA/Eurydice (2015), Adult Education and Training in Europe: Widening Access to Learning Opportunities, Luxembourg.
Fernandez, R. et al. (2016), “Faces of joblessness: Characterising employment barriers to inform policy”, OECD Social, Employment and Migration Working Papers, No. 192, OECD Publishing, Paris.
Gal, P., G. Nicoletti, T. Renault, S. Sorbe and C. Timiliotis (2019), “Digitalisation and productivity: In search of the holy grail: Firm-level empirical evidence from EU countries”, OECD Economics Department Working Papers, No. 1533, OECD Publishing, Paris.
Garda, P. (2016), “The ins and outs of employment in 25 OECD Countries”, OECD Economics Department Working Papers, No. 1350, OECD Publishing, Paris.
Goos, M. et al. (2013), “High-technology employment in the European Union”, KU Leuven VIVES, Leuven.
Goos, M. and A. Manning (2007), “Lousy and lovely jobs: The rising polarisation of work in Britain”, The Review of Economics and Statistics, Vol. 89, No. 1.
Goos, M., A. Manning and A. Salomons (2009), “Job polarisation in Europe”, American Economic Review, Vol. 99, No. 2.
High Council of Employment (HCE) (2018), Immigrants Born Outside the European Union on the Belgian Labour Market, Brussels, October.
High Council of Employment (HCE) (2016), Économie Numérique et Marché du Travail, Brussels, June.
Hijzen et al. (2020), “Lowering employment barriers in Belgium and Norway”, OECD Social, Employment and Migration Working Papers, forthcoming.
Hijzen, A. and A. Salvatori (2020), “Designing fair and work-oriented unemployment benefits: The case of Belgium”, OECD Social, Employment and Migration Working Papers, forthcoming.
Hufkens, T. et al. (2017), “Fit for the labour market? An effort to reduce inactivity traps in the transition from benefit to work in the Belgian sickness and disability system”, University of Antwerp, Herman Deleeck Centre for Social Policy Working Paper, No. 11.
Jacobson, L., R. LaLonde and D. Sullivan (1993), “Earnings losses of displaced workers”, American Economic Review, 83 (4).
Jousten, A., M. Lefebvre and S. Perelman (2012), “Disability in Belgium: There is more than meets the eye”, in Wise, D. (ed.), Social Security Programs and Retirement around the World: Historical Trends in Mortality and Health, Employment, and Disability Insurance Participation and Reforms, University of Chicago Press, Chicago.
Kleinknecht A., F. van Schaik and H. Zhou (2014), “Is flexible labour good for innovation? Evidence from firm-level data”, Cambridge Journal of Economics, Vol. 38, Issue 5.
Kolsrud, J. et al. (2018), “The optimal timing of unemployment benefits: Theory and evidence from Sweden”, American Economic Review, Vol. 108.
Kuczera, M. (2017), “Striking the right balance: Costs and benefits of apprenticeship”, OECD Education Working Papers, No. 153, OECD Publishing, Paris.
Lindner, A. et al. (2016), “Frontloading the unemployment benefit: An empirical assessment”, IEHAS Discussion Papers, No. 1627.
Mühlemann, S. (2017), “The cost and benefits of work-based learning”, OECD Education Working Papers, No. 143, OECD Publishing, Paris.
Nautet, M. and C. Piton (2019), “An analysis of non-standard forms of employment in Belgium”, NBB Economic Review, June.
OECD (forthcoming), “Labour market transitions in Belgium”, Technical Background Paper.
OECD (2019a), In-Depth Productivity Review of Belgium, OECD Publishing, Paris.
OECD (2019b), Employment Outlook 2019: The Future of Work, OECD Publishing, Paris.
OECD (2019c), OECD Economic Outlook, 2019, Issue 1, OECD Publishing, Paris.
OECD (2019d), Getting Skills Right: Future-Ready Adult Learning Systems, OECD Publishing, Paris.
OECD (2019e), OECD Skills Strategy Flanders: Assessment and Recommendations, OECD Publishing, Paris.
OECD (2019f), OECD Economic Surveys: France 2019, OECD Publishing, Paris.
OECD (2019g), Getting Skills Right: Engaging Adults with Low Skills in Learning, OECD Publishing, Paris.
OECD (2018a), Good Jobs for All in a Changing World of Work: The OECD Jobs Strategy, OECD Publishing, Paris.
OECD (2018b), OECD Employment Outlook 2018, OECD Publishing, Paris.
OECD (2018c), Education Policy Outlook 2018: Putting Student Learning at the Centre, OECD Publishing, Paris.
OECD (2018d), OECD Jobs for Skills: Belgium Country Note, OECD Publishing, Paris.
OECD (2018e), OECD Pensions Outlook 2018, OECD Publishing, Paris.
OECD (2017a), OECD Employment Outlook 2017, OECD Publishing, Paris.
OECD (2017b), Economic Survey Belgium, 2017, OECD Publishing, Paris.
OECD (2015a), “Does having digital skills really pay off?”, Adult Skills in Focus, No. 1, OECD Publishing, Paris.
OECD (2015b), OECD Skills Outlook 2015, OECD Publishing, Paris.
OECD (2015c), OECD Employment Outlook 2015, OECD Publishing, Paris.
OECD (2015d), Economic Survey Belgium, 2015, OECD Publishing, Paris.
OECD (2013a), OECD Employment Outlook 2013, OECD Publishing, Paris.
OECD (2013b), Mental Health and Work: Belgium, OECD Publishing, Paris,
OECD (2010), Learning for Jobs, OECD Reviews of Vocational Education and Training, OECD Publishing, Paris.
Saks, Y. (2017), “A better understanding of developments in the numbers claiming disability insurance”, NBB Economic Review, September.
Service Public Fédéral Emploi, Travail et Concertation Sociale (2011), Évaluation de la législation relative à la prévention de la charge psychosociale occasionnée par le travail, dont la violence et le harcèlement moral ou sexuel au travail, Brussels.
Service Public Fédéral Emploi, Travail et Concertation Sociale (2017), Rapport sur la Concertation Sociale Sectorielle 2017, Brussels.
Schwellnus, C., et al. (2018), “Labour share developments over the past two decades: The role of technological progress, globalisation and “winner-takes-most” dynamics”, OECD Economics Department Working Papers, No. 1503, OECD Publishing, Paris.
Syntra Vlaanderen (2017), “Duaal Leren”, Werkplek Duaal website.
Syverson, C. (2011), “What determines productivity?”, Journal of Economic Literature, Vol. 49.
Wulfgramm, M. and L. Fervers (2013), “Unemployment and subsequent employment stability: Does labour market policy matter?”, IZA Discussion Paper, No. 7193.
