Chapter 1 examines the level and the distribution of household wealth and inheritances. It provides an overview of the level, the composition and the trends in household wealth before discussing the distribution and the trends in inheritances and gifts. The characteristics of wealth inequality and inheritances and gifts are important in the context of taxing end-of-life wealth transfers.
Inheritance Taxation in OECD Countries

1. Household wealth and inheritances
Abstract
This chapter provides an overview of the level and the distribution of household wealth and inheritances. The first sections look at the level, the composition and trends in household wealth. Examining the level of wealth inequality and patterns in its accumulation throughout the lifecycle is important in the context of taxing end-of-life wealth transfers. The composition of household wealth will also have implications for the revenue potential and administration of inheritance and estate taxes, and will be a significant determinant of their economic and distributional impact. The last section focuses on gift and inheritance trends and distribution. This is important as outcomes of inheritance taxation may be affected by the distribution of inheritances and gifts and their importance in private wealth.
This chapter shows that household wealth and inheritances are unevenly distributed, and that their levels are likely to rise in the future. While levels of household wealth vary across countries, they have grown substantially in recent years in a number of countries. The distribution of wealth partly reflects lifecycle behaviours, where people accumulate and consume wealth throughout their lives, but it remains highly concentrated at the top of the wealth distribution. The lowest-wealth households have low or negative net wealth. Real estate is the main component of wealth for most households but households in the top wealth quintile own the majority of real estate wealth. Financial assets are even more unevenly distributed and account for a larger share of household wealth at the top of the distribution. The chapter also shows that wealth transfers are unevenly distributed, as wealthy households report more and higher value gifts and inheritances. However, wealth transfers can have an equalising effect for poor households, where inheritances are large relative to households’ wealth. Wealth held by the top 1% wealthiest households and the share of inherited wealth in private wealth have increased in some countries in recent decades. These trends are likely to continue and may be accentuated by ongoing asset price rises and ageing populations, and may have significant distributional implications.
1.1. The level of household wealth across OECD countries and over time
Mean gross household wealth amounts to USD 336,7461 on average across 28 OECD countries, for which data are available. Figure 1.1 shows that mean gross household wealth is far from uniform in OECD countries, ranging from USD 83 449 in Latvia to USD 893 440 in Luxembourg. While gross wealth measures the household’s total wealth, net wealth measures wealth that households have at their disposal once debt is deducted. On average across OECD countries, mean net wealth is USD 286 739, ranging from USD 70 280 in Latvia to USD 793 008 in Luxembourg. Mean liabilities range from USD 9 798 in the Slovak Republic to USD 129 005 in Norway, and are USD 50 007 on average across OECD countries. Countries with lower mean gross wealth tend to have lower mean liabilities, but this is not true of all countries. Mean gross wealth in Denmark is USD 222 333, but household debt is nearly half of that amount.2
Figure 1.1. Mean household wealth and liabilities, per household
2015 or latest available year
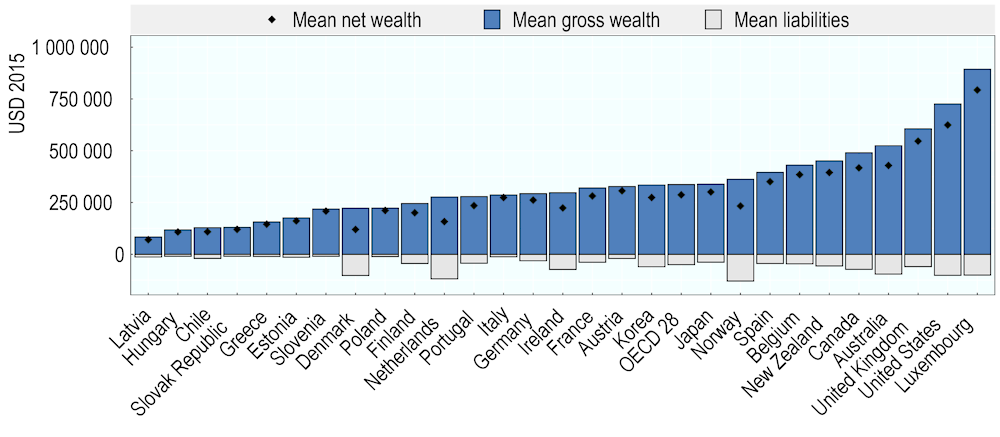
Note: Netherlands: Mean net wealth likely understates household wealth as it does not include occupational pensions, which are an important component of the wealth portfolio of many Dutch households.
Source: OECD Wealth Distribution Database, oe.cd/wealth.
Box 1.1. Measuring household wealth
This chapter draws extensively from the OECD Wealth Distribution Database (WDD, oe.cd/wdd). The WDD provides high quality and comparable micro-level data on household wealth across OECD countries, building on data provided by participating countries or computed in-house based on available microdata. The National Accounts household balance sheets, which provide high quality and comparable macro-level data on household assets across OECD countries, supplement the analysis.
Wealth Distribution Database
The WDD contains estimates for household wealth and its composition1 for 28 OECD countries. For 11 countries, these estimates are compiled based on a questionnaire completed by national contact points in National Statistics Offices and central banks that regularly collect micro-level information on household wealth. Of these 11 countries, the information provided is based on tax and administrative records in 3 countries (Denmark, the Netherlands, and Norway) and on household surveys in 8 countries (Australia, Canada, Chile, Japan, Korea, New Zealand, the United Kingdom (limited to Great Britain), and the United States).
For the 17 countries that participate in the Euro-System Household Finance and Consumption Survey (HFCS), estimates are computed in-house from the public use file provided by the European Central Bank (Austria, Belgium, Estonia, Finland, France, Germany, Greece, Hungary, Ireland, Italy, Luxembourg, Latvia, Poland, Portugal, the Slovak Republic, Slovenia, and Spain).
Concepts used in the OECD Wealth Distribution Database are in line with the OECD Guidelines for Micro Statistics on Household Wealth (OECD, 2013[1]). Despite efforts made to ensure common treatments and classifications across countries, the measures included in the OECD WDD are affected by differences that may limit their comparability. Three of the most important are: i) differences between countries in the year when data are collected; ii) differences in the degree of oversampling of rich households across countries, which may affect comparisons of both levels and concentrations of household wealth; iii) differences in the income concept recorded; while most wealth surveys provide information on household disposable income, countries covered by the HFCS rely on the concept of gross income (with the exception of Italy and Finland). This limits the cross-country comparability of estimates of the joint distribution of income and wealth. Balestra and Tonkin (2018[2]) contains a detailed comparison on these differences, including country-year availability and degree of oversampling.
The WDD reports dollar values in national currency and current prices, while this chapter reports dollar values in USD 2015.
National Accounts household balance sheets
The National Accounts household balance sheets provide another source of data for measuring household wealth. The first element of household wealth is financial assets, which includes currency and deposits; debt securities; equity; investment fund shares/units; life insurance and annuity entitlements; and pension entitlements, claims of pension funds on pension managers and entitlements to non-pension benefits. Due to institutional differences in the way pensions systems are organised, countries with highly funded pensions systems will see more pension reserves assigned as household wealth and so care should be taken in making international comparisons.
The second element of household wealth is non-financial assets, which include land and dwellings, machinery and equipment, intellectual property, and other assets used in production, such as cars owned by taxi drivers. With the exception of dwellings, non-financial assets exclude assets that are not used for production, such as private vehicles. For some countries, data on non-financial assets are not available in National Accounts, but this chapter draws exclusively on countries for which data on financial and non-financial wealth are available. These indicators are compiled according to the 2008 System of National Accounts.
Comparing the Wealth Distribution Database and the National Accounts household balance sheets
Differences between the macro-level statistics in the National Accounts and the micro-level statistics in the WDD reflect several factors. Micro statistics are based on individual households and can be used to calculate distributional estimates, while macro statistics measure the household sector as a whole. As a result, the National Accounts data cover a broader population than the WDD, including wealth held by not-for-profits and individuals living in communal establishments, but cannot be used for distributional estimates. The National Accounts measure asset types for which data are more comprehensive at the macro level, such as occupational pensions, but do not measure wealth held in consumer durables, such as vehicles. These asset types, which are measured by the WDD, are typically a more important component of wealth for low-wealth households. Finally, the National Accounts data are available for more years and countries than the WDD. Evidence drawn from the National Accounts and the WDD are only broadly comparable.
Balestra and Tonkin (2018[2]) find that household assets per capita as measured by the National Accounts are systematically higher than average wealth per person, computed by the WDD. Work is ongoing to compare micro and macro statistics for household wealth and in the future more coherent statistics on household finances may be available. More information about the WDD, including comparison with the National Accounts, can be found in Balestra and Tonkin (2018[2]).
Tax administration taxpayer micro data
Recent analysis has highlighted the potential of individual tax record microdata for tax policy analysis (Kennedy, 2019[3]). Tax administration data has several advantages over survey data, as it records the entire population of taxpayers, does not have problems with non-response and respondents leaving longitudinal surveys, and results in a significantly larger sample size than is possible with surveys. This source of data is ideal for some types of analysis, including income dynamics and mobility. However, tax administration data on wealth and wealth transfers is less comprehensive than data on income in many countries. This can be due to high thresholds before gifts and inheritances should be reported, tax avoidance and evasion, or because a country does not levy taxes that require taxpayers to report to the tax administration, such as a net wealth tax or inheritance, estate, and gift taxes. Future work on wealth statistics can draw on combined data sources, exploiting the comparative advantages of survey data, national accounts data, and taxpayer microdata.
1. This chapter uses aggregates of asset types in three categories: financial wealth (bonds and other debt securities, deposits, mutual funds and other investment funds, net equity in own unincorporated enterprises, stocks, other financial non-pension assets, unlisted shares and other equity, and voluntary pensions and whole life insurance), real estate wealth (principal residence and other real estate), and other wealth (valuables, vehicles, and other non-financial assets).
Average wealth can give an inflated picture of household wealth because of the large holdings by households at the top. Median wealth instead measures the wealth held by households in the middle of the wealth distribution, and is less affected by outliers. Figure 1.2 shows that in some countries, mean wealth is significantly higher than median wealth. The United States has the second highest mean net household wealth (USD 624 225), but the eighth lowest median household wealth (USD 76 436). Luxembourg has the highest mean and median net wealth of all countries in the sample, though like all countries in Figure 1.2, mean net wealth is greater than median net wealth.
Figure 1.2. Mean and median household net wealth
2015 or latest available year
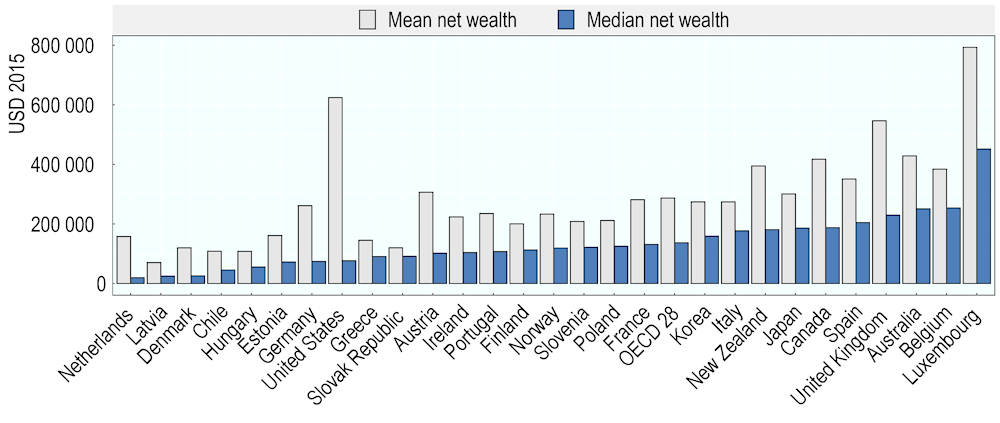
Note: Netherlands: Mean net wealth likely understates household wealth as it does not include occupational pensions, which are an important component of the wealth portfolio of many Dutch households.
Source: OECD Wealth Distribution Database, oe.cd/wealth, (Balestra and Tonkin, 2018[2]).
Over time, wealth held by households has grown substantially in some countries. To complement figures exploring mean household wealth, Figure 1.3 shows household assets per capita, using data from National Accounts to measure wealth held by individuals (see Box 1.1). This figure tracks the evolution of household assets, which are set to 100 in the base year (1995 for all countries except Mexico (2003) and Korea (2008), as data for earlier years were not available). Household wealth rose in all countries in Figure 1.3 and grew significantly in some. Between 1995 and 2019, per capita wealth nearly tripled in France and more than doubled in Canada and the United Kingdom. Increases were smaller, though still notable, in countries for which fewer years of data were available, including Mexico (66 base points between 2003 and 2018) and Korea (27 base points between 2008 and 2018). Per capita wealth grew slowly in some countries, including Japan and the Czech Republic, which maintained a steady growth path during the 2008-09 financial crisis when per capita wealth decreased sharply for countries with higher per capita wealth.
Figure 1.3. Financial and non-financial assets held by households, per capita, 1995-2019, selected countries
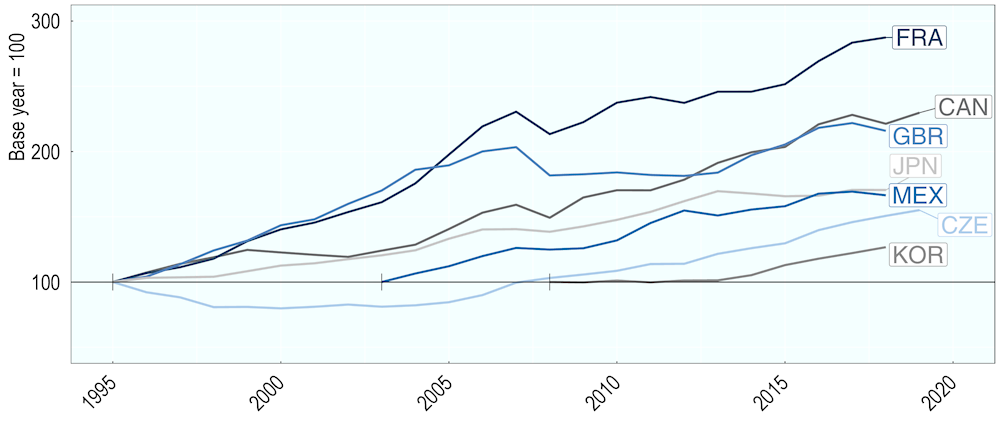
Note: The base year is 1995 for all countries except Mexico (2003) and Korea (2008), where the base year is the earliest year for which data are available. A vertical line marks the base year.
Source: OECD National Accounts
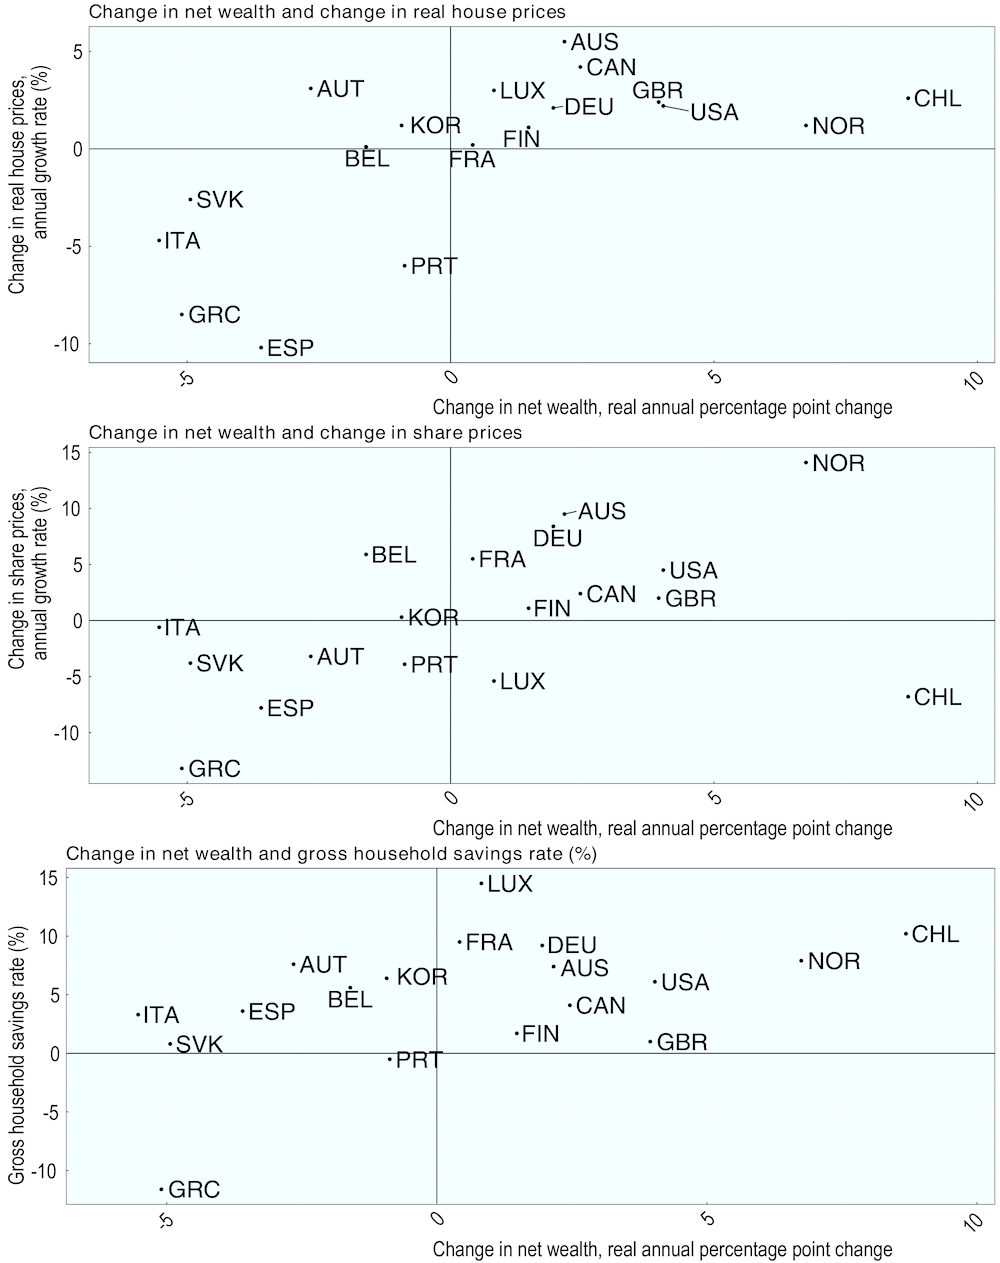
Changes in savings rates and in the prices of housing and shares, which are widely held asset classes, can give insight into overall shifts in net wealth, as savings rates and variations in asset prices drive household wealth over time. Figure 1.4 compares changes in mean net wealth to three drivers: housing prices, share prices, and savings rates. These graphs illustrate relationships between household wealth and wider macroeconomic trends, but other variables, such as low interest rates, may also affect household wealth (Hviid and Kuchler, 2017[4]).
Figure 1.4 shows a clear relationship between changes in net wealth and changes in housing and share prices. Net wealth decreased in most countries where housing and share prices decreased, while net wealth grew in most countries with housing and share price growth. However, there are differences between growth in countries’ net wealth for a given rate of housing and share price growth. For example, housing prices grew by around 1.2% in Korea and Norway, but net wealth decreased by 0.9% in the former and grew by 6.8% in the latter. In a minority of countries, housing or share price growth was associated with negative net wealth growth and vice versa. Housing prices increased in Austria and share prices increased in Belgium, but net wealth decreased. While no countries experienced net wealth growth without housing price growth, net wealth grew in Chile and Luxembourg even as share prices decreased.
Net wealth appears more weakly linked to gross household savings rates. Two countries had negative savings rates (Greece and Portugal), and both experienced decreases in net wealth, housing prices, and share prices. Three countries (Italy, Slovakia, and Spain) had savings rates below 5% and negative growth in housing and share prices. However, the strength of the relationship between higher savings rates and growing net wealth differs across countries, as the changes in net wealth varied substantially for a given rate of savings. For example, Australia and Austria had savings rates of 7.4% and 7.6%, respectively, but net wealth decreased by 2.7% in Austria while it grew 2.2% in Australia. It should be noted, however, that the link between wealth and savings rates may have been weakened during the period 2010-2015 due to significant asset price growth.
Figure 1.4. Change in net wealth and selected drivers of wealth accumulation
2010 to 2015 or closest available years
Note: The net household savings rate measures the total net savings, including in mandatory retirement savings, as a portion of net household disposable income.
Source: All indicators can be found in Balestra and Tonkin (2018[2]). Indicators excluding the change in net wealth can be found in the OECD National Accounts Database (http://stats.oecd.org/Index.aspx?DataSetCode=NAAG) and the Main Economic Indicators Database (http://stats.oecd.org/Index.aspx?DataSetCode=MEI).
1.2. The distribution of household wealth
Wealth is highly concentrated at the top of the distribution3 in most countries. This is evidenced by a simple indicator of inequality, the ratio of median to mean wealth. Median wealth better represents the wealth held by a “typical” household in the middle of the wealth distribution, compared to mean wealth that is affected by high outliers, so mean wealth will be higher than median wealth when wealth is concentrated at the top. Mean wealth is higher than median wealth in every country in Figure 1.2. The figure shows that mean wealth is 1.3 to 4.7 times higher than median wealth in most OECD countries, but in the Netherlands and the United States, mean wealth is more than eight times higher than median wealth.
The wealthiest ten percent of households own half of all household wealth on average across 27 OECD countries (Figure 1.5). The share of wealth held by households in the top ten percent varies across countries, ranging from one third in the Slovak Republic to four-fifths in the United States. Furthermore, even within the top decile wealth levels are highly unequal. The share of total household wealth held by the 90th to 95th percentiles ranges from 11% (Slovenia) to 17% (Denmark) and the share of total household wealth held by the 96th to 99th percentiles ranges from 14% (Slovak Republic) to 28% (Latvia). On average, the top one percent of the wealth distribution own a striking 18% of household wealth. There is significant cross-country variation in the wealth shares held by the top one percent; ranging from 9% in Greece to 43% in the United States, which also has the highest top ten percent wealth share.
Figure 1.5. Share of total net household wealth held by the top ten percent of the wealth distribution
2015 or latest available year
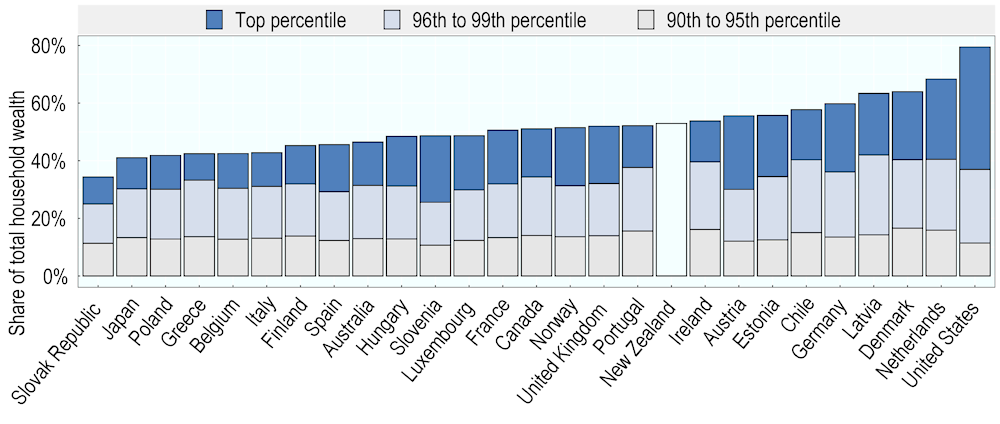
Note: Data were not available for Korea and a breakdown of wealth held by the top ten percent was not available for New Zealand. Netherlands: figure does not include occupational pensions, which are an important component of the wealth portfolio of many Dutch households.
Source: OECD Wealth Distribution Database, oe.cd/wealth.
Survey data may underestimate wealth inequality, due to the underrepresentation of the wealthiest households. Households at the top of the wealth distribution are underrepresented in typical household surveys, which surveys such as the HFCS seek to address through the oversampling of wealthy households. A recent study of the wealth distribution in Germany corrected the data gap through more targeted oversampling of wealthy households, for those with net assets worth EUR 3 million to 250 million, and through publicly available “rich lists” for the remainder of the wealth distribution (Schröder et al., 2020[5]). The authors found that when this data gap was closed, wealth was more concentrated at the top than previously found; the top one percent wealthiest households holds around 35% of total wealth, compared to 22% previously. Survey data may therefore be considered a lower bound estimate of wealth inequality, which can be complemented by sources like “rich lists” and individual tax record microdata.
Wealth inequality has experienced a secular decline over time and across countries. Long run analysis is helpful to show trends in wealth inequality as inequality is typically slow to change and policies to narrow wealth inequality, such as inheritance and estate taxes, take time to affect the wealth distribution. Unfortunately, long run data on wealth inequality are available for very few countries. Caution should be taken in generalising these countries’ trends, as historic economic growth, and returns on investment, taxes and transfers and other factors that may affect long-run wealth inequality differ across countries. Figure 1.6 shows that in France, Germany, the United Kingdom, and the United States, the share of wealth held by households in the top one percent and top ten percent of the wealth distribution declined steadily throughout the 20th century. The most substantial drop was in the United Kingdom, where the share of wealth held by the top ten percent wealthiest households halved between 1914 and 1991, falling from 93% to 46%. Figure 1.6 also shows differences in wealth inequality trends across countries. The sharpest decreases in the top ten percent wealth share occurred in the 1910s in the United States, in the 1940s in France, and in the 1960s in the United Kingdom.
However, it appears that the long-run decrease in wealth inequality is reversing. Following a secular decline throughout the early and middle 20th century, top wealth shares increased during the latter part of the 20th century or the early 2000s, depending on the country. In France, the wealth share of the top one percent in 2000 was similar to the wealth share in the mid-1960s and mid-1940s and in the United States, the top one percent wealth share had returned to levels seen in the 1930s by 2014. Although the United Kingdom has seen the most dramatic falls in the wealth share of the wealthiest households, there has been a slight upward trend since the late 1980s. Finally, the wealth share for the top one percent in Germany in 2017 was similar to that in the late 1980s, and lower than earlier in the 20th century.
It is worth mentioning that the households that are in the highest wealth groups vary over time. While the growing concentration of wealth may be a cause for concern, it is important to note that the individuals at the top may change over time. These changes at the top of the wealth distribution may point to greater equality of opportunity than might first be apparent from top wealth shares. A recent study by the Institute for Fiscal Studies (IFS), focusing on the top one percent of income taxpayers in the United Kingdom, found that only half the earners will remain there for five years (Joyce, Pope and Roantree, 2019[6]). However, some earners drop in and out of the top one percent, indicating that they most likely remained very high earners even when not at the top. Changes in individuals in the top one percent of income may be more frequent than changes in top wealth shares, due for instance to non-recurring income from sale of assets.
Figure 1.6. Long run share of net wealth held by the top ten percent and top one percent wealthiest households, select countries
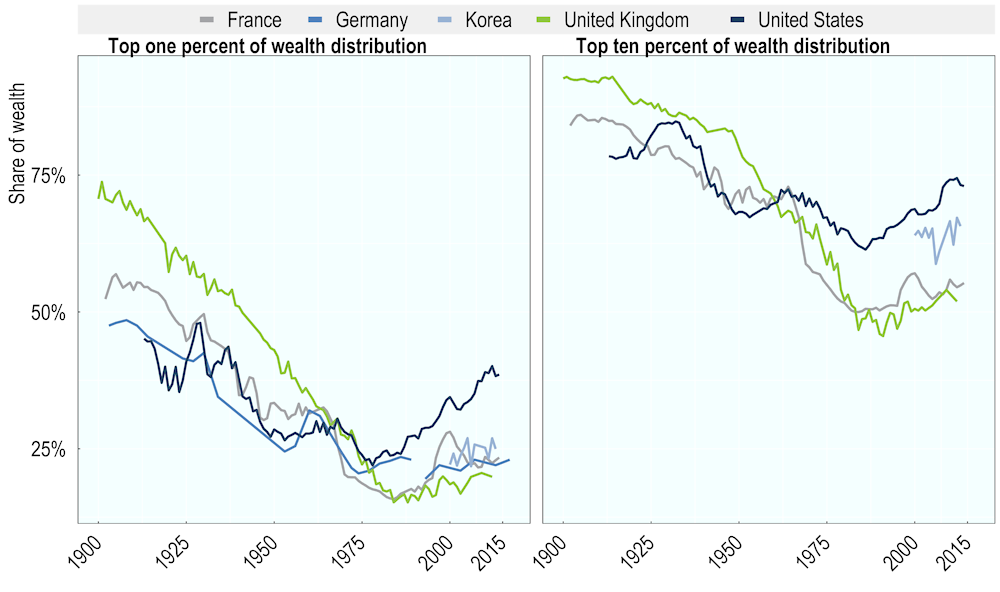
Note: While top wealth shares are broadly similar between the World Inequality Database, the source for all countries in this graph except Germany, and the WDD, used extensively in this chapter, these two sources rely on different methodological assumptions and are not strictly comparable. See Balestra and Tonkin (2018[2]) for a detailed comparison. Data are not annual for Germany.
Source: World Inequality Database, wid.world/data/, data for Germany in Albers, Bartels and Schularick (2020[7]).
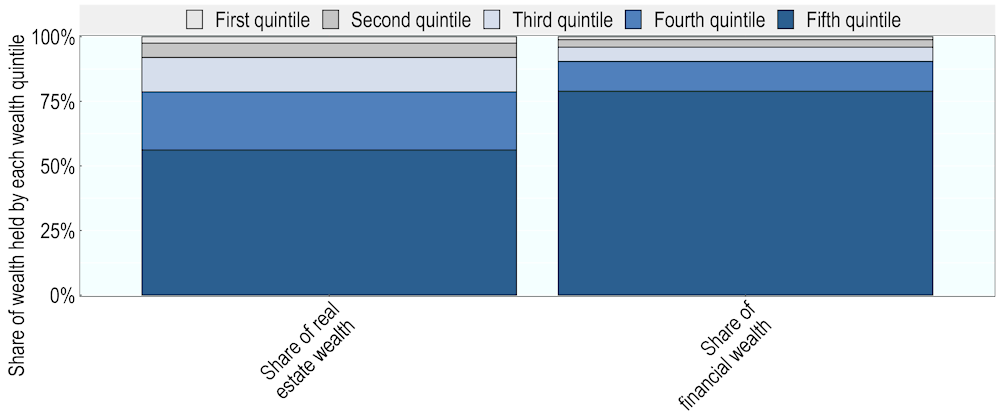
Total financial and housing wealth are concentrated among the wealthiest households. On average across 28 OECD countries, households in the top wealth quintile own more than half of all real estate wealth and nearly 80% of all financial wealth (Figure 1.7). In contrast, households in the lowest wealth quintile own just 1% of financial wealth and 2% of real estate wealth. Real estate wealth is more evenly distributed than financial wealth; for example, the middle wealth quintiles (third and fourth quintiles) own over one third of real estate wealth, compared to just 17% of financial wealth. While housing wealth may have an equalising effect on the wealth distribution (Causa, Woloszko and Leite, 2019[8]), rising housing prices have contributed to rising wealth inequality in recent years, particularly along the divide between owner-occupier and renter households (OECD, 2019[9]).
Figure 1.7. Share of financial and real estate wealth held by each quintile, average for 28 OECD countries
2015 or latest available year
Figure 1.8. Wealth distribution of each income quintile, average for 27 OECD countries
2015 or latest available year
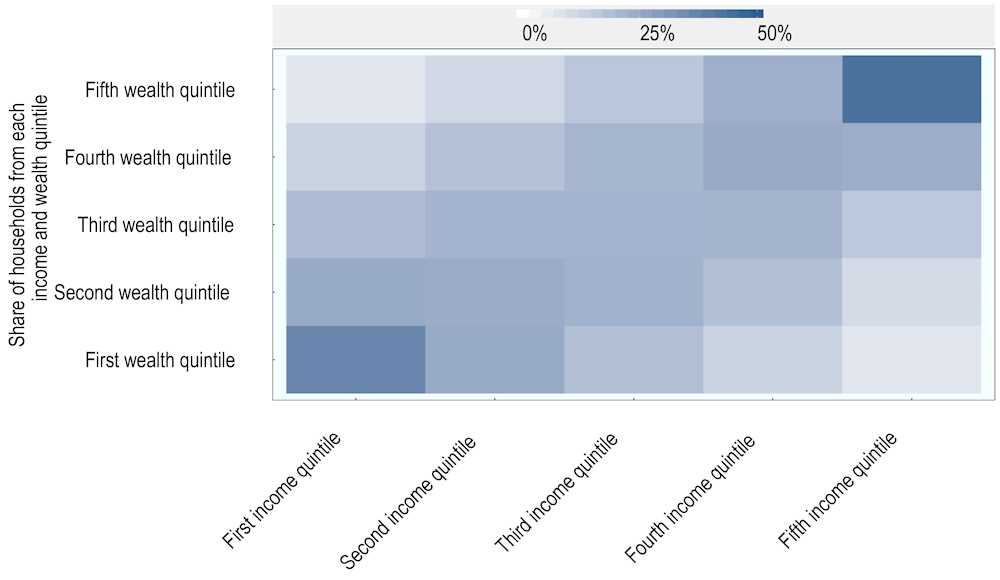
Note: Columns and rows each sum to 100% of households. Income shows gross income and is not equivalised across household types.
Source: OECD Wealth Distribution Database, oe.cd/wealth.
There is a strong relationship between income and wealth, particularly at the top of the distribution. While wealth is more unequally distributed than income, Figure 1.8 shows there is a clear relationship between the highest income and wealth quintiles and between the lowest income and wealth quintiles. The figure also shows that few households combine high wealth and low income, or high income and low wealth. However, the relationship between wealth and income is weaker in the middle of the wealth and income distributions. The relationship between income and wealth may be mutually reinforcing; high-income households can save more and then increase their income by, for example, earning a return on their savings or using seed capital to start a business. The inverse trend may apply at the bottom of the income distribution, where households have a lower propensity to save and may invest in low-risk, low-return assets (Campanale, 2007[10]).
1.3. The asset composition of household wealth
Households hold the largest share of their wealth in real estate. Evidence shows that for many households, the main form of savings is their own home (Causa, Woloszko and Leite, 2019[8]). Across the Eurozone countries that participate in the HFCS4, the main residence accounts for 49.5% of total assets and is the largest asset type for 52.5% of households (Household Finance and Consumption and Network, 2016[11]). As owner-occupied housing has a dual role as a consumption good and an asset class, households may consume housing services while also building personal wealth. Households may view housing as a safe investment, due in part to sustained housing price increases in recent years, and may use mortgage repayments as a form of forced savings. Many OECD countries also provide favourable tax treatment for owner-occupied homes, which creates significant incentives to invest in housing (Fatica and Prammer, 2017[12]; OECD, 2018[13]; Rosen, 1985[14]). Homeownership may provide other benefits as, depending on rental regulations, homeownership can provide more stability relative to renting.
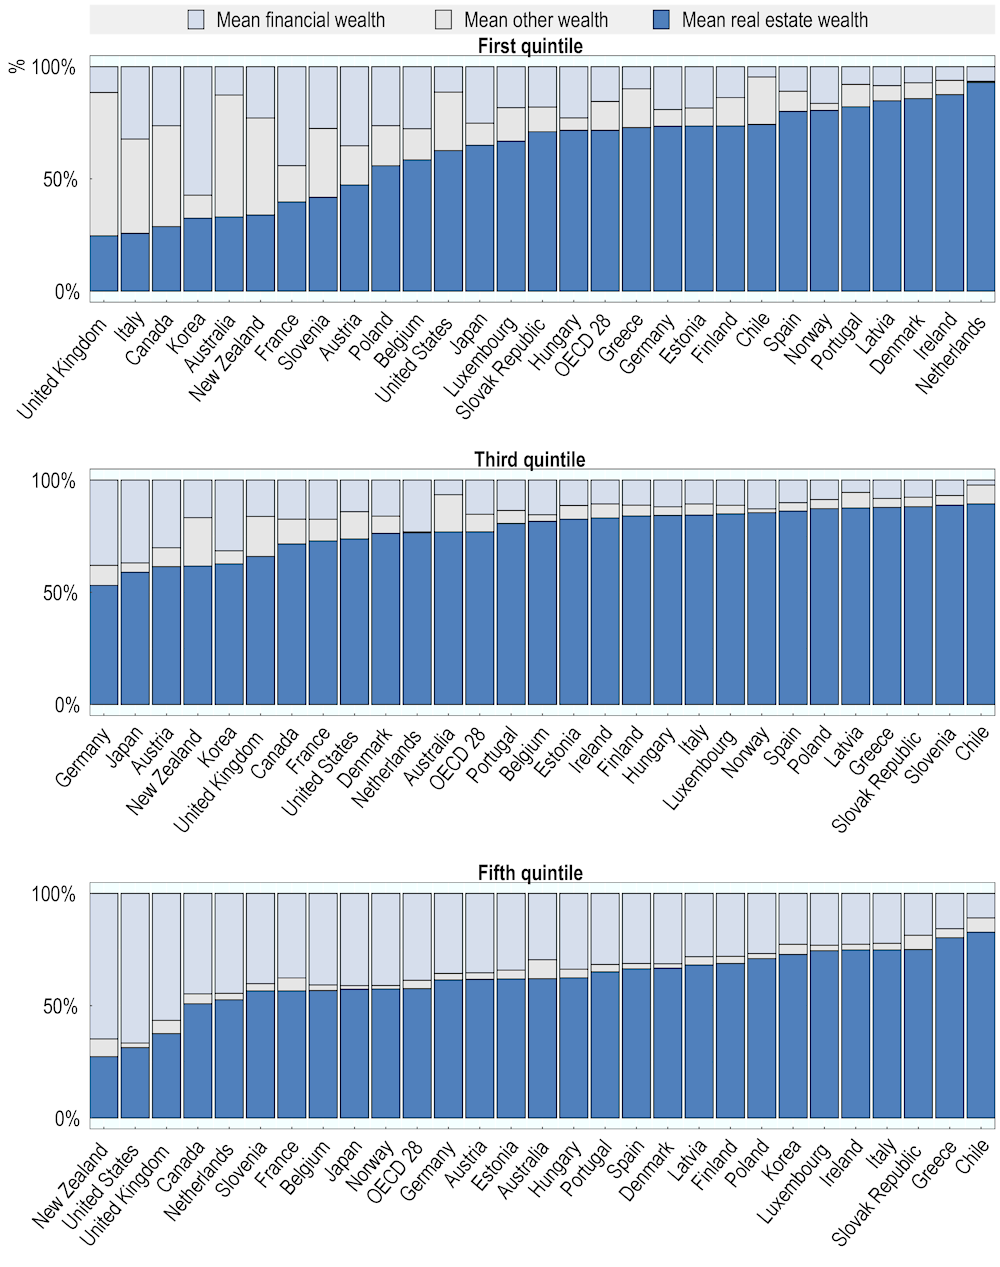
Housing is a larger share of assets for middle households than it is for wealthy and low-wealth households (Figure 1.9). While real estate is the dominant asset type across most households in most countries, this is especially notable for households in the middle wealth quintile. For these households, real estate comprises at least half their wealth in all 28 OECD countries and comprises more than three-quarters of wealth in 20 countries. For low-wealth households, assets such as valuables and vehicles are relatively more important than for middle and wealthy households. This reflects that low-wealth households hold more of their wealth in consumer durables and have low levels wealth overall. In five countries (Australia, Canada, Italy, New Zealand, and the United Kingdom), other forms of wealth outweigh housing wealth for low-wealth households, but across these countries, the relative importance of vehicles, valuables, and other non-financial assets is highly heterogeneous.
At the top of the wealth distribution, financial wealth is a large component of household wealth in most countries. This aligns with earlier findings that total financial wealth is concentrated in the hands of households at the top of the wealth distribution (Figure 1.7). For households in the top wealth quintile, more than half of total wealth is held in financial assets in the United States (67%), New Zealand (65%) and the United Kingdom (57%). On average across the 28 OECD countries, financial wealth accounts for 39% of net wealth for the top quintile, compared to 16% and 15% for the bottom and middle quintiles, respectively.
Figure 1.9. Composition of net wealth for bottom, middle and top wealth quintiles
2015 or latest available year
Wealth held in occupational pensions is important in a minority of countries (Figure 1.10). The WDD includes voluntary private pensions in standard measures of household wealth, but excludes occupational and social security pensions as consistent data are not available across all participating countries. In contrast to the standard indicator, occupational pensions (for both private and public sector) are included in mean net extended wealth. This complements the standard indicator of household wealth, but the effect of moving from net wealth to extended net wealth is small for both wealth levels and inequality for most countries (Balestra and Tonkin, 2018[2]). Mean extended net wealth is notably higher in some countries with quasi-mandatory occupational pension schemes (Australia and Denmark) and in some countries where these schemes are voluntary (Canada, the United Kingdom, and the United States). While data on occupational pension schemes for the Netherlands are not currently included in the OECD Wealth Distribution Database, which was the basis for Figure 1.10, data published by Statistics Netherlands show they are a significant component of household wealth.5 Public pension entitlements, referred to as state pension entitlements in some countries, accruing under government social security schemes are excluded from the standard and extended wealth indicators, as estimates of public pension wealth are not available at the household level in most countries. However, public pensions could affect savings behaviour as taxpayers may be entitled to income in retirement. The replacement rate6, measured as pension entitlements as a share of pre-retirement earnings, is significant in some OECD countries; for an average-income worker, it is highest in Italy (79.5%), Luxembourg (78.8%), and Austria (76.5%) (OECD, 2019[15]).
Figure 1.10. Net wealth including and excluding occupational pensions
2015 or latest available year
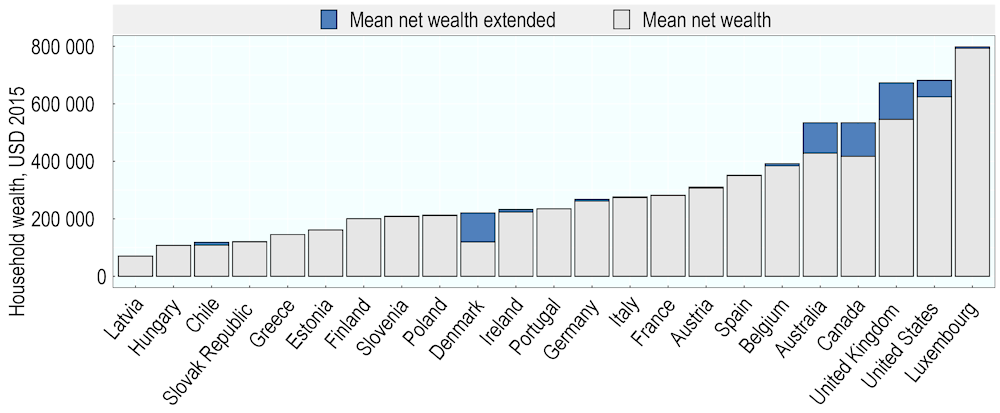
Note: Data were not available for Japan, Korea, the Netherlands, New Zealand, and Norway. Netherlands: while data on occupational pensions are not available in the Wealth Distribution Database, they are an important component of the wealth portfolio of many Dutch households.
Source: OECD Wealth Distribution Database, oe.cd/wealth, (Balestra and Tonkin, 2018[2]).
1.4. Lifecycle patterns in household wealth
The distribution of wealth in many OECD countries partly reflects lifecycle behaviours. Young people typically have very little wealth but as people get older, they will have had more time to accumulate wealth and they are more likely to have received any inheritances. Workers in the later years of their career often have higher incomes, allowing them to save more (Dynan, Skinner and Zeldes, 2004[16]). As individuals move into retirement, their household’s wealth may start to decline as their income falls and as they may rely on their wealth to finance consumption. Some households may downsize, opting for smaller housing to reduce maintenance costs and to access the equity they hold in their home, for example.
Young households are overrepresented at the bottom of the wealth distribution, while pre-retirement and retired households (55-74 years old) are most numerous at the top. Figure 1.11 shows that the wealth distribution across age groups follows an inverted U-shape pattern. Young households cluster at the bottom of the wealth distribution, where nearly 70% of households whose household head was aged under 35 are in the first two wealth quintiles. Between the ages of 35 and 44, households spread more evenly across the wealth distribution and by ages 45-54, they begin to concentrate toward the top. More than half of all households whose head is of pre-retirement and retirement age (55-74 years old) are in the top two wealth quintiles, including 28% of households in the top quintile. As household heads pass the age of 75, they become more numerous in the middle, where 47% of households are in the third and fourth wealth quintiles.
Figure 1.11. Share of each age group in wealth quintiles, average for 28 OECD countries
2015 or latest available year
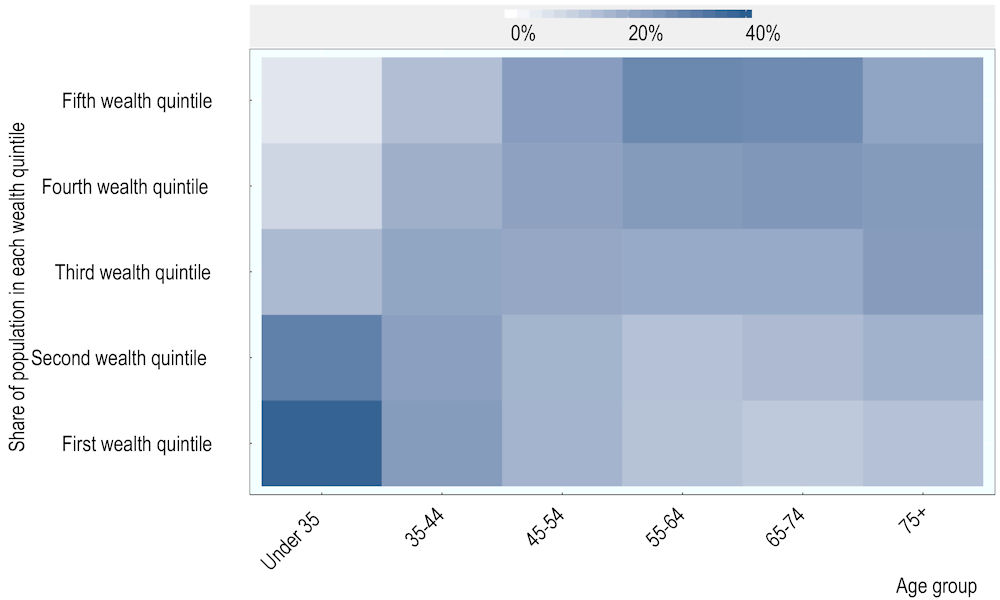
Note: The age group of each household is that of the household head
Source: OECD Wealth Distribution Database, oe.cd/wealth, (Balestra and Tonkin, 2018[2]).
Young households may find it harder to accumulate wealth than in the past. Comparing different age groups at a given point in time shows only a partial, static picture. A dynamic view could show younger households ageing and accumulating wealth over time, so young and low-wealth households will not necessarily remain in that position. However, there are concerns that traditional avenues for wealth accumulation may be less available to today’s younger households. Research has shown that homeownership is associated with wealth accumulation (Causa, Woloszko and Leite, 2019[8]), but young households are finding it increasingly difficult to purchase a home as rising house prices decrease affordability (McKee, 2012[17]). The COVID-19 crisis, which has affected different demographic groups differently, may exacerbate difficulties for some households and increase the divide between older asset-owning households and younger households.
Households whose head is of pre-retirement or retirement age (55-64 years old) have the highest levels of housing and financial wealth on average across the 28 OECD countries. Figure 1.12 shows average net wealth and the composition of average gross wealth across the age distribution. Households headed by an individual aged 55-64 years hold gross wealth amounting to USD 451 413, of which about two-fifths is held in real estate and one-third is held in financial assets. Net wealth for 55-64 year olds amounts to USD 406 012, which is followed by USD 393 277 for households aged 65-74 and USD 324 391 for households aged 45-54. Young households whose head is aged under 35 have the lowest net wealth, at USD 93 127. While housing and financial wealth both increase as households age and net wealth increases, financial wealth becomes a larger component of wealth. This is consistent with patterns discussed above, where wealthier households tend to hold more wealth in the form of financial assets. Other types of wealth such as vehicles, artwork, and jewellery are a small part of total wealth for households of all ages.
The propensity to consume wealth in retirement is likely to vary across households, but evidence shows that wealth levels remain high among households whose head is over the age of 75. Lifecycle wealth accumulation suggests that households save at least in part to finance consumption in retirement, however, the extent to which households consume their wealth in retirement depends on several factors. Low-wealth households may need to consume their savings, while wealthier households may earn sufficient capital income to support themselves. Households intending to leave a bequest may also set aside wealth for this purpose (see Chapter 2) and as a result, some households will not fully consume their wealth in retirement. The broader tax and benefit context, including taxes on gifts and inheritances as well as means and asset testing for entitlements to public benefits and services (e.g. old-age care) may also influence households’ decisions related to wealth accumulation, wealth transfers or consumption. The interactions between these different dimensions could be explored in future work. Figure 1.12 shows that households whose head is over the age of 75 hold substantial levels of wealth, more than a decade into retirement. Excess precautionary savings and a lower propensity to consume may contribute to high wealth levels for older households. This precautionary behaviour may include orienting savings towards safer assets, which can have broader economic consequences where safe assets are preferred over more productive but riskier assets. Higher wealth among older households increases their ability to leave a bequest, although rising life expectancy means that households may receive an inheritance later in life when they are themselves approaching retirement. Rising life expectancy may affect the age distribution of wealth; as households prepare for the possibility of a long retirement, older households may need to hold more wealth to finance consumption. Theoretical work has attempted to distinguish savings to finance retirement and savings to leave a bequest to heirs, but empirical work has not found clear evidence for the relative importance of each motive (see chapter 2).
Figure 1.12. Composition of wealth across age groups, average for 28 OECD countries
2015 or latest available year
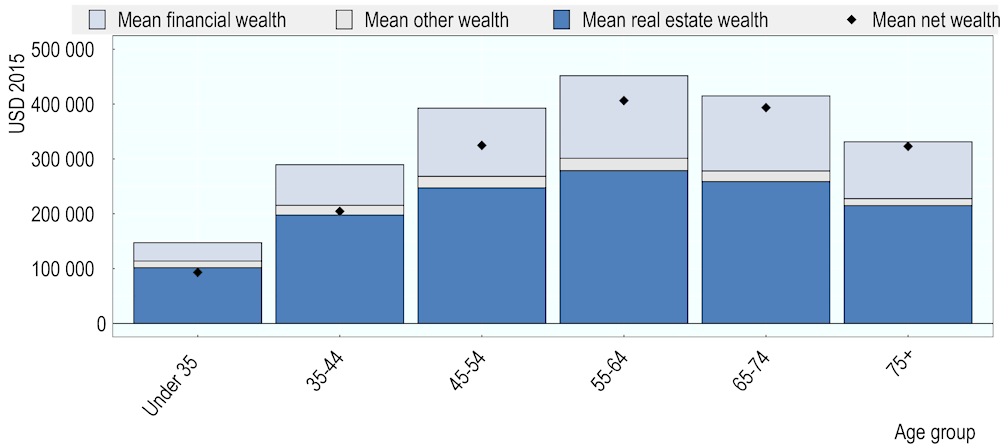
Note: The age group of each household is that of the household head
Source: OECD Wealth Distribution Database, oe.cd/wealth, (Balestra and Tonkin, 2018[2]).
Financial wealth decreases faster in retirement than housing wealth. Figure 1.13 shows gross household wealth across the age distribution normalised to that of the 55-64 age group, separated into financial and real estate wealth. Note that while both real estate and financial wealth have a normalised value of one for the 55-64 age group, the level of financial wealth is lower than real estate wealth (see Figure 1.12). Figure 1.13 shows that housing and financial wealth grow throughout the lifecycle to reach their highest level for households aged 55-64 and then decrease for households aged over 65. After peaking for households aged 55-64 (normalised value of 1), real estate wealth declines steadily for households aged 65-74 (0.95) and households over 75 (0.82). Financial wealth, which also peaks for the 55-64 age group, drops more rapidly than housing wealth, to 0.75 and 0.63 for households aged 65-74 and over 75, respectively.
The trends in Figure 1.13 may reflect age and cohort effects, as well as the lower levels of financial wealth. Retired households draw down the wealth that they accumulate earlier in life; financial wealth may decrease more rapidly than housing wealth as financial wealth starts from a lower level and because households may choose to draw down liquid financial wealth before illiquid housing wealth. Figure 1.13 may also reflect the dual role of housing as an asset class and a consumption good providing housing services, with households preferring to retain housing rather than use it to finance consumption. Finally, the drop in financial wealth at retirement age may reflect the growing role of private pensions in household wealth7, as retired households use the wealth they have saved for their retirement to finance consumption, rather than drawing on housing or other wealth. However, the trends may also reflect cohort effects. Recent research has found that households in the United Kingdom aged 80 years or older in 2012-13 held more wealth than households of the same age in 2002-03, principally due to increased housing wealth, tied to rising housing prices and higher rates of homeownership (Hood and Joyce, 2017[18]). The higher wealth of the 55-64 age group in Figure 1.13, relative to the 65 and above group, may therefore reflect steadily increasing levels of household wealth for younger generations.
Figure 1.13. Mean net financial and real estate wealth normalised to 55-64 year olds, OECD 28 average
2015 or latest available year
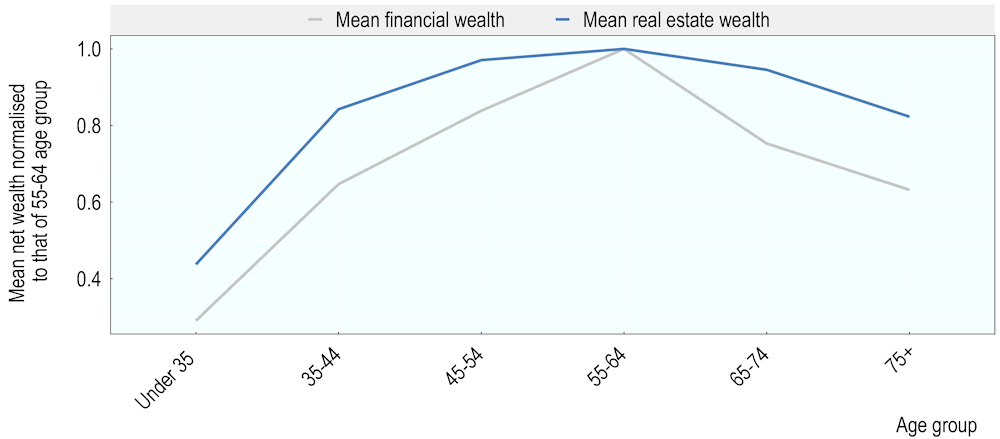
Note: The age group of each household is that of the household head
Source: OECD Wealth Distribution Database, oe.cd/wealth.
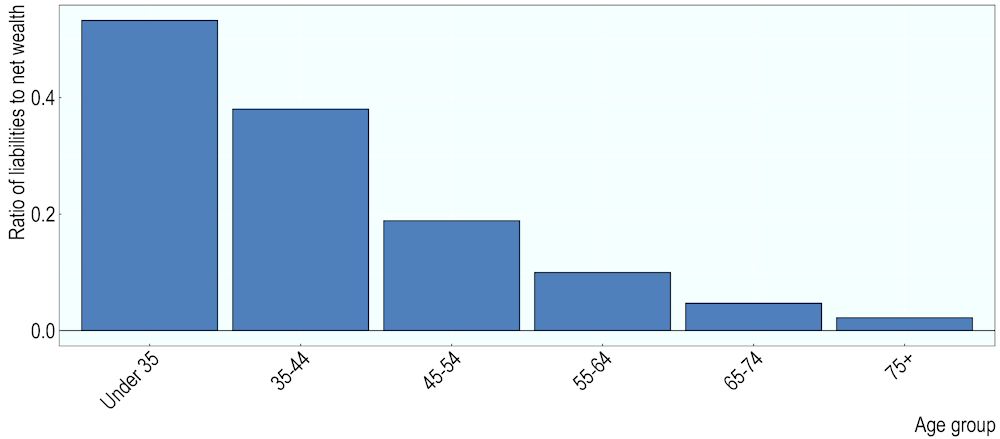
Debt held by retired households is small compared to their net wealth, while younger households have high debts compared to their net assets. Figure 1.14 shows how wealth accumulation and debt play out over the lifecycle. Young households hold liabilities worth nearly half of their net wealth. While the liabilities themselves are smaller in absolute terms than those held by older households, they are large compared to net wealth. As households get older and accumulate more wealth, their liabilities may grow in absolute value, but they become smaller as a portion of net wealth. As households move closer to retirement, debt becomes a very small portion of net wealth. Although not shown in the graph below, debt profiles may link to earning capacity and the ability to service a loan, and households may seek to reduce the risk associated with debt as they age.
Figure 1.14. Ratio of liabilities to net wealth across age groups, average 28 OECD countries
2015 or latest available year
1.5. Characteristics of wealth transfers
Inheritances are a significant source of household wealth and have important distributional consequences, as wealthy households receive more wealth than lower-wealth households. This section examines evidence on the size and prevalence of gifts and bequests and discusses their implications for the wealth distribution. Among the data sources that this section draws on, the WDD measures household wealth during the reference year and measures the value of gifts and inheritances over the lifetime, but does not measure wealth at the time that the household received the gift or inheritance.
Evidence on the size of wealth transmissions is sparse, but studies suggest that large amounts of wealth are transferred each year. The annual flow of bequests was estimated to be between 8-15% of Gross National Income (GNI) in some European countries in 2010 (Piketty and Zucman, 2015[19]). Over time, this figure has varied substantially in the few countries with available data. In France, Germany, and the United Kingdom, bequests have exhibited a U-shaped pattern since the beginning of the twentieth century. Inheritances amounted to around a quarter of national income at the turn of the century but steadily declined in the turbulence of the first half of the century, before returning to levels seen around the end of WWI by 2010.
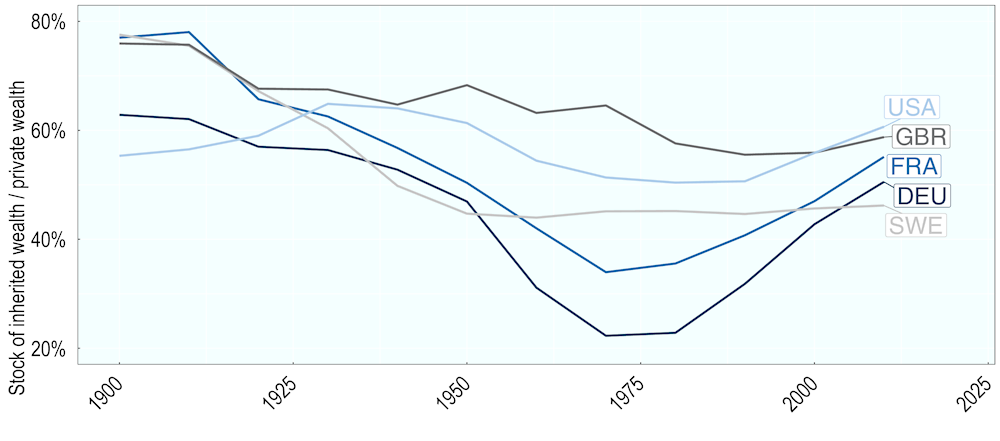
There is evidence that the share of inheritances in private wealth is returning to the highs seen at the turn of the 20th century in some countries. Preliminary evidence of long-run trends in inherited wealth, and the methodology used to calculate them, are presented in Alvaredo, Garbinti and Piketty (2017[20]), drawing on Piketty (2011[21]). Figure 1.15 shows that in 1900, the majority of private wealth had been inherited; the share of inherited wealth in private wealth ranged from 55% in the United States to 78% in Sweden. This ratio peaked in the early 20th century for all countries in Figure 1.15, before declining steadily over the course of the 20th century. Beginning in the late 20th or early 21st century, inheritances began to rise as a share of private wealth in most countries. While the United Kingdom experienced a moderate but steady decline from 1900-1990 before rising slightly from 1990-2010, Germany experienced a sharp decline from 1950-1970 and a sharp increase from 1980-2010. The trends in France and the United States are similar to, but less accentuated than, the trend in Germany. If these trends continue, inherited wealth may once again reach the high levels of the early 1900s. However, the trend in Sweden is less suggestive of a return to early peaks, as the ratio of inherited to private wealth has remained stable since declining between 1900 and 1950.
Figure 1.15. Cumulated stock of inherited wealth as a fraction of private wealth, 1990-2010, selected countries
Note: Data for the United States are the unweighted average of benchmark and high-gift estimates.
Source: Alvaredo, Garbinti, and Piketty (2017), data for Sweden in Ohlsson, Roine, Waldenström (2020).
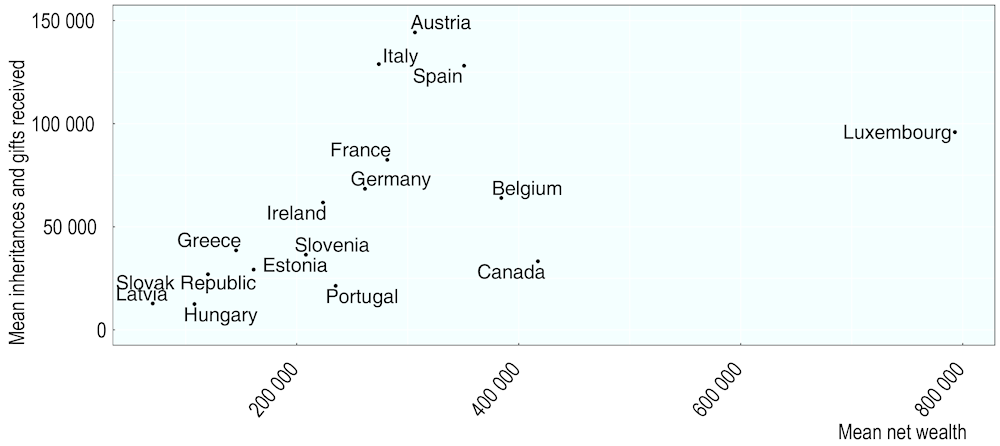
Countries with higher average household wealth tend to have higher average inheritances. Figure 1.16, which compares mean inheritances and gifts to mean net wealth for 16 countries for which data were available, shows that the average value of wealth transfers rises with average net wealth. Latvia, Hungary, and the Slovak Republic have low average inheritances and gifts and are among OECD countries with the lowest mean net wealth. Luxembourg and Spain are among the OECD countries with the highest mean net wealth and have the fourth and third highest average inheritances, respectively. However, Belgium and Canada have high mean net wealth yet relatively small average inheritances and several countries with mean net wealth close to the OECD average have relatively high average inheritances (Austria, France, Germany, and Italy). Italy and Portugal have similar average wealth, but average inheritances are significantly higher in Italy than in Portugal. Conversely, Canada and Greece have similar average inheritances, but mean net wealth is substantially higher in Canada.
Figure 1.16. Mean net wealth compared to mean inheritances and gifts
2015 or latest available year, USD 2015
Note: Data were not available for Finland and the Netherlands. Data for Poland removed due to data issues.
Source: OECD Wealth Distribution Database, oe.cd/wealth.
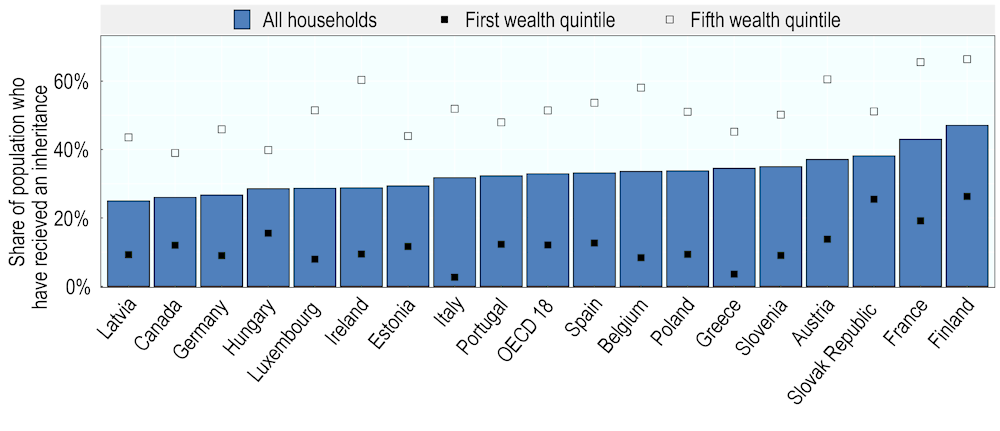
Survey data show that a large share of high-wealth households report receiving an inheritance or gift. On average across 18 OECD countries, 33% of households reported receiving an inheritance or a substantial gift8, but these shares vary across countries, ranging from 25% (Latvia) to 47% (Finland). However, across all 18 OECD countries, a greater share of wealthy households received an inheritance or gift than low-wealth households. Figure 1.17 illustrates this link between current wealth and the chances of having received a wealth transfer. Among households in the top wealth quintile, the portion of households who have received an inheritance or gift ranges from 39% (Canada) to 66% (Finland), compared to between 3% (Italy) and 26% (Finland) among the poorest households. The difference between the top and bottom wealth quintiles is smallest in Hungary (24 percentage points), and largest for Ireland (51 percentage points).
Figure 1.17. Share of population that has received an inheritance or a substantial gift
2015 or latest available year
However, the survey data that inform this analysis should be interpreted with caution. The survey measured wealth at the time that the household responded to the questionnaire, but not at the time that the household received the inheritance or gift, This means, for example, that households may have received wealth when they were younger and less wealthy, but now report high net wealth. For this reason, caution should be taken in interpreting the relationship between wealth and inheritances.
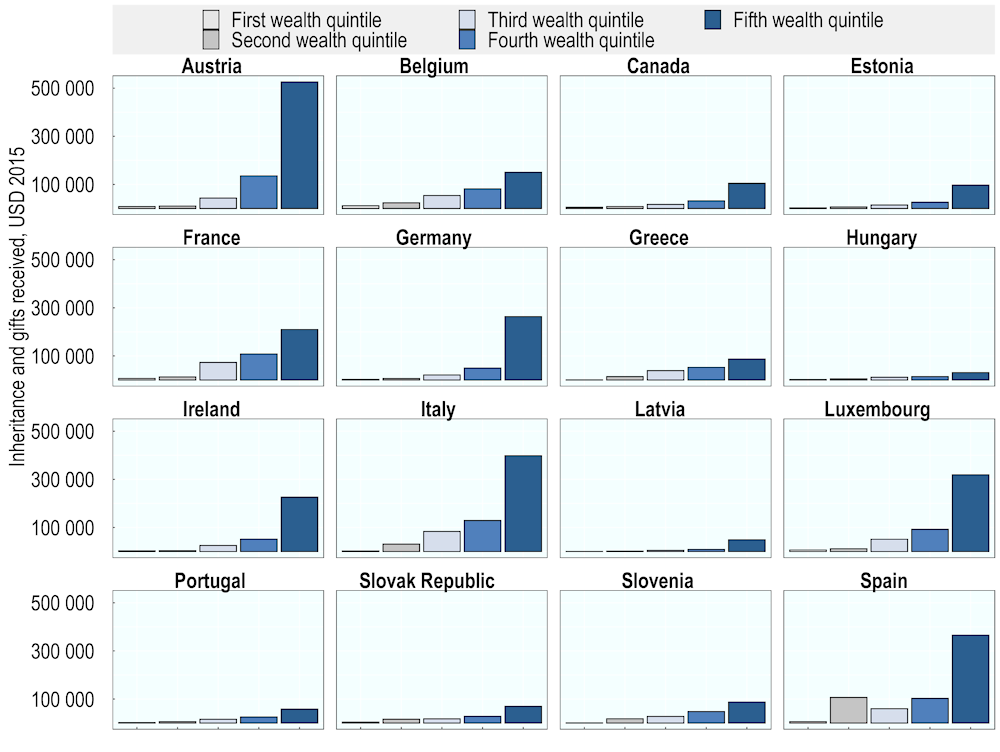
The average value of inheritances and gifts varies across countries, but is consistently higher for wealthier households. Across 16 OECD countries for which data are available, the average inheritance or gift received by households in the bottom wealth quintile ranged from USD 295 (Latvia) to USD 11 052 (Belgium). For households in the top wealth quintile, the average inheritance or gift ranged from USD 30 441 in Hungary to USD 525 879 in Austria. Wealthier households consistently report receiving a larger inheritance or gift than poorer households, but it is possible to distinguish two groups of countries in Figure 1.18. In the first group, the value of inheritances and gifts increases steadily with household wealth (Belgium, Canada, Estonia, France, Greece, Hungary, Latvia, Portugal, Slovak Republic, and Slovenia). In the second group, the average value of inheritances also increases steadily with household wealth until the fourth quintile, and then jumps by more than USD 170 000 for the fifth quintile (Austria, Germany, Ireland, Italy, Luxembourg, and Spain). In every country, average inheritances and gifts for households in the bottom four wealth quintiles were less than USD 140 000, while households in the top wealth quintile inherited more than USD 140 000 on average in half of the countries in Figure 1.18.
Figure 1.18. Value of inheritances received across the wealth distribution
2015 or latest available year
Note: Data were not available for Finland and the Netherlands. Data for Poland removed due to data issues. The value of past inheritances and gifts was converted to present values using an indicator that measures changes in asset prices between the year that the transfer took place and the survey year:
Capitalised (present) value of past transfers = Value at the time of the transfer × (Price index in present year ÷ Price index in year of transfer)
A share price index was derived from the OECD Macroeconomic Indicators Database for financial assets and a house price index was derived from the OECD Analytical Database or a comparable national source for non-financial assets. See (Balestra and Tonkin, 2018[2]) for more information.
Source: OECD Wealth Distribution Database, oe.cd/wealth, (Balestra and Tonkin, 2018[2]).
There may be several reasons why wealthy households are more likely to receive an inheritance or gift and why those wealth transfers are of greater value. First, households may have already been wealthy when they received an inheritance. Wealthy parents may raise wealthy children and grandchildren; investing financial resources and social capital in their descendants, thereby giving them the tools to build their own wealth prior to receiving an inheritance or gift. Evidence suggests that as well as gifts and bequests, earnings and education explain a (smaller) portion of the parent-child wealth correlation (Adermon, Lindahl and Waldenström, 2018[22]). Second, non-wealthy households may have used an inheritance or gift to build their wealth. Households that were wealthy at the time that they responded to the survey may not have been wealthy in the past, but used the inheritance or gift to grow their wealth. While Figure 1.17 shows a clear link between high wealth and having received a wealth transfer, identifying the extent to which these two factors drive that link is not possible with cross-sectional data.
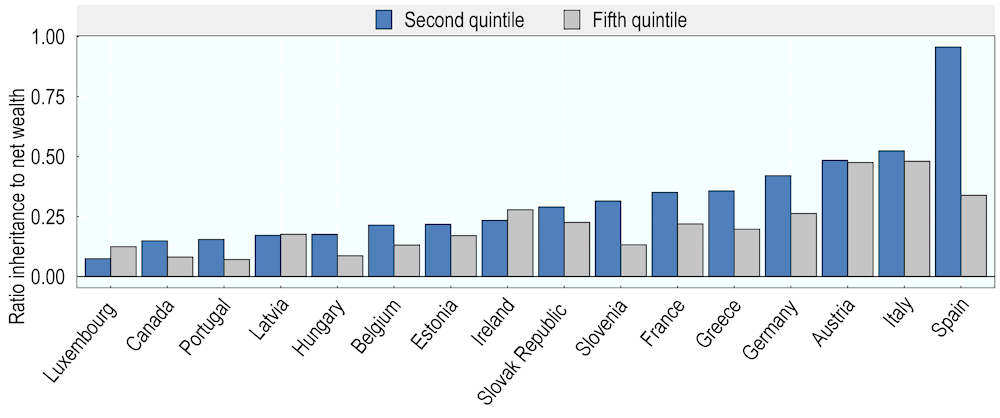
While lower-wealth households receive smaller inheritances and gifts, these are typically large as a share of net wealth. Research has questioned the impact of inherited wealth on relative wealth inequality, because even a small inheritance can be substantial relative to pre-inheritance wealth (Boserup, Kopczuk and Kreiner, 2016[23]; Elinder, Erixson and Waldenström, 2018[24]). Although Figure 1.18 shows wealthier households receiving larger inheritances and gifts, Figure 1.19 shows that inherited wealth as a portion of net wealth was larger for lower-wealth households, compared to households in the top wealth quintile. In 12 countries, inherited wealth was relatively more important for households in the second wealth quintile than for households in the fifth wealth quintile. Inheritances were largest in relative terms for households in the second wealth quintile in Spain (95.6% of net wealth), Italy (52.4%), and in Austria (48.4%) and smallest in Luxembourg (7.4%), Portugal (15.4%), and Latvia (17.2%). This indicates that small inheritances and gifts can have an equalising effect on wealth shares, at least in the short run (see Chapter 2).
Figure 1.19. Ratio of inherited wealth to net wealth, second and fifth wealth quintiles
2015 or latest available year
Note: Data were not available for Finland and the Netherlands. Data for Poland removed due to data issues. This graph shows the ratio of inherited wealth to net wealth for households in second and fifth quintiles, as households in the first quintile had negative wealth in several countries.
Source: OECD Wealth Distribution Database, oe.cd/wealth.
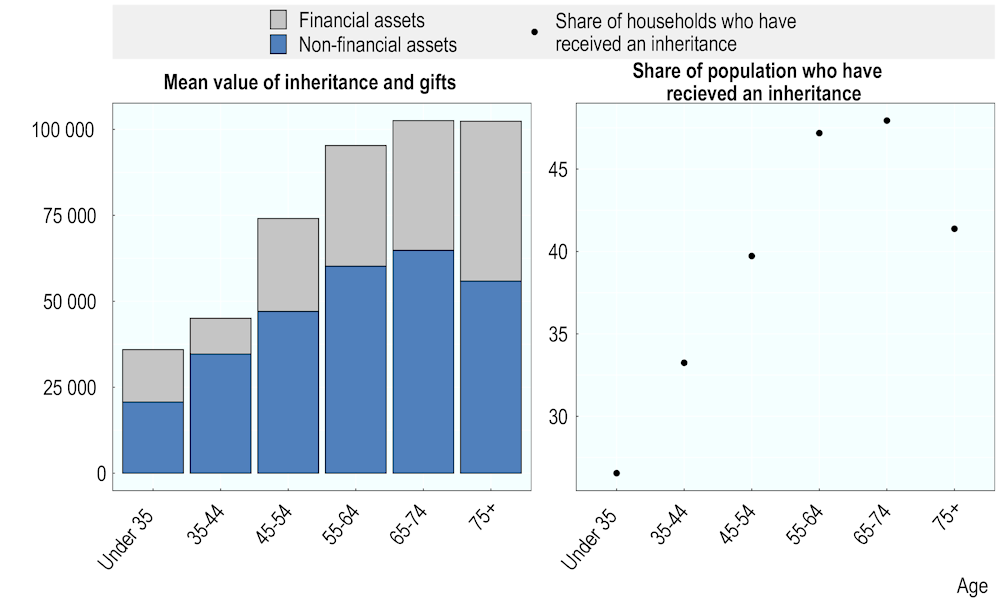
People are generally older when they inherit. The right panel of Figure 1.20 shows that the share of the population that has received an inheritance or gift increases with age, with the exception of households over the age of 75. This may reflect cohort effects; people who are currently over 75 will mostly have been raised by a generation that lived through World War I and may not have had the same opportunities to accumulate wealth. The left panel tells a similar story; among households that have received an inheritance or gift, the average value of the wealth transfer increases with age. Elinder, Erixson and Waldenström (2018[24]) find that a slight majority of heirs in Sweden (56%) are between 50 and 70 years old. Younger households may receive smaller wealth transfers as they may be composed more of gifts than inheritances (e.g. help with a home deposit or education expenses) or because they may inherit from people who are also younger and have accumulated less wealth.
Figure 1.20. Value of inheritances and share of population that have received an inheritance, by age, average 28 OECD countries
2015 or latest available year
In the future, the impacts of wealth transfers on inequality are likely to become increasingly significant challenges. Wealth transfers may increase in value, if recent trends in asset prices continue, and in number, with the baby-boom generation getting older. Moreover, as a result of longer life expectancies, wealth concentration among older cohorts and the age at which people inherit are expected to rise. While older generations have benefited from rising asset prices since the post-war period, recent highly expansionary monetary policy may also contribute to upward pressure on asset prices. These trends could further increase wealth inequality and widen the gap between, for instance, the older asset-owning generations and younger generations, who might face increasingly high housing prices. This inter-generational inequality may increase in future, as people inherit later in life. Because wealth is increasingly concentrated and wealthy households tend to receive more and higher value inheritances, intra-generational inequality is also likely to increase. Low fertility rates and smaller families may also mean that there are fewer close family members amongst whom wealth may be divided, so heirs receive a larger share of the donor’s estate.
References
[22] Adermon, A., M. Lindahl and D. Waldenström (2018), “Intergenerational Wealth Mobility and the Role of Inheritance: Evidence from Multiple Generations”, The Economic Journal, Vol. 128/612, pp. F482-F513, http://dx.doi.org/10.1111/ecoj.12535.
[7] Albers, T., C. Bartels and M. Schularick (2020), “The Distribution of Wealth in Germany, 1895-2018”, ECONtribute.
[20] Alvaredo, F., B. Garbinti and T. Piketty (2017), “On the Share of Inheritance in Aggregate Wealth: Europe and the USA, 1900–2010”, Economica, Vol. 84/334, pp. 239-260, http://dx.doi.org/10.1111/ecca.12233.
[2] Balestra, C. and R. Tonkin (2018), “Inequalities in household wealth across OECD countries: Evidence from the OECD Wealth Distribution Database”, OECD Statistics Working Papers, No. 2018/01, OECD, Paris, https://doi.org/10.1787/18152031.
[23] Boserup, S., W. Kopczuk and C. Kreiner (2016), “The Role of Bequests in Shaping Wealth Inequality: Evidence from Danish Wealth Records”, American Economic Review, Vol. 106/5, pp. 656–661, http://dx.doi.org/10.1257/aer.p20161036.
[10] Campanale, C. (2007), “Increasing returns to savings and wealth inequality”, Review of Economic Dynamics, http://dx.doi.org/10.1016/j.red.2007.02.003.
[8] Causa, O., N. Woloszko and D. Leite (2019), “Housing, wealth accumulation and wealth distribution: Evidence and stylized facts”, OECD Economics Department Working Papers, No. 1588, OECD Publishing, Paris, https://dx.doi.org/10.1787/86954c10-en.
[16] Dynan, K., J. Skinner and S. Zeldes (2004), “Do the Rich Save More?”, Journal of Political Economy, Vol. 112/2.
[24] Elinder, M., O. Erixson and D. Waldenström (2018), “Inheritance and wealth inequality: Evidence from population registers”, Journal of Public Economics, Vol. 165, pp. 17-30, http://dx.doi.org/10.1016/j.jpubeco.2018.06.012.
[12] Fatica, S. and D. Prammer (2017), “Working Paper Series Housing and the tax system: how large are the distortions in the euro area?”, Working Paper, No. 2087, ECB, http://dx.doi.org/10.2866/456421.
[18] Hood, A. and R. Joyce (2017), Inheritances and Inequality across and within Generations, Institute for Fiscal Studies.
[11] Household Finance and Consumption and Network (2016), The Household Finance and Consumption Survey: results from the second wave, http://dx.doi.org/10.2866/177251.
[4] Hviid, S. and A. Kuchler (2017), “Consumption and savings in a low interest-rate environment”, Danmarks Nationalbank, Copenhagen, http://hdl.handle.net/10419/171810www.econstor.eu.
[6] Joyce, R., T. Pope and B. Roantree (2019), The characteristics and incomes of the top 1%.
[3] Kennedy, S. (2019), “The potential of tax microdata for tax policy”, Taxation Working Papers, No. 45, OECD Publishing, Paris.
[17] McKee, K. (2012), “Young People, Homeownership and Future Welfare”, Housing Studies, Vol. 27/6, pp. 853-862, http://dx.doi.org/10.1080/02673037.2012.714463.
[15] OECD (2019), Pensions at a Glance 2019: OECD and G20 Indicators, OECD Publishing, Paris, https://dx.doi.org/10.1787/b6d3dcfc-en.
[9] OECD (2019), Under Pressure: The Squeezed Middle Class, OECD Publishing, Paris, https://dx.doi.org/10.1787/689afed1-en.
[13] OECD (2018), Taxation of Household Savings, OECD Tax Policy Studies, No. 25, OECD Publishing, Paris, https://dx.doi.org/10.1787/9789264289536-en.
[1] OECD (2013), OECD Guidelines for Micro Statistics on Household Wealth, OECD Publishing, Paris, https://dx.doi.org/10.1787/9789264194878-en.
[21] Piketty, T. (2011), “On the long run evolution of inheritance: France 1820‒2050”, Quarterly Journal of Economics, Vol. 126, pp. 1071-1131.
[19] Piketty, T. and G. Zucman (2015), “Wealth and Inheritance in the Long Run”, in Handbook of Income Distribution, http://dx.doi.org/10.1016/B978-0-444-59429-7.00016-9.
[14] Rosen, H. (1985), “Housing Subsidies: Effects on Housing Decisions, Efficiency, and Equity”, in Auerbach, A. and M. Feldstein (eds.), Handbook of Public Economics, Elsevier Science Publishers B. V., North-Holland.
[5] Schröder, C. et al. (2020), “Millionaires under the Microscope: Data Gap on Top Wealth Holders Closed; Wealth Concentration Higher than Presumed”, DIW Weekly Report, Vol. 10, http://dx.doi.org/10.18723/diw_dwr:2020-30-1.
Notes
← 1. Dollar values are reported in 2015 USD. Data were obtained from Balestra and Tonkin (2018[2]) and from in-house calculations. Wealth values have first been expressed in a common year (2011) through consumer price indices and then converted into USD through the use of purchasing power parities for household consumption. The combined dataset was updated to 2015 terms.
← 2. As in several OECD countries, the high ratio of mean liabilities to mean gross wealth may be linked to changes in housing prices, including households with negative housing equity.
← 3. Some cross-country variation may be due to differences in data sources (e.g. administrative data or household surveys) and differences in oversampling of high-wealth households. Balestra and Tonkin (2018[2]) do not find a significant link between oversampling of wealthy households and differences between the WDD and other wealth databases, suggesting that the degree of oversampling does not systematically bias cross-country differences in top wealth shares.
← 4. Austria, Belgium, Cyprus, Estonia, Finland, France, Germany, Greece, Ireland, Italy, Latvia, Luxembourg, Malta, Netherlands, Portugal, Slovakia, Slovenia, and Spain.
← 5. See Statistics Netherlands Statistical Trends, December 2020, Chapter 3, https://www.cbs.nl/nl-nl/longread/statistische-trends/2020/pensioenvermogen-en-vermogensongelijkheid/3-resultaten (Dutch).
← 6. The replacement rate assumes that a worker enters labour market at age 22, earns an average wage throughout their career, and retirees at the normal retirement age. Factors such as higher retirement ages, meaning longer contribution periods, raise the replacement rate. The high replacement rate modelled for Italy is driven by one of the highest minimum retirement ages (71 years with the current pre-COVID-19 demographic projections).
← 7. Wealth and Assets Survey (WAS) undertaken by the United Kingdom Office for National Statistics. Results are summarised by the Resolution Foundation: https://www.resolutionfoundation.org/app/uploads/2019/12/Who-owns-all-the-pie.pdf, accessed 14 January 2021.
← 8. An inheritance is a transfer of assets in connection with death of a decedent, while a gift is a transfer of assets made during the life of a donor, not connected to the death of that person.
