This chapter provides an analysis of new competition enforcement variables that have been included in the OECD CompStats: the number of cartel decisions that related to bid-rigging and the number of cartel and abuse of dominance decisions by industry.
OECD Competition Trends 2023
OECD Competition Trends

3. New variables: bid-rigging and industry-analysis
Abstract
The OECD CompStats questionnaire included three new questions in 2021. One question determined the number of cartel decisions that related to bid-rigging, while the other two new questions identified the number of cartel and abuse of dominance decisions by industry. This chapter presents an analysis of these new variables.
Bid-rigging cases are most common in Asia-Pacific
The competition authorities in the CompStats jurisdictions took a total of 182 cartel decisions in 2021 that concerned bid-rigging. This represents 34% of all cartel decisions from the CompStats database in that year (537). On average, there were 2.5 bid-rigging cases per jurisdiction.
Figure 3.1. Average number of cartel and bid-rigging decisions in 2021
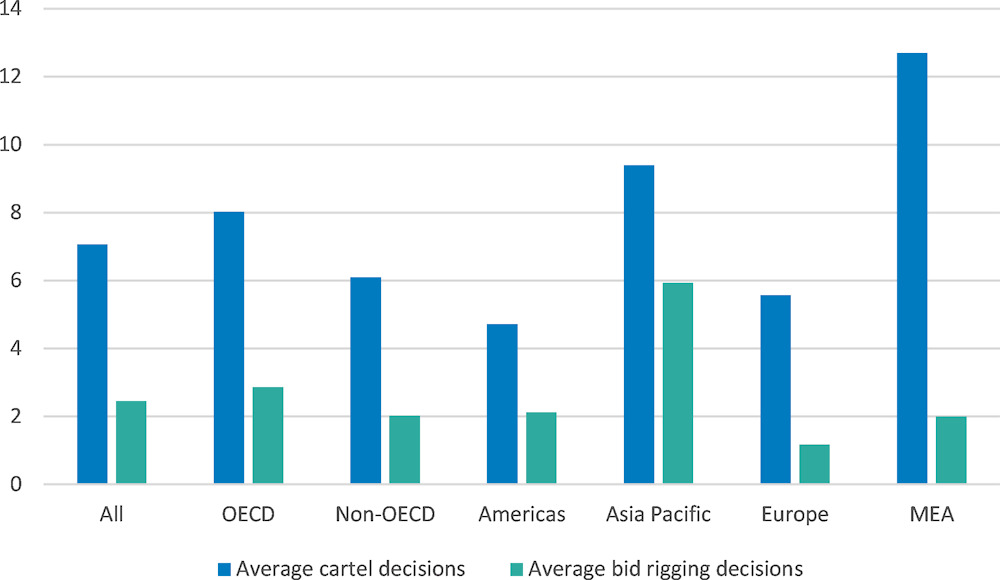
Note: Data based on the 74 jurisdictions in the OECD CompStats database that provided comparable data for all seven years.
Source: OECD CompStats database.
The focus on bid-rigging decisions was most prevalent in Asia-Pacific in 2021 (63% of cartel decisions in the region), while MEA was the region with the lowest percentage (16%). Europe and the Americas were in between both extremes, the percentage in the America (40%) was almost twice as high as in Europe (21%). There were 89 in Asia-Pacific (an average of 5.9 per jurisdiction), 39 in Europe (an average of 1.2 per jurisdiction), 34 in the Americas (an average of 2.1 per jurisdiction), and 20 in MEA (an average of 2.0 per jurisdiction).
Figure 3.2. Proportion of total cartel decisions that involved bid-rigging, 2021
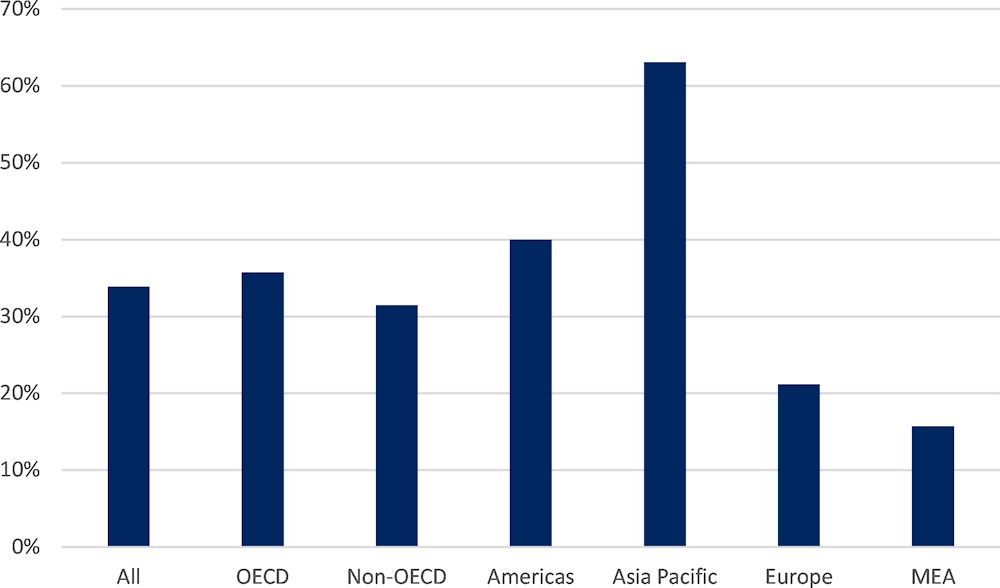
Note: Data based on the 74 jurisdictions in the OECD CompStats database that provided comparable data for all seven years.
Source:
Manufacturing seems most prone to cartels, while ICT had the most abuse of dominance decisions
In 2021, competition authorities in CompStats jurisdictions took 428 cartel decisions and 222 abuse of dominance decisions. Competition authorities classified these decisions by industry, using two‑digit NAICS codes, depending on the industry (or industries) that were affected by each decision. An analysis of the industries affected by the cartels or abuse of dominance in CompStats jurisdictions in 2021 has led to some interesting observations and confirmed earlier findings.1
While manufacturing was the industry with most cartel decisions (79 cartel decisions in 2021, which represents almost 18% of total cartel decisions), followed by construction (69 cartel decisions, representing almost 16% of total cartel decisions), competition authorities participating in CompStats took most abuse of dominance decisions in the ICT industry (34 decisions, representing 15% of all abuse of dominance decisions).
When looking closer at the different jurisdictions, regional differences exist. With respect to cartel decisions, manufacturing was the most common industry in Americas and MEA (representing 28% of cartel decisions in each region). In Europe, the industry with the most cartel decisions was wholesale trade (21% of all cartel decisions in the region), and in Asia-Pacific it was construction (29% of the cartel decisions in the region).
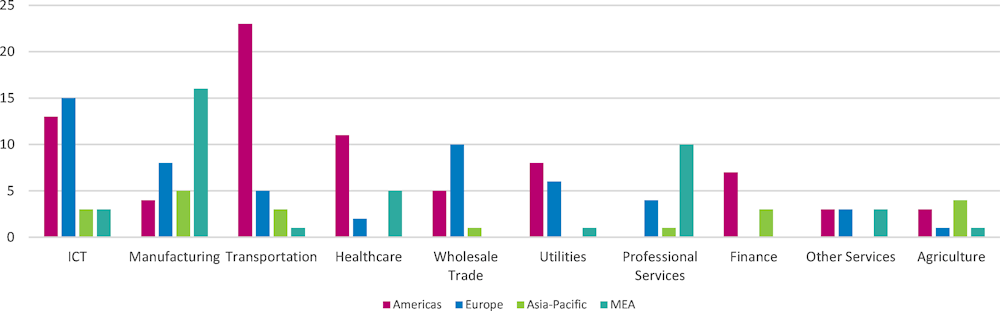
As for abuse of dominance decisions, transportation and warehousing was the industry with the most decisions in the Americas (26% of the abuse of dominance decisions in the region), ICT in Europe (23%), and manufacturing in Asia-Pacific and MEA (24% and 33%, respectively).
Figure 3.3. Number of cartel decisions per industry, 2021
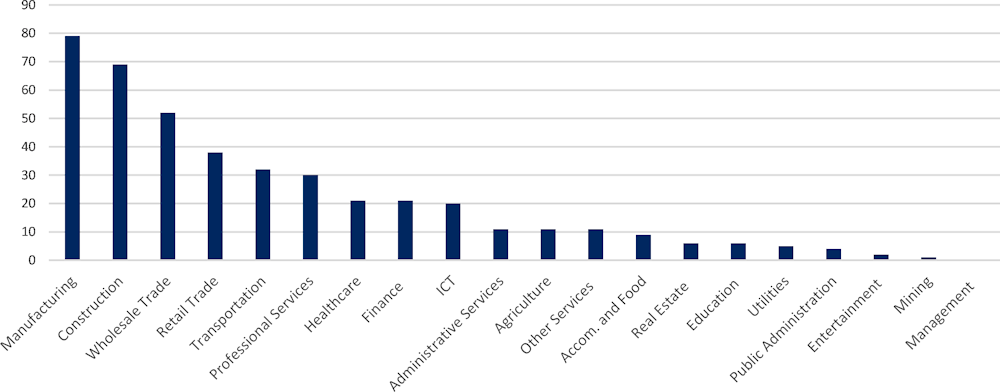
Note: Decisions by industry were classified according to two‑digit NAICS codes. Their correspondence with the legends in this graph is as follows: 11 – agriculture, 21 – mining, 22 – utilities, 23 – construction, 31‑33 – manufacturing, 42 – wholesale trade, 44‑45 – retail trade, 48‑49 – transportation, 51 – ICT, 52 – finance, 53 – real estate, 54 – professional services, 55 – management, 56 – administrative services, 51 – education, 62 – health care, 71 – entertainment, 72 – Accom. And food, 81 – other services, and 92 – public administration. Data based on the 75 jurisdictions in the OECD CompStats database that provided comparable data for all seven years.
Source: OECD CompStats database.
Figure 3.4. Number of cartel decisions per industry (top 10 industries) by region, 2021
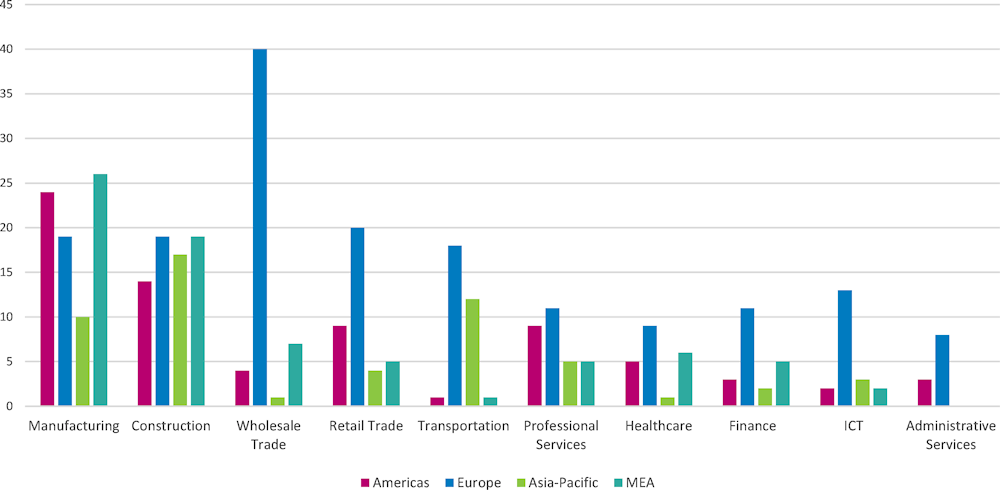
Note: Decisions by industry were classified according to two‑digit NAICS codes. Their correspondence with the legends in this graph is as follows: 11 – agriculture, 21 – mining, 22 – utilities, 23 – construction, 31‑33 – manufacturing, 42 – wholesale trade, 44‑45 – retail trade, 48‑49 – transportation, 51 – ICT, 52 – finance, 53 – real estate, 54 – professional services, 55 – management, 56 – administrative services, 51 – education, 62 – health care, 71 – entertainment, 72 – Accom. And food, 81 – other services, and 92 – public administration. Data based on the 75 jurisdictions in the OECD CompStats database that provided comparable data for all seven years.
Source: OECD CompStats database.
Figure 3.5. Number of abuse of dominance decisions by industry, 2021
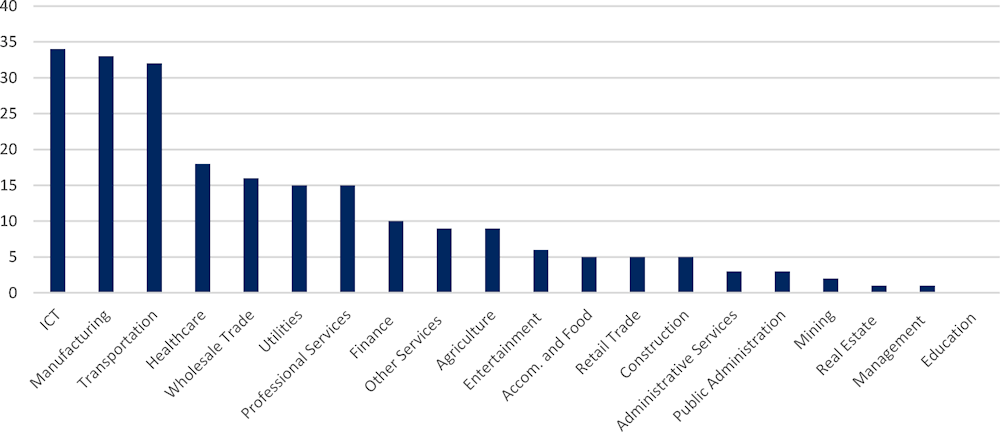
Note: Decisions by industry were classified according to two‑digit NAICS codes. Their correspondence with the legends in this graph is as follows: 11 – agriculture, 21 – mining, 22 – utilities, 23 – construction, 31‑33 – manufacturing, 42 – wholesale trade, 44‑45 – retail trade, 48‑49 – transportation, 51 – ICT, 52 – finance, 53 – real estate, 54 – professional services, 55 – management, 56 – administrative services, 51 – education, 62 – health care, 71 – entertainment, 72 – Accom. And food, 81 – other services, and 92 – public administration. Data based on the 73 jurisdictions in the OECD CompStats database that provided comparable data for all seven years.
Source: OECD CompStats database.
Figure 3.6. Number of abuse of dominance decisions per industry (top 10 industries) by region, 2021
Note: Decisions by industry were classified according to two‑digit NAICS codes. Their correspondence with the legends in this graph is as follows: 11 – agriculture, 21 – mining, 22 – utilities, 23 – construction, 31‑33 – manufacturing, 42 – wholesale trade, 44‑45 – retail trade, 48‑49 – transportation, 51 – ICT, 52 – finance, 53 – real estate, 54 – professional services, 55 – management, 56 – administrative services, 51 – education, 62 – health care, 71 – entertainment, 72 – Accom. And food, 81 – other services, and 92 – public administration. Data based on the 73 jurisdictions in the OECD CompStats database that provided comparable data for all seven years.
Source: OECD CompStats database.
Note
← 1. See, for instance, the OECD Roundtable (2015) on Serial Offenders: Why Some Industries Seem Prone to Endemic Collusion.