This chapter presents the latest data on the share of US adults who identify as LGBTI+ and delves into information on their geographic location and demographics, including sex assigned at birth, age, race/ethnicity, family structure, and educational attainment. Over the past decade, the percentage of US adults who identify as LGBTI+ has nearly doubled, reaching 11.2% (or nearly 30 million) in 2023. LGBTI+ self-identification is more commonly reported in accepting neighbourhoods, as well as among individuals assigned female at birth, young people, and Whites. LGBTI+ adults are less likely to live with a partner or in a household with children. Historically, non-cisgender individuals have faced educational disadvantages, and this trend is now also emerging among younger generations of cisgender individuals who identify as non-heterosexual. This chapter explores the reasons for these disparities, beyond documenting them.
The Economic Case for Greater LGBTI+ Equality in the United States
2. Who are LGBTI+ Americans?
Abstract
Who are LGBTI+ individuals?
LGBTI+ is the acronym for “lesbian, gay, bisexual, transgender and intersex”. LGBTI people are defined with respect to three distinct features: sexual orientation; gender identity; and sex characteristics. The “plus” (+) leaves the demographic category open ended to acknowledge additional sexual orientations and gender identities that are not explicitly present in the acronym. LGBTI+ individuals are also referred to by the umbrella term “queer people”.1
Sexual orientation
Sexual orientation allows for differentiating between heterosexuals, lesbians, gay men and bisexuals. It is indicative of a person’s capacity for emotional and/or sexual attraction to different-gender, same‑gender individuals, or both different- and same‑gender individuals. In this context, the “plus” refers to additional sexual orientations, such as “asexual” (lacking emotional and/or sexual attraction to anyone), “pansexual” (considering gender as irrelevant in determining whether one will be emotionally or sexually attracted to someone), among others.
Gender identity
Gender identity refers to a person’s internal sense of being masculine, feminine, androgynous or neither, regardless of sexual orientation. For individuals for whom gender identity corresponds to their biological sex, that is individuals assigned male at birth (AMAB) or individuals assigned female at birth (AFAB), the Latin prefix cis (“on this side of”) is used to define them as “cisgender”. For those where this is not the case, the Latin prefix trans (“on the other side of”) is used to define them as “transgender”. A transgender person can be: i) a transgender man (a person who was assigned female at birth but whose gender identity is male); or ii) a transgender woman (a person who was assigned male at birth but whose gender identity is female). In this context, the “plus” refers to additional gender identities, such as “non-binary” (a person who was assigned either female or male at birth but whose gender identity refers to a combination of these genders), “agender” (not identifying as having a gender), “gender fluid” (not identifying as having a fixed gender), among others.
Sex characteristics
Sex characteristics refer to chromosomal patterns, hormonal structures, reproductive organs and sexual anatomy that determine an individual’s biological sex. Sex characteristics are sometimes ambiguous in comparison to medical standards rooted in binary concepts of “male” and “female”. An individual whose sex characteristics are neither wholly female, nor wholly male is called “intersex”. Due to this non-binary pattern, and although being intersex is distinct from a person’s sexual orientation or gender identity, intersex individuals are over-represented among the LGBT population (Medina and Mahowald, 2021[1]; Rosenwohl-Mack et al., 2020[2]; Jones et al., 2016[3]) – this explains why the letter “I” is typically added to the LGBT acronym to include intersex people. Importantly, being intersex is not a pathological condition, and rarely is life‑threatening (Fundamental Rights Agency, 2015[4]).
Notes:
1. Consistent with its primary meaning to depict something strange, odd, or eccentric, the word “queer” began to be used in the early 1990s to refer to an identity that challenges normative ideas about sexuality and gender (after decades of colloquial use to refer to men who are sexually attracted to men). From the early 2000s, this word was increasingly used as an umbrella term to reflect the spectrum of sexual orientations and gender identities covered by the LGBTI+ acronym. While “queer” was frequently derogatory in the past, this word has been reclaimed by non-heterosexual and non-cisgender individuals, to describe themselves in a positive way. It is thus to be understood nowadays as an affirming word that is inclusive of all people in the rainbow acronym.
2.1. Introduction and main findings
Although the road to LGBTI+ equality sometimes takes us backwards, there has been a well-documented overall shift towards greater acceptance of homosexuality over the past decades, both in OECD countries and beyond (OECD, 2019[7]; Flores, 2019[8]).1 Consistent with this evolution, receptiveness to LGBTI+ individuals has improved across the United States (Jones et al., 2019[9]; Flores and Barclay, 2015[10]). This cultural change has gone hand in hand with enhanced recognition of LGBTI+ rights (OECD, 2020[5]; Movement Advancement Project, 2020[11]). In 2019, OECD countries were more than halfway to achieving full legal acceptance of LGBTI+ individuals – a sixfold increase from the late 1970s when less than 10% of essential laws for LGBTI+ inclusion had been enacted. Since then, there has been continued progress, with several countries passing legal measures viewed as ground-breaking, such as nationwide bans on conversion therapies that no OECD country had implemented by 2019. The United States is no exception. For instance, on 26 June 2015, the U.S. Supreme Court granted nationwide legal access to same‑sex marriage, and labour market discrimination based on sexual orientation and gender identity has been illegal nationwide since 2020. However, this broadening of rights has recently sparked backlash, particularly against non-cisgender individuals. In the first eight months of 2023 alone, legislators introduced 550 bills to ban gender-affirming care for LGBTI+ youth, with over 80 of these bills becoming law (Human Rights Campaign Foundation, 2023[12]).
While it is crucial to assess the disparities to advance LGBTI+ equality further, population-based estimates of individuals who self-identify as LGBTI+ are still rare. As of 2023, only two OECD countries have included a question about sexual orientation and/or gender identity in their censuses. For the latter category, respondents have the option to indicate a gender identity different from their sex assigned at birth (OECD, 2023[13]). Canada introduced this question on gender identity in 2021. In the same year, the United Kingdom added questions on both sexual orientation (for Great Britain and Northern Ireland) and gender identity (for Great Britain only). Despite not being one of these countries, the United States has recently been active in bridging the data gap which has thus far hindered comprehensive estimates of the size of the LGBTI+ population and of their situation, especially with the introduction in 2021 of questions allowing respondents to self-identify as LGBTI+ in the Census Bureau’s Household Pulse Survey. The United States is also distinctive by the fact that nationally representative information on self-identified LGBTI+ adults had already been collected prior to 2021, although not by the Census Bureau, but by the global analytics and advisory firm Gallup.2
Chapter 2 offers an in-depth look at the LGBTI+ population in the United States, drawing from these two sources. It begins by presenting the latest estimates of adults who self-identify as LGBTI+ and traces their evolution over the past decade. The chapter then delves into the spatial distribution of this population, followed by comparisons based on key demographic characteristics: sex assigned at birth, age, race and ethnicity, family structure, and educational attainment.
Main findings
LGBTI+ individuals in the United States represent a sizeable and growing minority.
As of 2023, 11.2% of adults, or nearly 30 million people, self-identified as LGBTI+ – a number surpassing the populations of New York or Florida.
Among the LGBTI+ population, individuals who identify as cisgender and non-heterosexual are nearly four times more represented (8.9%) than those who identify as non-cisgender (2.3%).
Within the former group, the largest subgroup are bisexuals (4.5%), followed by gays/lesbians (2.9%) and by other non-heterosexuals (1.5%).
As for non-cisgender individuals, 0.9% of US adults self-identify as transgender, and 1.4% as other non-cisgender identity (e.g. non-binary).
Consistent with improving social and legal acceptance that encourages non-heterosexual and non-cisgender persons to “come out of the closet”, the share of adults who self-identify as LGBT has almost doubled between 2012 and 2022.
The share of self-identified LGBTI+ adults varies substantially across US regions, states, and rural/urban areas. This pattern reflects geographic disparities in social acceptance and legal protections of LGBTI+ individuals, as LGBTI+ adults are more likely to relocate to more accepting neighbourhoods and might also feel more comfortable disclosing their LGBTI+ status in these areas.
Individuals assigned female at birth (AFAB) are more likely to identify as LGBTI+ than those assigned male at birth (AMAB), a gap that has widened in the past decade.
These disparities likely flow from greater social acceptance of women expressing same‑sex attraction or relationships compared to men, as well as from females’ more positive attitudes towards LGBTI+ individuals.
The widening of this gap over time probably mirrors strides made in gender equality, hence a departure from traditional roles and expectations placed upon women, including the pressure to adhere to heteronormativity and to be feminine.
LGBTI+ self-identification decreases with age, with the recent surge in LGBTI+ identification largely driven by younger generations.
In 2023, nearly one in four young adults (18‑34) identified as LGBTI+, compared to nearly one in ten among prime age adults (35‑54) and one in 20 among older mature adults (55+).
The rising proportion of young adults identifying as LGBTI+ does not seem to be driven by an age effect, which would entail that, for younger generations, self-identifying as LGBTI+ is a fad that ceases once they grow older. Rather, it appears to flow from a cohort effect: raised in more accepting environments, young LGBTI+ adults feel more comfortable disclosing who they are.
Consequently, the share of self-identified LGBTI+ adults will likely continue to grow in the future, assuming social and legal acceptance further improves.
LGBTI+ self-identification varies widely by race and ethnicity.
Relative to non-Hispanic Whites, a smaller share of non-Hispanic Blacks and Asians identify as LGBTI+, presumably due to the more negative attitudes towards LGBTI+ individuals that prevail within these populations as well as to a “double minority stress” effect.
The share of self-identified LGBTI+ adults is higher among Hispanic Americans compared to non-Hispanic Whites and has seen the greatest increase within this group. However, this pattern is predominantly driven by the younger average age of the Hispanic population.
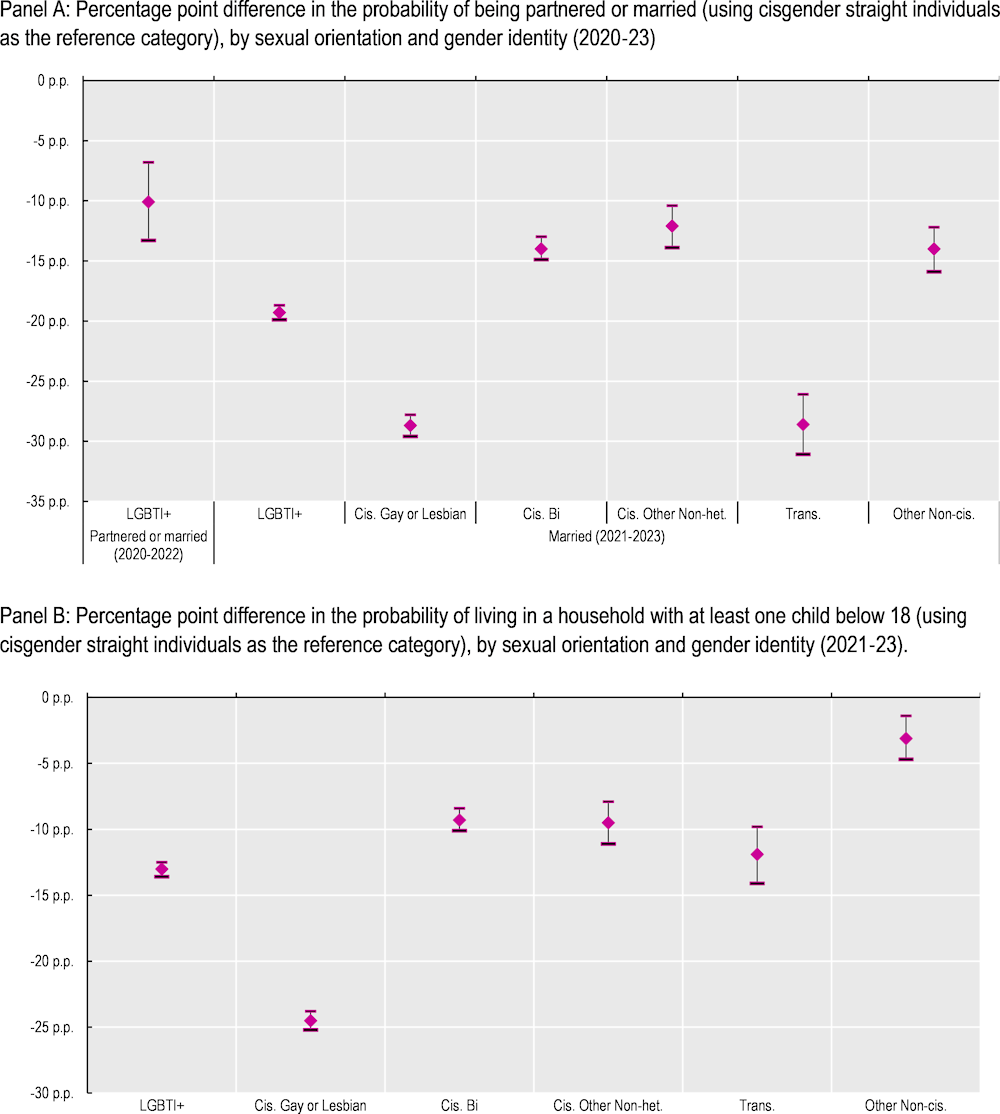
LGBTI+ adults are less likely to be partnered or married, and to live in a household with children.
These gaps are significant across all LGBTI+ subgroups, with cisgender gay males facing the most significant disparity in family structure.
In the past decade, partnership and marriage rates of LGBTI+ individuals have shown modest signs of convergence with those of their non-LGBTI+ peers, reflecting improved attitudes towards LGBTI+ individuals and the legalisation of same‑sex marriage in 2015 by the U.S. Supreme Court, as well as the advent of the internet and dating apps.
Disparities in the likelihood of LGBTI+ becoming parents have remained stable, possibly indicating limited access to adoption, assisted reproductive technology, and surrogacy, due to a combination of legal, financial, and discriminatory barriers.
Historically, non-cisgender individuals have faced educational disadvantages, and this trend is now emerging among younger generations of cisgender individuals who identify as non-heterosexual. Among the latter group, cisgender lesbian females have experienced the most significant decline in college attainment across age groups, while cisgender gay males are the only subgroup with a consistent (albeit decreasing) college attainment advantage.
The persistent educational penalties faced by non-cisgender individuals across age groups likely stem from a challenging school environment, exclusionary behaviours exhibited by parents and other family members, and mental health struggles, particularly those arising from stigma but also, in the specific case of non-cisgender individuals, gender dysphoria.
While several of these negative factors undoubtedly impact cisgender LGB+ individuals too, the educational premium observed for prime age and mature cisgender LGB+ adults may result from a non-disclosure bias that outweigh these factors’ detrimental impact. Historically, lower-educated LGBTI+ adults have tended to refrain from openly identifying as LGBTI+ relative to their higher-educated peers.
As social and legal acceptance have steadily improved, the impetus for cisgender LGB+ individuals to invest more in education has likely diminished, thereby yielding an erosion of the educational attainment premium among younger generations. In addition, a greater number of lower-educated LGBTI+ individuals might now feel empowered to “come out of the closet”, meaning that the non-disclosure bias observed among older generations is progressively losing ground. The more pronounced decline for cisgender lesbian females could be attributed to their reduced motivation to challenge patriarchal norms as gender equality advances. Additionally, those perceived as gender atypical might face an additional obstacle in an environment where personal characteristics traditionally viewed as “feminine” are deemed more conducive to academic success than stereotypically masculine traits.
2.2. How many US adults self-identify as LGBTI+?
Large‑scale, nationally representative surveys that include questions on respondents’ sexual orientation and gender identity are critical to produce a reliable count of the population that self-identifies as non-heterosexual and/or non-cisgender.
2.2.1. Sources of data
Two sources allow estimating the size of the LGBTI+ adult population in the United States: the Census Bureau’s Household Pulse Survey and the surveys that Gallup has been conducting since 2012.
2.2.2. The Census Bureau’s Household Pulse Survey
The U.S. Census Bureau, the federal government’s largest statistical agency, does not currently include questions on sexual orientation and/or gender identity in its long-standing demographic surveys, such as the Decennial Census, the American Community Survey (ACS), and the Current Population Survey (CPS).3 These surveys do contain information about marital status and living arrangements, enabling the identification of same‑sex couples (Badgett, Carpenter and Sansone, 2021[14]; Black et al., 2000[15]). Yet, this subgroup only captures a small non-representative fraction of the LGBTI+ population (Deng and Watson, 2023[16]). As for other mainstream nationally representative surveys conducted by public institutions, none offer comprehensive insights into the LGBTI+ population, such as its size or key characteristics. While a dozen of nationally representative surveys have collected data on sexual orientation, only a few have delved into gender identity. Yet, even when both aspects are addressed, the focus typically narrows to specific areas like health, education, or crime. Importantly, no nationally representative surveys have ventured into collecting data on variations in sex characteristics or on intersex status (National Science and Technology Council, 2023[17]).
In this context, the launch in April 2020 of the Census Bureau’s Household Pulse Survey (HPS) constitutes a breakthrough. The HPS is an experimental probability-based nationally representative Census survey designed to provide near-real time data on how the COVID‑19 pandemic has impacted households across the United States from a social and economic perspective. Beginning in July 2021, three questions related to LGBTI+ status were added: sex assignment at birth, gender identity, and sexual orientation (see Box 2.1 for more details about the HPS). Thus, the HPS data offer the first large‑scale, nationally representative sample of both non-heterosexual and non-cisgender American adults, encompassing 155 447 LGBTI+ individuals between 21 July 2021 and 10 July 2023. Throughout this report, the average demographic characteristics and socio‑economic outcomes of LGBTI+ adults are analysed separately for the following subgroups: i) cisgender non-heterosexuals, i.e. cisgender gays/lesbians, cisgender bisexuals, and cisgender other non-heterosexual individuals); and ii) non-cisgender adults, i.e. transgender and other non-cisgender individuals. The decision to group both non-cisgender heterosexual and non-cisgender non-heterosexual respondents together arises from challenges in categorizing non-cisgender individuals by sexual orientation. Some non-cisgender respondents may identify their sexual orientation based on their sex assigned at birth, while others might use their gender identity.4 Unfortunately, we cannot distinguish between these two reporting strategies.5
It is vital to note that, like other nationally representative US surveys with self-identified LGBTI+ questions, the HPS sample excludes institutionalised adults. This omission means that homeless individuals, those in medical institutions, incarceration facilities, or homeless shelters are not represented. Such exclusions might disproportionately affect LGBTI+ individuals, potentially underestimating the socio‑economic and health challenges they face (Carpenter, Lee and Nettuno, 2022[18]). This underestimation is likely to prevail even among the non-institutionalised population. The HPS is an online survey that necessitates to contact individuals via email or text message, thereby excluding individuals without an internet access or a phone number. Given their heightened economic vulnerability, LGBTI+ individuals might again be over-represented among these omissions (Martell and Roncolato, 2023[19]).
2.2.3. The US Gallup data
Although not conducted under the supervision of a public institution, data collection on both sexual orientation and gender identity based on probability sampling was already ongoing prior to 2021. This was done in the framework of three polls conducted by the Gallup corporation: between 2012 and 2017 as part of the Gallup US Daily Survey (2008‑17), between 2020 and 2022 in the context of the Gallup Poll Social Series (2001‑ongoing), and between April and October 2020 as an addition to the Gallup Panel – COVID‑19 Survey (2020‑ongoing). Box 2.2, Box 2.3, and Box 2.4 provide a detailed overview of these three US Gallup surveys.
Box 2.1. Zooming in on the Census Bureau’s Household Pulse Survey
The Census Bureau’s Household Pulse Survey (HPS) was launched in April 2020. It is a 20‑minute online survey aimed at assessing the social and economic impact of COVID‑19 on American households. The HPS is based on probability sampling using the US Census Master Address File. It is designed to ensure national representation of the US population and to produce, besides, reliable state‑level estimates as well as estimates for the 15 largest Metropolitan Statistical Areas (MSA) in the United States. Each randomly selected housing unit is contacted via email or text message using the provided contact information. The respondent is an adult member of the household, at least 18 years old, whose personal email or phone number was used for the outreach.
The HPS is part of the Census Bureau’s Experimental Data Product series. It was designed to have a low respondent burden and to be a short-turnaround instrument that provides valuable data to aid in the pandemic recovery. That said, the online nature of HPS – as opposed to telephone‑assisted or in-person methods – results in a relatively low response rate, approximately 6% between 2021 and 2023.1 An examination of the HPS’s early waves revealed that this aspect contributes to an underrepresentation of households with lower median incomes. Without correction, this selection bias could underestimate the economic challenges faced by LGBTI+ individuals, given consistent evidence pointing to a higher poverty rate within this group. However, this potential skew is addressed by the Census Bureau, which offers weights derived from the American Community Survey (ACS) demographic data for the sampling area. This adjustment compensates for the HPS’s low response rate, ensuring the data accurately represent adults aged 18 and above residing in households. After this weighting adjustment, the demographic and socio‑economic profiles of LGBTI+ adults align with findings from other surveys boasting higher response rates, such as Gallup, the National Health Interview Survey (NHIS), and the Behavioural Risk Factor Surveillance System (BRFSS).
Since July 2021, the survey asks three questions that permit the identification of non-heterosexual and/or non-cisgender individuals. Sexual orientation is measured using the question: “Which of the following best represents how you think of yourself?”, allowing participants to answer: i) “Gay or Lesbian”; ii) “Straight, that is not gay or lesbian”; iii) “Bisexual”; iv) “Something else, please specify”’; v) “I don’t know.” Gender identity is determined using a state‑of-the‑art two‑step approach. The first question is, “What sex were you assigned at birth, on your original birth certificate?”, with options: i) “Male”; ii) “Female”. The second question is, “Do you currently describe yourself as male, female, or transgender?”. The provided choices are: i) “Male”; ii) “Female”; iii) “Transgender”; iv) “None of these”. Respondents whose sex at birth and gender do not align receive an automated “confirmation check” question to verify that the reported answers are correct.
This report utilises data collected in Phases 3.2‑3.9, from 21 July 2021 to 10 July 2023. This dataset contains 1 648 098 respondents of which 155 447 self-identify as LGBTI+ (46 364 in 2023).
Note:
1. Low response rates are typical in online surveys, especially when compared to telephone and in-person surveys. This is particularly true when the surveys use probability sampling encompassing the entire national population, rather than targeting on a specific subgroup (Wu, Zhao and Fils-Aime, 2022[20]). Furthermore, the response rate is likely underestimated in the HPS since all non-interviews were considered valid non-responses. Yet, non-interviews include several instances where the contact information, whether an email address or a mobile phone number for text messages, was invalid. Additionally, in cases where emails were the sole mode of contact, they might have been sent directly to the spam folder, making them unnoticed by potential respondents. Furthermore, even when the contact details were accurate and the intended recipients received the email or text message, there’s a possibility that some perceived it as a scam.
Box 2.2. Gallup US Daily Survey (2008‑17) – information on LGBT status collected starting from 2012
The Gallup US Daily Survey was run between 2008 and 2017. It asked 1 000 US adults every day about various political, economic, and well-being topics. This survey was based on computer-assisted telephone interviews with randomly sampled respondents, aged 18 and above, including respondents from all 50 US states and the District of Columbia. Gallup conducted the survey using two different topical questionnaires: half of the respondents receive the Well-being track, while the other half receives the Politics and Economy track. The response rate averaged 9% for the Well-being track and 12% for the Politics and Economy track. Gallup provides weights to compensate for disproportionalities in selection probabilities and nonresponse. In addition, Gallup weights the data to match national and state‑level targets from the U.S. Census Bureau by age, sex, region, gender, education, ethnicity, and race, as well as population density of self-reported location. Gallup also weights the data to be representative of the US adult population.
In 2012 the following question was introduced at the end of the survey: “I have one final question we are asking only for statistical purposes. Do you, personally, identify as lesbian, gay, bisexual or transgender?”, with the following options: i) “Yes”; ii) “No”; iii) “Don’t know”. Before September 2014, the interviewer coded the gender of the respondent as either “Male” or “Female” based on the voice and other cues detected during the phone interview, which entails a significant risk of misgendering. Starting in September 2014, the survey included the following question: “I am required to ask, are you male or female?”, with answer categories i) “Male”; ii) “Female”. Of those who refused to answer, the interviewer coded the gender of the respondent based on the same cues as those used before September 2014, including voice. It is important to emphasise that the various methods used to determine a respondent’s gender produced consistent estimates for both (LGBT) males and (LGBT) females. When examining the percentage of female respondents in the four months before and after September 2014, there is no notable change following the introduction of the direct question. Likewise, the proportion difference between LGBT males and LGBT females remained consistent after September 2014.
This report utilises data from the Gallup US Daily Survey collected from 2012 to 2017. This dataset contains 2 114 755 respondents, of which 62 193 self-identify as LGBT.
Source: Gallup Inc.
Box 2.3. Gallup Poll Social Series (2001‑ongoing) – information on LGBTI+ status collected starting from 2020
The Gallup Poll Social Series (GPSS) has been conducted since 2001. It is a monthly telephone survey, with a unique set of 1 000 respondents, that also relies on probability-based sampling (random digit dialling). Each month is dedicated to a specific topic, designed to monitor US adults’ views on numerous social, economic, and political topics. Gallup also provides weights to make the sample nationally representative. Indeed, response rates have recently declined significantly in the Gallup Poll Social Series (as with other telephone surveys): on average, during 2020‑22, the response rate was 8%, compared with 28% in 1997 (Marken, 2018[24]).
In 2020 the following question was introduced: “Which of the following do you consider yourself to be?”. Respondents could select all options that apply, including: i) “Straight or heterosexual”; ii) “Lesbian”; iii) “Gay”; iv) “Bisexual”; v) “Transgender”; vi) “Don’t know”. Respondents were also allowed to volunteer another identity (e.g. queer, pansexual), which was recorded as “Other LGBT” by interviewers. Between 2020 and 2021, the gender of the respondent was identified through the following question that could only be answered in a binary way: “I am required to ask, are you male or female”. In 2022, respondents were given the possibility to also self-identify as “non-binary” (“I am required to ask, are you male, female or nonbinary”). Of those who refused to answer, the interviewer coded the gender of the respondent as “Male” or “Female” based on the voice, together with other cues gathered during the phone interview.
This report utilises data from the Gallup Poll Social Series collected from 2020 to 2022. This dataset contains 42 557 respondents, of which 1967 self-identify as LGBTI+.
Source: Gallup Inc.
Box 2.4. Gallup Panel – COVID‑19 Survey (2020‑ongoing) – information on LGBT status collected from April to October 2020
The Gallup Panel – COVID‑19 Survey is a web survey focusing on the impact of the COVID‑19 pandemic, which was launched in March 2020. The panel was originally designed based on probability sampling. Panel members receive an average of three surveys per month, and members remain in the panel for as long as they would like. Starting in August 2020, the survey moved from daily surveying to a survey conducted one time per month. Beginning in 2022, the survey moved to quarterly data collection. The average response rate in 2020 was 46%. Gallup provides weights to make the sample nationally representative.
From April to October 2020, participants were asked the following question “Do you, personally, identify as lesbian, gay, bisexual, or transgender?”, with the following options: i) “Yes”; ii) “No”. The gender of the respondent was identified through the question “What is your gender?”, which respondents could only answer in a binary way, by selecting either “male” or “female”.
Of course, moving further away from the survey’s inception date, its representativeness diminishes due to attrition. Therefore, this survey is not used in this report to estimate the size or demographics of the LGBTI+ population, but to discuss how the pandemic impacted LGBTI+ individuals during 2020 (Chapter 3).
This report utilises data from the Gallup Panel – COVID‑19 Survey collected from March to December 2020. This dataset contains 113 928 observations (42 955 respondents), of which 6 072 observations (2 364 respondents) self-identify as LGBT. Given the panel nature of the data, the LGBT status for respondents who had missing information in a specific survey wave month between March and December 2020 was imputed. This imputation was based on their responses from another month when the LGBT question was asked, and they provided a valid answer. Respondents who gave inconsistent answers to the LGBT question across months were excluded from the analysis.
Source: Gallup Inc.
2.2.4. Self-identified LGBTI+ adults
In 2023, 11.2% of American adults self-identified as LGBTI+, according to the Census Bureau’s Household Pulse Survey (Figure 2.1). This figure suggests that nearly 30 million of American adults self-identify as LGBTI+, more than the number of residents living in New York (19.6 million) or Florida (22.2 million).6 Among the LGBTI+ population, individuals who identify as cisgender and non-heterosexual are nearly four times more represented (8.9%) than those who identify as non-cisgender (2.3%). Within the former group, the largest subgroup are bisexuals (4.5%), followed by gays/lesbians (2.9%) and by other non-heterosexuals (1.5%). As for non-cisgender individuals, 0.9% of US adults self-identify as transgender,7 and 1.4% as other non-cisgender identity (e.g. non-binary).8 Box 2.5 provides a detailed description of how LGBTI+ respondents are identified in the data.
These estimates are close to those flowing from the 2nd edition of the biennial LGBT+ Pride Global Survey that IPSOS conducted online between February and March 2023 across 30 countries, based on opt-in panels (IPSOS, 2023[25]).9 According to this survey, 3% of American adults self-identified as gay/lesbians, 5% as bisexuals, and 1% as being part of another non-heterosexual group (i.e. pansexual/omnisexual). Moreover, 2% self-defined as transgender or as having another non-cisgender identity. Using a probability-based online survey conducted in May 2022, the Pew Research Center found estimates for the share of transgender and non-binary individuals which are in line with those provided by the Household Pulse Survey (HPS) and by the LGBT+ Pride Global Survey, although slightly lower since it didn’t measure additional non-cisgender identity beyond being transgender and non-binary: 0.6% of US adults self-identified as transgender and 1% self-identified as non-binary (Pew Research Center, 2022[26]).
Consistent with improving social and legal acceptance that encourages non-heterosexual and non-cisgender persons to “come out of the closet”, the share of individuals who self-identify as LGBTI+ is on the rise, with an increase of 0.8 percentage points (7.3%) between 2021 and 2023 according to the HPS, from 10.4% to 11.2% (Figure 2.2). This increase in self-reporting was driven by cisgender non-heterosexual adults. In contrast, the share of non-cisgender adults remained stable at 2.3%. This upward trend in self-reporting is even more striking when one focuses on a longer timeframe, hence on the Gallup survey data: the share of adults who self-identify as LGBT almost doubled between 2012 and 2022, rising from 3.5% to 6.9%. Similar increases have also been observed in other nationally representative surveys that include a question on sexual orientation (OECD, 2019[7]; Valfort, 2017[27]).10 Although not available for all US states, recent data from the Behaviour Risk Factor Surveillance System (BRFSS) survey also suggests that the number of adults who identify as transgender has remained roughly steady over time (Herman, Flores and O’Neill, 2022[28]).
The comparison of HPS and Gallup survey data confirms another recurring finding: estimates of the LGBTI+ population are significantly higher in surveys where respondents, rather than interviewers, answer the question about LGBTI+ status (OECD, 2019[7]; Valfort, 2017[27]). Even holding the survey year constant, the share of individuals who self-identify as LGBT is on average 18% higher in the HPS, which is a self-administered online survey, than in the Gallup Poll Social Series which rely on (computer-assisted) telephone interviewing. As many LGBTI+ adults are still closeted in several areas of their life (Folch, 2022[29]; Human Rights Campaign Foundation, 2018[30]), they may be reluctant to come out in surveys that guarantee neither enough privacy (not being able to observe respondents while they give their responses) nor enough anonymity (not being able to link their responses to their identifier) (Robertson et al., 2018[31]).
Yet, although it relies on a survey mode known to minimise non-disclosure by LGBTI+ individuals of who they are, estimates that flow from the HPS likely understate their actual share. Indeed, to measure sexual orientation, these estimates flow from questions that ask respondents to self-identify as heterosexual, homosexual or bisexual, not on questions that ask respondents to report their sexual behaviour (the gender of individuals with whom one has sexual intercourse) or their sexual attraction (the gender of individuals one feels sexually attracted to). However, sexual attraction is a more inclusive concept than sexual behaviour, which is itself more inclusive than sexual self-identification: not all people who feel sexually attracted to same‑gender people engage in same‑gender sexual behaviour, and not all people who engage in same‑gender sexual behaviour view themselves as non-heterosexual. Accordingly, the size of the LGB population is 70% larger when it is calculated based on individuals’ sexual behaviour (instead of individuals’ sexual identification), and more than twice as large when sexual attraction is taken as a criterion (OECD, 2019[7]). The downward bias of relying on self-identification to measure sexual orientation is compounded by the fact that LGB people are more likely to refrain from disclosing who they are if they are asked to self-identify as homosexual or bisexual, rather than specify the sex of the persons with whom they have sex or to whom they feel sexually attracted (Coffman, Coffman and Ericson, 2016[32]).11
Box 2.5. Identification of LGBTI+ respondents in our two data sources
The Census Bureau’s Household Pulse Survey (HPS) allows for determining the following subgroups:
Heterosexual (straight): respondents who answered “Straight, that is not gay or lesbian” on the sexual orientation question.
Non-heterosexual (LGB+) adults, which includes:
Gay/lesbian: respondents who answered “Gay or lesbian” on the sexual orientation question.
Bisexual (bi.): respondents who answered “Bisexual” on the sexual orientation question.
Other non-heterosexual (other non-het.): respondents who answered “Something else, please specify” on the sexual orientation question. The specific answers to this category (e.g. pansexual, or asexual) are not available in the Household Pulse Survey Public Use File (PUF).
Non-cisgender (non-cis.) adults, which includes:
Transgender (trans.): respondents who answered “Transgender” on the gender identity question, or respondents who reported a binary gender (male/female) different from their sex assigned at birth (male/female).1
Other non-cisgender (other non-cis.): respondents who answered “None of these” on the gender identity question, hence non-binary and agender individuals, among others.
In the HPS, the label “LGBTI+” thus encompasses respondents classified as gay/lesbian, bisexual, other non-heterosexual, transgender, and other non-cisgender.2 In contrast, the label “LGBT” specifically focuses on gay/lesbian, bisexual, and transgender respondents. Finally, the label “Cisgender non-heterosexual individuals (cis. LGB+)” refers to non-heterosexual respondents whose gender identity aligns with their sex assigned at birth.
Concerning the US Gallup data, they permit the identification of:
LGBT respondents for the period 2012‑17 and 2020‑22: these respondents are those who chose “Yes” in the LGBT identification question in the Gallup US Daily Survey (2012‑17) and “Lesbian”, “Gay”, “Bisexual”, and/or “Transgender” in the corresponding question in the Gallup Poll Social Series (2020‑22).
LGBTI+ respondents for the period 2020‑22: these respondents are those who answered “Lesbian”, “Gay”, “Bisexual”, “Transgender”, and/or “Other LGBT” in the LGBT identification survey question in the Gallup Poll Social Series (2020‑22). For the year 2022, this group also encompasses respondents who selected “non-binary,” an option introduced that same year to the survey’s gender identity question.
Notes:
1. During the post-data collection process, the missing information for “sex a birth” is imputed by the U.S. Census Bureau, a step essential for the creation of the survey weights. This imputation relies on a standard hot deck imputation method, which addresses missing data by replacing each missing value with an observed response from a geographically similar unit. Due to this imputation, there is a possibility that some respondents might be inaccurately categorised as transgender. Consequently, the analysis in this report is centred on the subset of respondents for whom “sex at birth” is not imputed (National Academies of Sciences, Engineering, and Medicine, 2022[33]).
2. Although the HPS data do not collect information about people with intersex traits, recent research has found that people with intersex traits report identifying as non-cisgender or non-heterosexual at higher rates than people who are not intersex (Medina and Mahowald, 2021[1]; Rosenwohl-Mack et al., 2020[2]; Jones et al., 2016[3]).
Figure 2.1. In 2023, 11.2% of US adults self-identified as LGBTI+
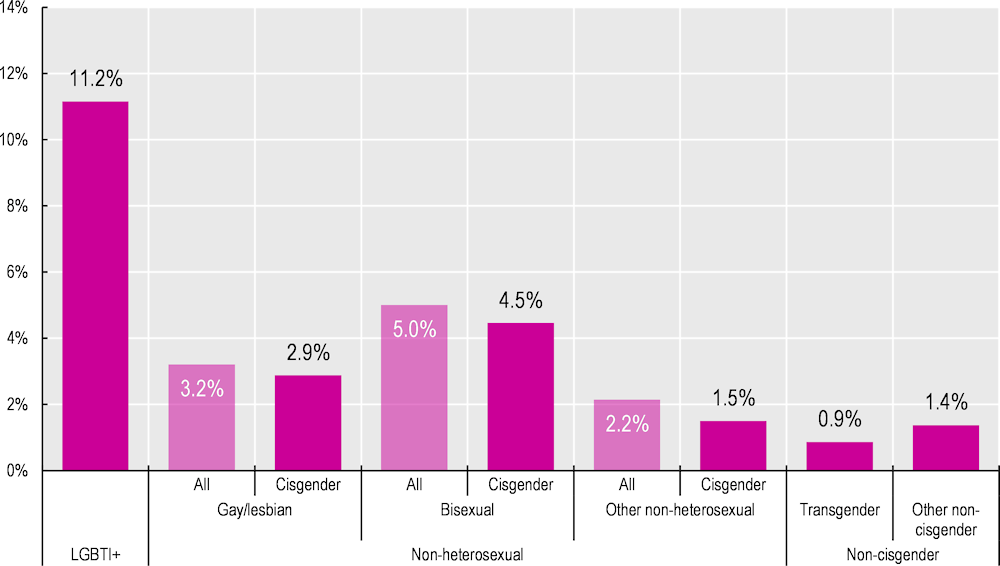
Note: LGBTI+ refers to respondents who self-identify as gay/lesbian, bisexual, transgender, other non-heterosexual, and other non-cisgender (see Box 2.5 for more details). Person-level weights used.
Source: Household Pulse Survey (4 January 2023 – 10 July 2023).
Figure 2.2. Self-reporting of LGBTI+ status is on the rise
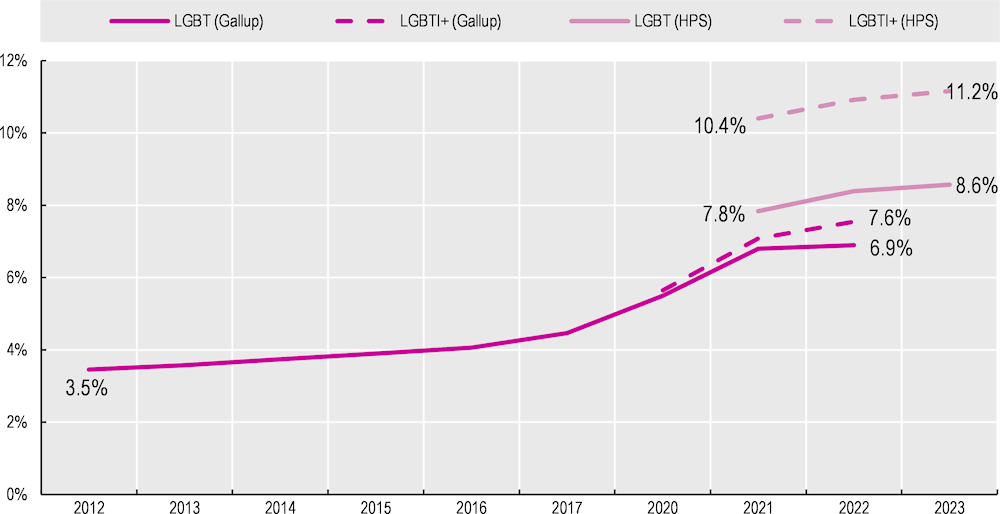
Note: LGBT refers to respondents who self-identify as gay/lesbian, bisexual, and transgender. LGBTI+ includes those who identify as other non-heterosexual and other non-cisgender (see Box 2.5 for more details). Person-level weights used.
Source: Gallup US Daily Survey (2012‑17), Gallup Poll Social Series (2020‑22), and Household Pulse Survey (21 July 2021 – 10 July 2023).
2.3. Where do self-identified LGBTI+ US adults live?
The share of self-identified LGBTI+ adults varies substantially across US regions, states, and rural/urban areas. In 2023, according to HPS data, US adults were 24% more likely to self-identify as LGBTI+ in the West, compared to the South (Panel A of Figure 2.3). Spatial disparities also prevail across US states, including within the same region. In the West, for instance, the share of self-identified LGBTI+ US adults varies by a factor of 1.8 across states, from 8.4% in Wyoming to 15.5% in Oregon (Panel B of Figure 2.3). Self-reporting of LGBTI+ status also differs between rural and urban areas, with the share being almost twice as high in the latter than in the former (Panel C of Figure 2.3).
These spatial disparities could be attributed to geographic variations in social acceptance and legal protections of LGBTI+ individuals and reflect two main channels.12 First, LGBTI+ adults may be inclined to relocate to more accepting neighbourhoods in order to escape discrimination and connect with a larger LGBTI+ community. Second, in such neighbourhoods, LGBTI+ individuals might feel more comfortable disclosing their sexual orientation and/or gender identity, both in surveys and other aspects of their lives.
Greater acceptance of LGBTI+ individuals in urban relative to rural settings has already been documented in OECD countries (OECD, 2019[7]), including in the United States (Movement Advancement Project, 2019[34]). Does greater acceptance of non-cisgender and/or non-heterosexual persons also characterise states and regions with a higher share of self-identified LGBTI+ adults? Figure 2.4 affirms this correlation in a state‑level analysis, when both social acceptance and legal protections are considered. In 2023, an increase in the share of adults favouring LGBT non-discrimination protections by 10 percentage points is associated with an increase in LGBTI+ self-identification by 2.1 percentage points (Panel A of Figure 2.4). Similarly, states with laws (and policies) that are more supportive of LGBTI+ individuals had a higher share of self-identified LGBTI+ adults (Panel B of Figure 2.4): an increase in the inclusivity of laws and policies towards LGBTI+ individuals by 10 points is associated with an increase in LGBTI+ self-identification by 0.5 percentage points.13 These correlations hold true at the regional level. The US South, in addition to having the lowest share of self-identified LGBTI+ adults at 10.4% (compared to 11.7% in other regions), also has the lowest share of adults supporting LGBT non-discrimination protections at 65.2% (relative to 70.8% elsewhere). Furthermore, it ranks the lowest with respect to LGBTI+-inclusive laws and policies, with an average LGBTQ policy tally of 2.9, compared to 28.5 in other regions (see Box 2.6 for more details on the LGBTQ policy tally).
Unfortunately, since the HPS data do not collect information on the area where the respondent grew up or on any mobility patterns, we cannot investigate whether these correlations are at least partly driven by LGBTI+ individuals relocating in more accepting neighbourhoods. Yet, evidence suggests that geographic relocation of LGBTI+ individuals to avoid discrimination is a significant factor. Findings from the US Longitudinal Study of Adolescent to Adult health reveals that non-heterosexual individuals are more geographically mobile in the transition to adulthood than their non-heterosexual counterparts, a result driven by gays and lesbians – in contrast, bisexuals are indistinct from heterosexuals (Levine, 2022[35]). Using a mix of probability-based sampling and opt-in panels, (Medina and Mahowald, 2023[36]) found that 34% of LGBTI+ Americans moved away from their families, and 31% relocated from their residences to avoid discrimination due to their LGBTI+ identity. In addition, relying on a representative sample of recent US college graduates, (Folch, 2022[29]) observed that LGBTI+ college graduates were more likely to earn their degrees from colleges in states different from their childhood homes. These graduates were also more likely to reside in states different from where they grew up, both one and ten years post-graduation, compared to their cisgender straight peers. Finally, a recent survey of 113 LGBTI+ adults raising children in Florida found that over half (56%) of respondents were considering moving out of Florida three months after the “Don’t Say LGBTQ+” bill was passed, and 17% had already taken steps to do so (Goldberg, 2023[37]).14
Figure 2.3. The share of US adults who self-identify as LGBTI+ varies by a factor of 1.2, 2.2, and 1.8 across regions, states, and rural/urban areas, respectively
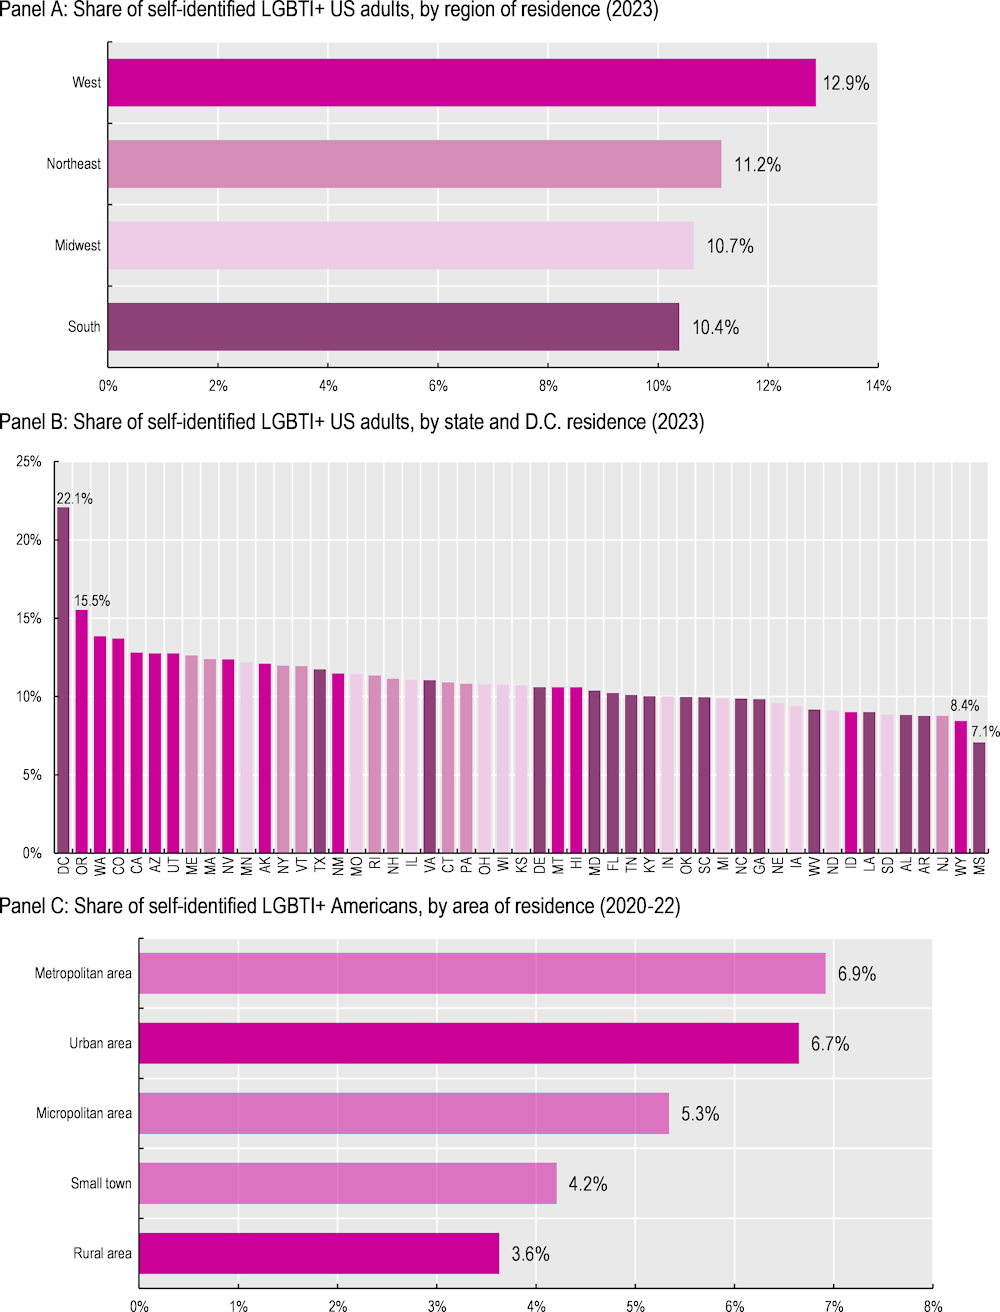
Note: LGBTI+ refers to respondents who self-identify as gay/lesbian, bisexual, transgender, other non-heterosexual, and other non-cisgender (see Box 2.5 for more details). In Panel C, the area of residence is classified using the rural-urban commuting area (RUCA) codes, which uses standard census measures of population density, levels of urbanisation and journey-to-work commuting to characterise all US census tracts and zip codes with respect to their rural/urban status. Person-level weights used.
Source: Household Pulse Survey (4 January 2023 – 10 July 2023) for Panel A and Panel B; Gallup Poll Social Series (2020‑22) for Panel C.
Figure 2.4. Self-reporting of LGBTI+ status is higher in US states that are more inclusive of LGBTI+ individuals
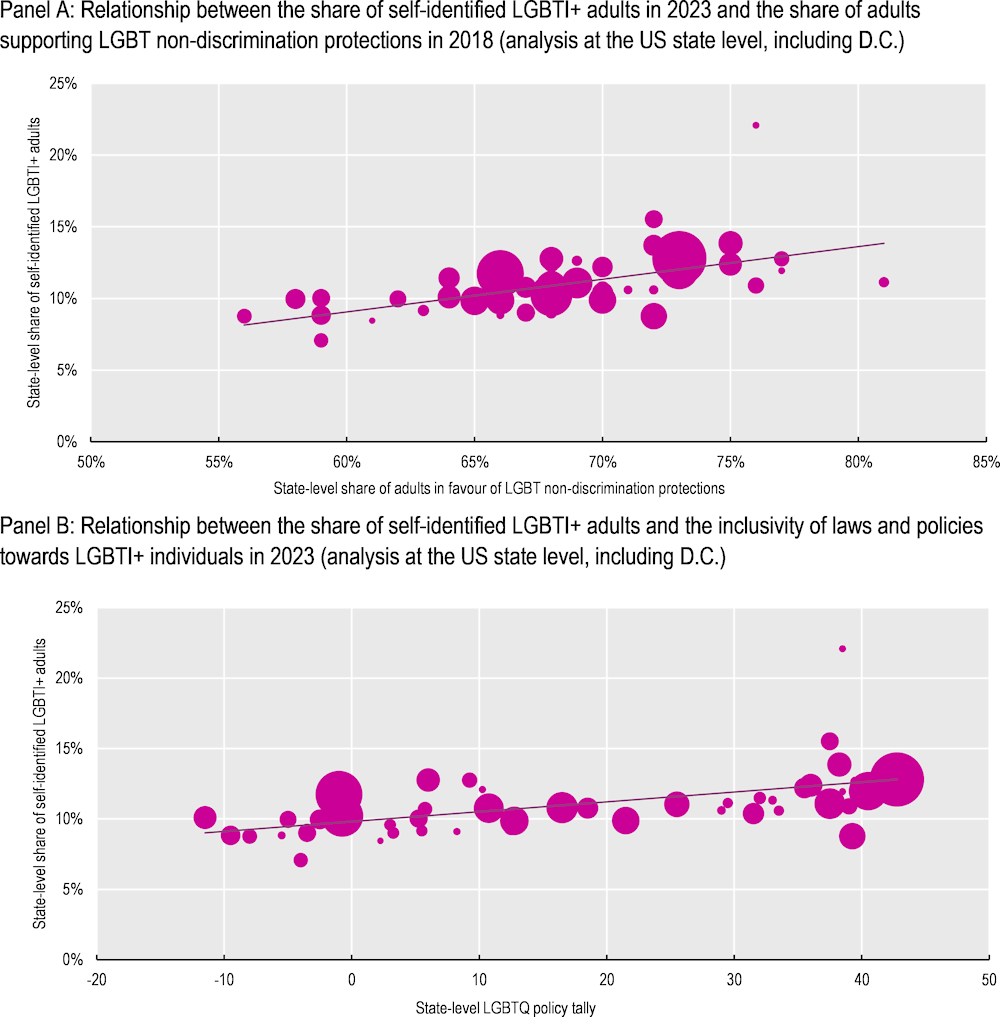
Note: LGBTI+ refers to respondents who self-identify as gay/lesbian, bisexual, transgender, other non-heterosexual, and other non-cisgender (see Box 2.5 for more details). In Panel A, the share of adults supporting LGBT non-discrimination protections is derived from a 2018 telephone survey (Jones et al., 2019[9]). This survey, based on a probability-driven, nationally representative sample of US adults, included a question asking respondents if they favoured laws protecting gay, lesbian, bisexual, and transgender individuals from discrimination in employment, public accommodations, and housing. In Panel B, the inclusivity of laws and policies towards LGBTI+ equality is measured based on the LGBTQ policy tally (see Box 2.6 for more details). Person-level weights used.
Source: Household Pulse Survey (4 January 2023 – 10 July 2023) for Panel A and Panel B; (Jones et al., 2019[9]) for Panel A; Movement Advancement Project for Panel B.
Box 2.6. The LGBTQ “policy tally” by the Movement Advancement Project
The Movement Advancement Project (MAP) is an independent, non-profit think tank founded in 2006. MAP has tracked laws and policies supportive of LGBTI+ individuals in the United States for more than a decade.
An LGBTQ “policy tally” rates LGBT laws and policies within each state, focusing on the following areas: Relationship and Parental Recognition, Non-discrimination, Religious Exemptions, LGBTQ Youth, Health Care, Criminal Justice, and Identity Documents. Across these seven categories, each law or policy earns a score that is either positive (when the law or policy is protective of LGBTI+ individuals) or negative (when the law or policy is harmful to LGBTI+ individuals). The LGBTQ policy tally is computed as the sum of these scores and used to classify states into five groups (as of July 2023): negative (the sum of the scores is lower than 0), low (the sum of the scores is between 0 and 11), fair (the sum of the scores is between 11 and 21.5), medium (the sum of the scores is between 21.5 and 32.5), or high (the sum of the scores is greater than 32.5).
The policy tallies are updated in real time, as soon as a bill is signed into law, or a policy becomes effective. This report uses state policy tallies as of 10 July 2023. These tallies reflect significant differences in legal protections across US states. For instance, only 15 states (and D.C.) had a “high” LGBTQ policy tally (indicative of significant progress toward LGBTQ equality), while 25 states fell into either “low” or “negative” LGBTQ policy tally.
2.4. How do self-identified LGBTI+ US adults compare based on key demographic factors?
Factors such as sex assigned at birth, age, race/ethnicity, family structure, and educational attainment significantly influence economic and health outcomes, which, in turn, shape individual life trajectories. This section examines how self-identified LGBTI+ US adults fare in relation to these key demographic determinants.
2.4.1. Sex assigned at birth
Individuals assigned female at birth (AFAB) are more likely to identify as LGBTI+ than those assigned male at birth (AMAB). In 2023, 12.3% of AFABs described themselves as non-heterosexual and/or non-cisgender, compared to 9.9% of AMABs (Panel A of Figure 2.5). This difference is primarily driven by AFAB individuals being more than twice as likely as their AMAB counterparts to identify as cisgender bisexual. This higher representation of AFABs is also observed, albeit to a lesser extent, among cisgender other non-heterosexual, and among non-cisgender individuals. A significant exception concerns the group of cisgender homosexuals where the share of AFABs is half that of AMABs (1.9% vs. 3.9%). This pattern of greater prevalence of AFABs among self-identified LGBTI+ US adults has gotten more pronounced in the past decade. In the early 2010s, they were only slightly more likely than their AMAB counterparts to report being LGBT. However, the gap has kept widening ever since (Panel B of Figure 2.5), a trend also documented in alternative datasets (National Academies of Sciences, Engineering, and Medicine, 2020[39]).15
Figure 2.5. Individuals assigned female at birth (AFAB) are more likely to identify as LGBTI+ than those assigned male at birth (AMAB), a gap that has kept widening in the past decade
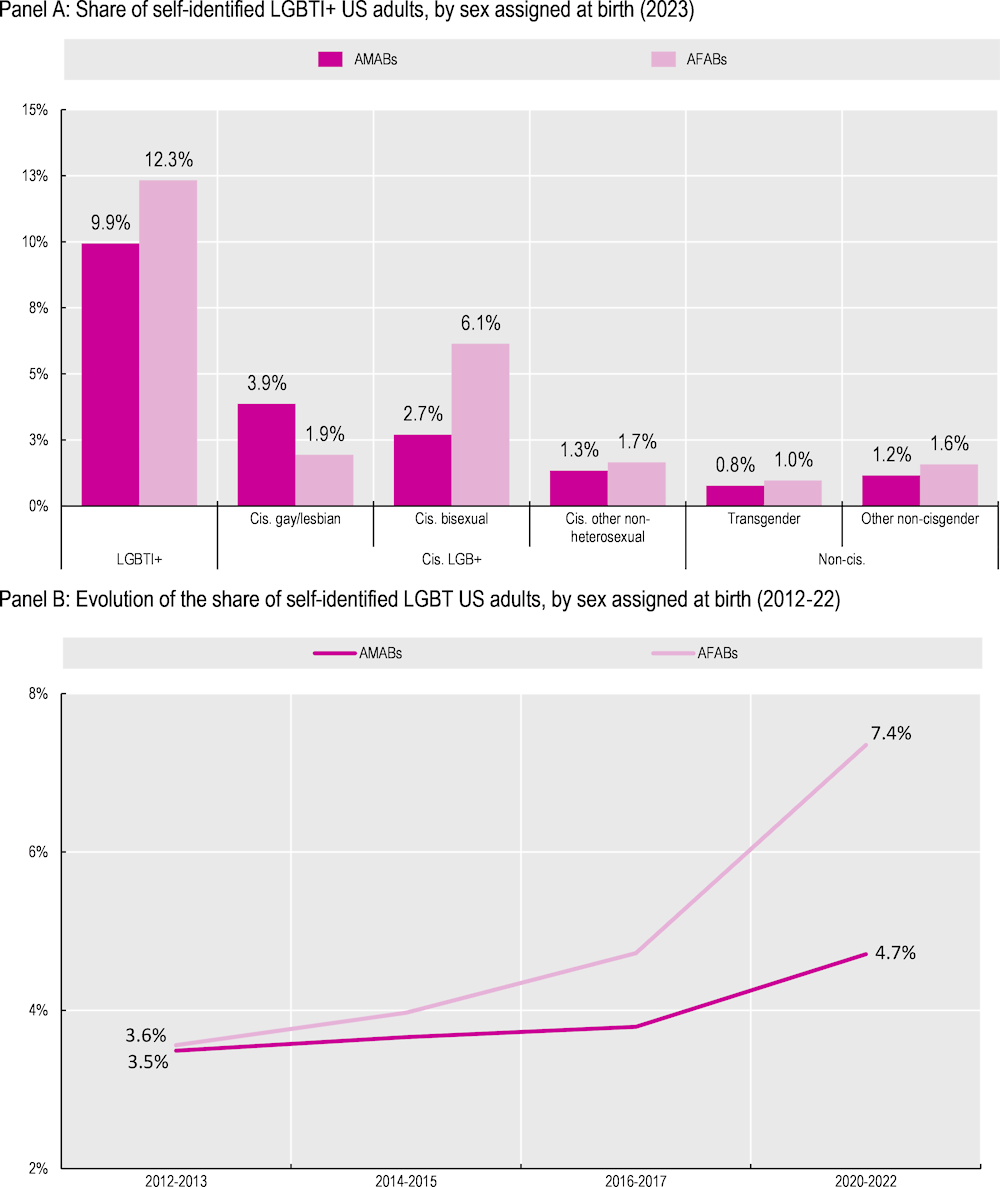
Note: LGBT refers to respondents who self-identify as gay/lesbian, bisexual, and transgender. LGBTI+ includes those who identify as other non-heterosexual and other non-cisgender (see Box 2.5 for more details). In Panel A, sex assigned at birth is determined based on the respondent’s direct report of their sex at birth. In Panel B, for the period 2012 – August 2014, the respondent’s sex at birth is inferred based on their voice and other cues detected during the interview. For the period September 2014 – 2022, it is determined by the respondent’s response to the following question: “I am required to ask, are you male or female?”. In Panel B, there is thus an inherent risk of misclassification: transgender men might be considered AMAB instead of AFAB, and vice versa for transgender women. This potential oversight could lead to an underestimation of AFABs’ likelihood to identify as LGBTI+. However, the impact is likely modest due to the relatively low proportion of self-identified transgender respondents in the US population (0.9% in 2023 based on the HPS). Person-level weights used.
Source: Household Pulse Survey (4 January 2023 – 10 July 2023) for Panel A; Gallup US Daily Survey (2012‑17) and Gallup Poll Social Series (2020‑22) for Panel B.
Differences in LGBTI+ self-identification between AFAB and AMAB individuals likely reflect the well-documented greater social acceptance of women expressing same‑sex attraction or relationships compared to men, leading to potentially more AFABs feeling comfortable identifying as cisgender LGB+ (Herek, 2002[40]; Bettinsoli, Suppes and Napier, 2020[41]). Additionally, females exhibit more positive attitudes towards LGBTI+ individuals, as detailed in Chapter 3. As for the widening of this gap over time, it may reflect strides made in gender equality, hence a departure from traditional roles and expectations placed upon women, including the pressure to adhere to heteronormativity and to be feminine. There is growing empirical evidence supporting enhanced fluidity in sexual orientation among women (or those AFABs). For example, from 2011 to 2019, a rising percentage of college‑aged women in the United States moved away from exclusive heterosexuality, contrasting with a relatively unchanged percentage of men reporting sexual attraction and behaviour exclusively towards women (Morgan and van Dulmen, 2021[42]).
2.4.2. Age
Self-reporting of LGBTI+ status decreases with age, for both assigned males at birth and assigned females at birth (Panel A of Figure 2.6). In 2023, nearly one in four young adults (18‑34) identified as non-heterosexual and/or non-cisgender, compared to nearly one in ten among prime age adults (35‑54) and one in 20 among mature adults (55+). This pattern prevails for all LGBTI+ subgroups, but especially so among cisgender bisexual individuals where the share of young adults is more than three times as high than the share of prime age adults, and more than 10 times as high as the share of mature adults (Panel B of Figure 2.6). The decrease in LGBTI+ self-identification with age is not specific to the United States. According to the 2nd edition of the biennial LGBT+ Pride Global Survey conducted by IPSOS in 2023 across 30 countries, nearly one in four Gen Zers (18‑25) self-identify as LGBTI+, as opposed to less than one in 20 among Baby Boomers (60+) (IPSOS, 2023[25]).
The well-documented increase in the number of individuals self-identifying as LGBT over the past decade is driven by young people (Panel A of Figure 2.7). The share of 18‑34 year‑olds reporting a non-heterosexual and/or non cisgender identity more than doubled between 2012‑13 and 2020‑22. While the percentage of self-identified LGBT adults also rose among people aged 35‑54 during the same period, its growth rate (50%) is much more modest. By contrast, the self-reporting of LGBT status among individuals above age 55 remained virtually unchanged.16
The higher and increasing share of self-identified LGBTI+ among young adults could be attributed to an age effect or to a cohort effect. An age effect posits that younger individuals are in a transitory phase of exploration regarding their sexual orientation and gender identity. This means that as today’s young adults grow older, their propensity to report an LGBTI+ status might decrease. Although the majority of Americans report consistency in their sexual orientation self-identification, a minority do change their identity label over time (Hall, Dawes and Plocek, 2021[43]). For example, some individuals who initially identify as bisexual may later identify as mostly heterosexual, or exclusively heterosexual. On the other hand, a cohort effect suggests that younger LGBTI+ generations, having been raised in more accepting environments and exposed to increased LGBTI+ visibility online and in the media, feel more comfortable with identifying as LGBTI+ throughout their lives. The increased representation of LGBTI+ individuals in mass media, coupled with social networks that connect LGBTI+ youth to their peers, has turned out instrumental in this emancipation (Ayoub and Garretson, 2017[44]). In line with this trend, younger generations exhibit more positive attitudes towards LGBTI+ individuals, as detailed in Chapter 3. Additionally, LGBTI+ youth choose to “come out of the closet” earlier in life compared to their predecessors from older generations (Human Rights Campaign Foundation, 2023[45]; National Academies of Sciences, Engineering, and Medicine, 2020[39]). If the cohort effect is at play, young adults identifying as LGBTI+ today are likely to continue doing so as they age. Moreover, upcoming generations may identify at similar or even increased rates, assuming social and legal acceptance remains or further improves.
Although additional research is needed for a more in-depth understanding of the underlying mechanisms, current evidence tilts towards a cohort effect (as opposed to an age effect) when it comes to LGBT identification. Specifically, Panel B of Figure 2.7 shows that among those who were aged 18 to 34 in 2012, the percentage identifying as LGBT has grown in subsequent years rather than declined. This trend suggests that the share of LGBTI+ adults will continue to grow in the future. Concerning the decreasing trend in LGBT identification for mature adults, it could be consistent with shorter life expectancy for LGBTI+ individuals.
Figure 2.6. Self-identification as LGBTI+ declines with age, especially among cisgender bisexuals
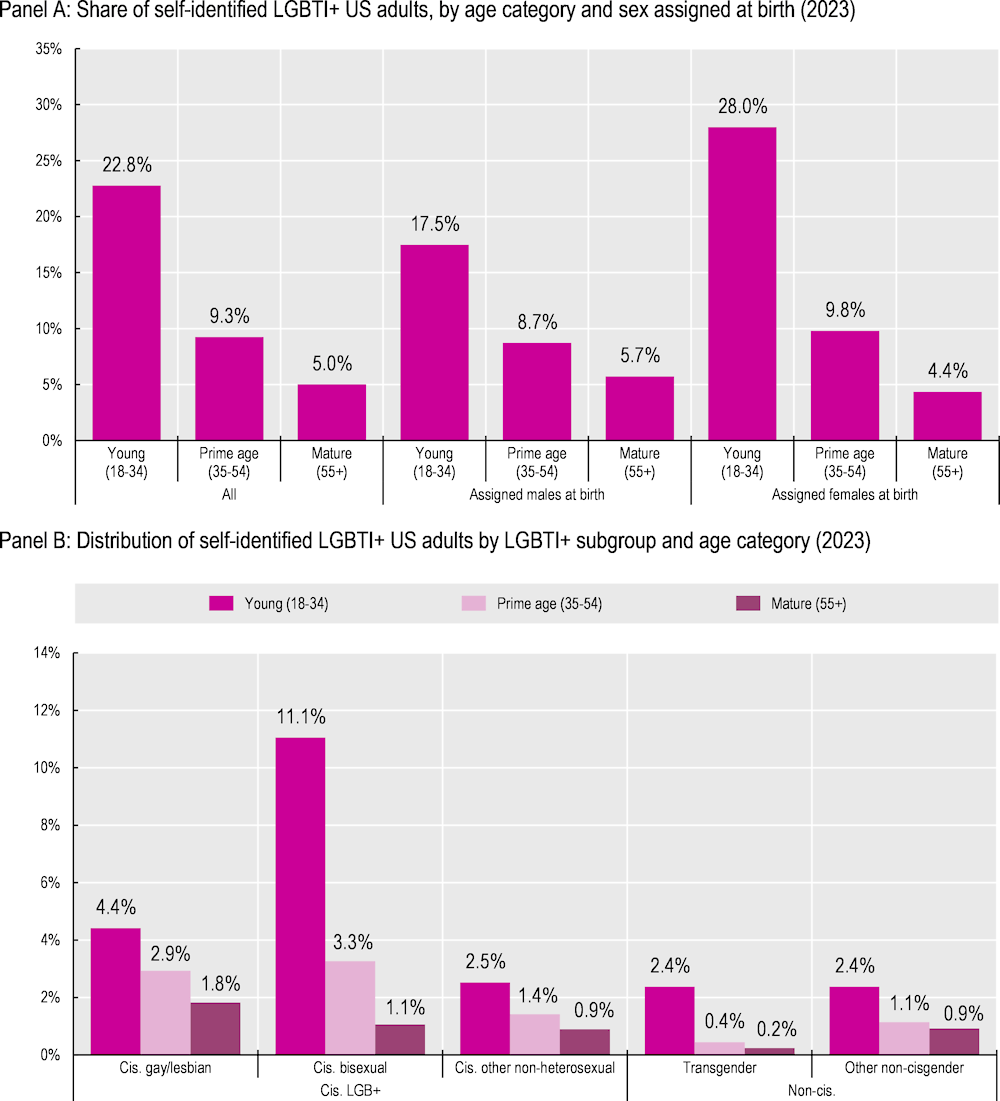
Note: LGBTI+ refers to respondents who self-identify as gay/lesbian, bisexual, transgender, other non-heterosexual, and other non-cisgender (see Box 2.5 for more details). Person-level weights used.
Source: Household Pulse Survey (4 January 2023 – 10 July 2023).
Figure 2.7. The increase in LGBT self-identification in the past decade is driven by young people, through a cohort effect
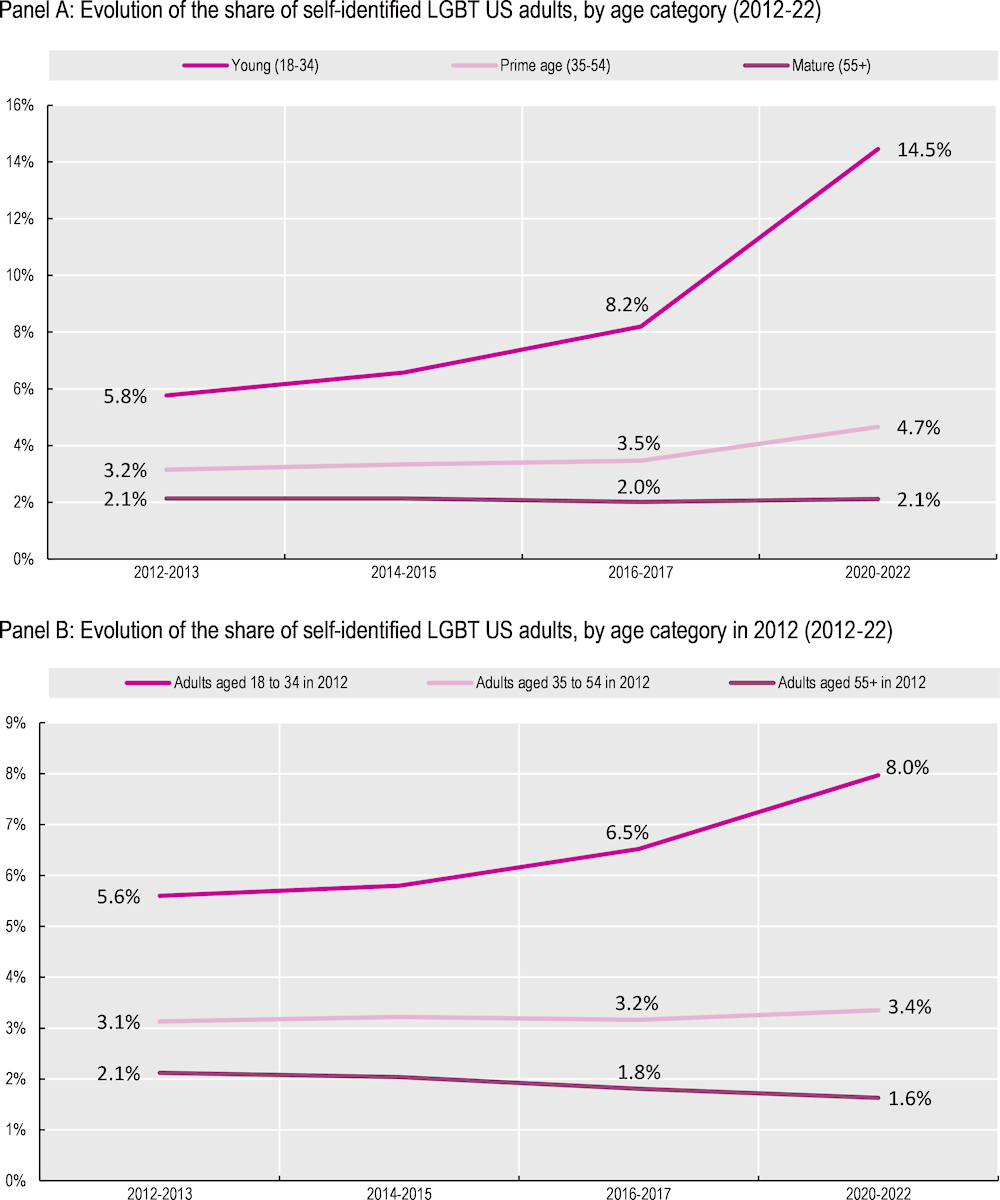
Note: LGBT refers to respondents who self-identify as gay/lesbian, bisexual, and transgender (see Box 2.5 for more details). Person-level weights used.
Source: Gallup US Daily Survey (2012‑17) and Gallup Poll Social Series (2020‑22).
2.4.3. Race and ethnicity
LGBTI+ self-identification among US adults varies widely by race and ethnicity. Non-Hispanic White Americans are slightly more likely than their non-White counterparts to report being LGBTI+. However, this observation conceals significant disparities. Compared to Asians and Blacks, the likelihood of self-identifying as LGBTI+ is 41% and 17% higher among Whites, respectively. Yet, it is almost 40% lower compared to individuals who identify with other racial categories, including American Indian and Alaska Native, Native Hawaiian and Other Pacific Islander, and mixed-race individuals (Panel A of Figure 2.8). This finding remains consistent even when accounting for differences across racial groups in terms of geographic location, sex assigned at birth, age, marital and parental status, number of adults in the household, and educational attainment (Annex Figure 2.A.1). However, variations in self-reporting of LGBTI+ status by ethnicity don’t withstand this check: the heightened propensity of Hispanic individuals to identify as LGBTI+ that is evident in Panel A of Figure 2.8 is predominantly due to their young age (Annex Figure 2.A.1). In line with the overlap between Hispanic ethnicity and age, the most significant increase in the proportion of LGBT self-identifications between 2012 and 2022 occurred within this group. Meanwhile, the growth in LGBT self-identification was more modest among the non-Hispanic group (Panel B of Figure 2.8).
Two factors can account for the lower identification as LGBTI+ among non-Hispanic Blacks and non-Hispanic Asians. Firstly, more negative attitudes towards LGBTI+ individuals often prevail within these populations, as detailed in Chapter 3. Such attitudes might discourage individuals with non-heterosexual and/or non-cisgender identities from coming out due to fear of alienation from their community. Secondly, a “double minority stress” effect could also be at play (Meyer, 2010[46]; Meyer, 2003[47]): LGBTI+ individuals within a racial/ethnic minority group may face compounded stigma from both racism and LGBTI+-phobia, making some less inclined to openly identify as LGBTI+ (Grov et al., 2006[48]; Rosario, Schrimshaw and Hunter, 2004[49]; Maguen et al., 2002[50]).
Looking further into disparities within non-Hispanic racial minorities, the fact that individuals identifying with other racial categories are more likely, rather than less, to self-identify as cisgender LGB+ and/or non-cisgender compared to non-Hispanic Whites might be linked to the composition of this group. For one, the American Indian and Alaska Native categories encompass tribes that historically recognised more than two genders. These tribes often attributed special roles or powers to “Two-Spirit” individuals, indicating a long-standing acceptance of diverse sexual orientations and gender identities (Jacobs, 1997[51]). Similarly, Pacific Island cultures traditionally valued identities beyond the binary concept of gender. For instance, “mahu” in Hawaii or “fa’afafine” in Samoa refer to individuals who adopt a mix of male and female roles (Besnier and Alexeyeff, 2014[52]). Finally, higher rates of LGBTI+ self-identification may be expected among mixed-race individuals. Their lived experiences of navigating multiple identities could cultivate a more fluid understanding of themselves, extending to their perceptions of sexual and gender identities.
Figure 2.8. Self-reporting of LGBTI+ status is the highest and has increased the most among Hispanic Americans
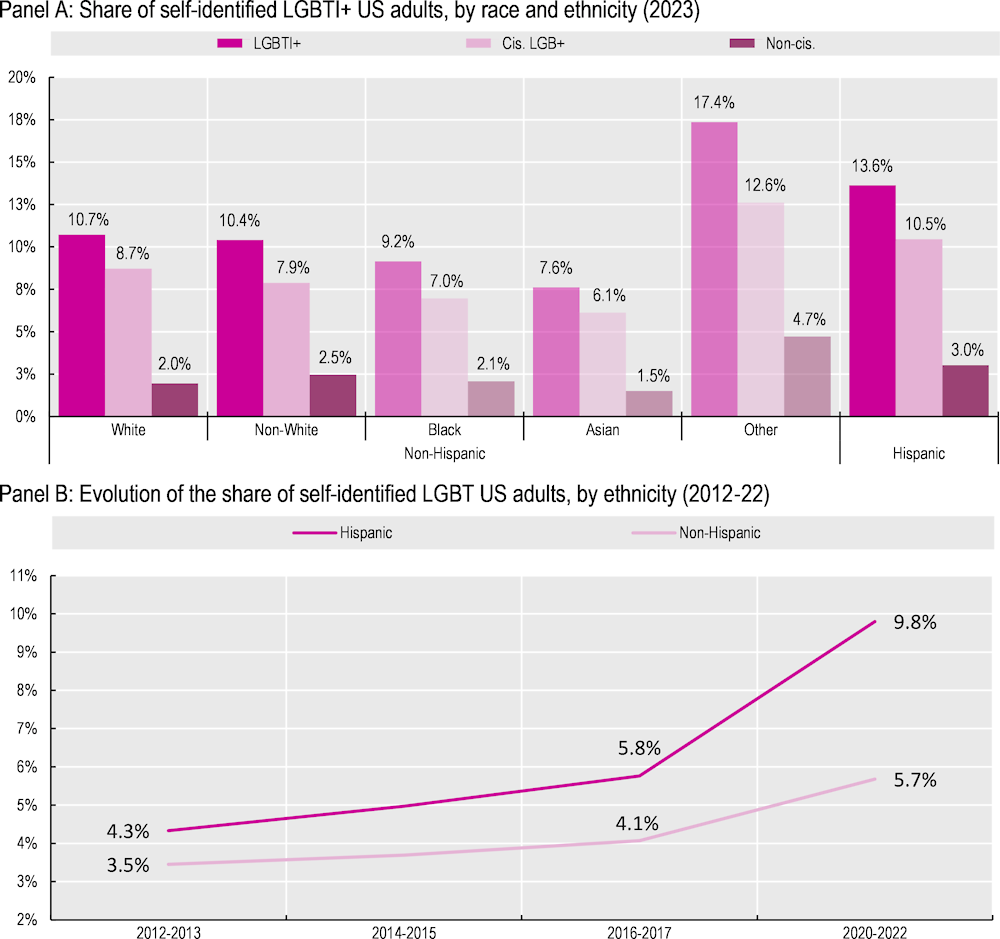
Note: LGBT refers to respondents who self-identify as gay/lesbian, bisexual, and transgender. LGBTI+ includes those who identify as other non-heterosexual and other non-cisgender (see Box 2.5 for more details). A reliable analysis of the evolution of the share of self-identified LGBT US adults by race (on top of ethnicity) was not possible in Panel B, due to small sample sizes attached to the following subgroups: Non-Hispanic Whites, Non-Hispanic Blacks, Non-Hispanic Asians and Non-Hispanic other racial categories. Person-level weights used.
Source: Household Pulse Survey (4 January 2023 – 10 July 2023) for Panel A; Gallup US Daily Survey (2012‑17) and Gallup Poll Social Series (2020‑22) for Panel B.
2.4.4. Family structure
After accounting for demographic differences between LGBTI+ and non-LGBTI+ individuals, US adults who self-identify as LGBTI+ are approximately 10 percentage points less likely to be partnered or married compared to their cisgender straight counterparts, as shown in Panel A of Figure 2.9. Additionally, they are nearly 20 percentage points less likely to be married (Panel A of Figure 2.9) and 13 percentage points less likely to be living in a household with at least one child under 18 (Panel B of Figure 2.9). These penalties are consistent across all LGBTI+ subgroups.17 Furthermore, when the sample is divided by sex assigned at birth, an additional insight emerges. Among all the categorised groups, cisgender gay males face the most significant disparity in family structure compared to their straight counterparts: their likelihood of being married is lower by 36 percentage points, while their probability of living in a household with children lies 26 percentage points below (Annex Figure 2.A.2). While the gap in marriage rates between LGBT and non-LGBT individuals has slightly narrowed over the last decade, the difference in the likelihood of being a parent to a child under age 18 has remained largely stable (Figure 2.10).
Lower partnership, marriage, and parenting rates for LGBTI+ individuals have consistently been found in US nationally representative surveys (Badgett, Carpenter and Sansone, 2021[14]; National Academies of Sciences, Engineering, and Medicine, 2020[39]). Historically low social and legal acceptance of same‑sex couples is a major driver behind LGBTI+ individuals’ greater difficulty in forming and maintaining relationships, compared to cisgender straight individuals. Fear of stigmatisation has long prevented LGBTI+ individuals from entering or publicly acknowledging relationships, as has a lack of legal recognition of same‑sex partnerships and marriages. Improved attitudes towards LGBTI+ individuals and the legalisation of same‑sex marriage in 2015 by the U.S. Supreme Court have likely contributed to the trend highlighted in Figure 2.10, and notably the increased number of reported same‑sex cohabitating couples and the growing rate of same‑sex marriage (Scherer, 2022[53]). Similarly, the spread of the internet and dating apps has probably helped offset the traditionally lower probability of LGB+ individuals finding a romantic partner (National Academies of Sciences, Engineering, and Medicine, 2020[39]).
Despite recent increases in partnership and marriage rates among LGBTI+ adults, many still have low expectations about becoming parents (National Academies of Sciences, Engineering, and Medicine, 2020[39]; Coffman, Coffman and Marzilli, 2024[54]). Naturally, same‑sex couples encounter biological barriers to procreation. This is why, even today, many children raised by same‑sex couples were initially born to different-sex parents, one of whom later entered a same‑sex relationship (Gates, 2015[55]; Goldberg and Conron, 2018[56]).
LGBTI+ individuals wishing to become parents thus must turn to adoption, assisted reproductive technologies, or surrogacy. Since 2015, same‑sex partners in the United States have been legally entitled to adopt (OECD, 2020[5]). Furthermore, access to medically assisted insemination (using donor sperm) and in vitro fertilisation is not restricted for same‑sex couples. Notably, since 2017, the United States. has ensured equal treatment for “automatic co-parent recognition”. This means that when a child is born via assisted reproductive technologies, the same‑sex partner of the birth parent is automatically recognised as the second legal parent, mirroring the rights of opposite‑sex couples. Yet, surrogacy laws in the United States vary by state, creating challenges for male same‑sex couples in regions where gestational surrogacy agreements are illegal or limited to opposite‑sex couples, as seen in Florida. Such legal disparities (together with the financial challenges emphasised below) can help explain not only the reduced parenting rate among gay men but also their lower likelihood of being in partnerships or marriages compared to other LGBTI+ subgroups, as feedback effects may be in play: for many individuals, the choice to form a partnership or marry is intrinsically linked to the aspiration or anticipation of raising children.
Even where adoption, assisted reproductive technologies, or surrogacy are legally accessible, multiple barriers can still stand in the way. Potential adoptive LGBTI+ parents might confront prejudice within the adoption system. Additionally, methods like assisted reproductive technologies or surrogacy often come with high costs, rendering them unattainable for those without the necessary financial resources, particularly as these procedures aren’t usually covered for same‑sex couples by health insurers and employers (Medina and Mahowald, 2023[36]).18 It is then not surprising that same‑sex couples are more likely to adopt or foster children (Taylor, 2020[57]).
Transgender individuals, particularly those who undergo gender transitioning, may face particularly pronounced barriers to procreation. Hormone replacement therapy and specific surgical procedures can significantly impact fertility. For instance, transgender men undergoing hysterectomies (removing uterus) or oophorectomies (removing ovaries), and transgender women opting for orchiectomies (removal of the testicles) might face reproductive challenges post-surgery. While fertility preservation, such as storing eggs or sperm before medical transition, can be an option for some, it’s not always feasible. The prohibitive financial costs and a lack of awareness or sensitivity from some medical professionals concerning fertility options for transgender individuals can further limit access to these reproductive choices.
In summary, these mechanisms shed light on why the disparities in the likelihood of LGBTI+ individuals becoming parents to a child under age 18 have largely persisted, as depicted in Figure 2.10. Two opposing forces are in play. On the one hand, with the rise in social and legal acceptance, more LGBTI+ adults are “coming out”. This means fewer are becoming parents within the confines of a heterosexual relationship (Tornello and Patterson, 2015[58]; Gates and Brown, 2015[59]). On the other hand, there is growing reliance on adoption, assisted reproductive technology, and surrogacy among LGBTI+ individuals. Yet, this phenomenon is tempered by limited access to these methods, due to a combination of legal, financial, and discriminatory barriers (Farr, Vazquez and Patterson, 2020[60]).
Figure 2.9. After demographic adjustments, LGBTI+ adults are less likely to be partnered or married, and to live in a household with children
Note: LGBTI+ refers to respondents who self-identify as gay/lesbian, bisexual, transgender, other non-heterosexual, and other non-cisgender (see Box 2.5 for more details). The percentage point differences are estimated from a Logistic regression, controlling for sex assigned at birth, age groups (18‑24, 25‑29, 30‑34, …, 80‑84, 85‑88), race and ethnicity, educational attainment, living in one of the 15 largest metropolitan statistical areas (metro areas) – only in the HPS data -, as well as state and survey wave fixed effects. The percentage point differences are estimated at the average of the covariates. The error bars depict 95% confidence intervals. This means that we can be 95% confident that the true value lies within the range of the error bar. In other words, if the error bar crosses the x-axis, then the percentage point difference cannot be deemed as statistically different from 0 (at least not at this 95% confidence level). Standard errors robust to heteroscedasticity. Person-level weights used.
Source: Gallup Poll Social Series (2020‑22) and Household Pulse Survey (21 July 2021 – 10 July 2023) for Panel A; Household Pulse Survey (21 July 2021 – 10 July 2023) for Panel B.
Figure 2.10. In the past decade, marriage rates of LGBT individuals have modestly converged with those of their non-LGBT peers, but parenting rates have remained virtually unchanged
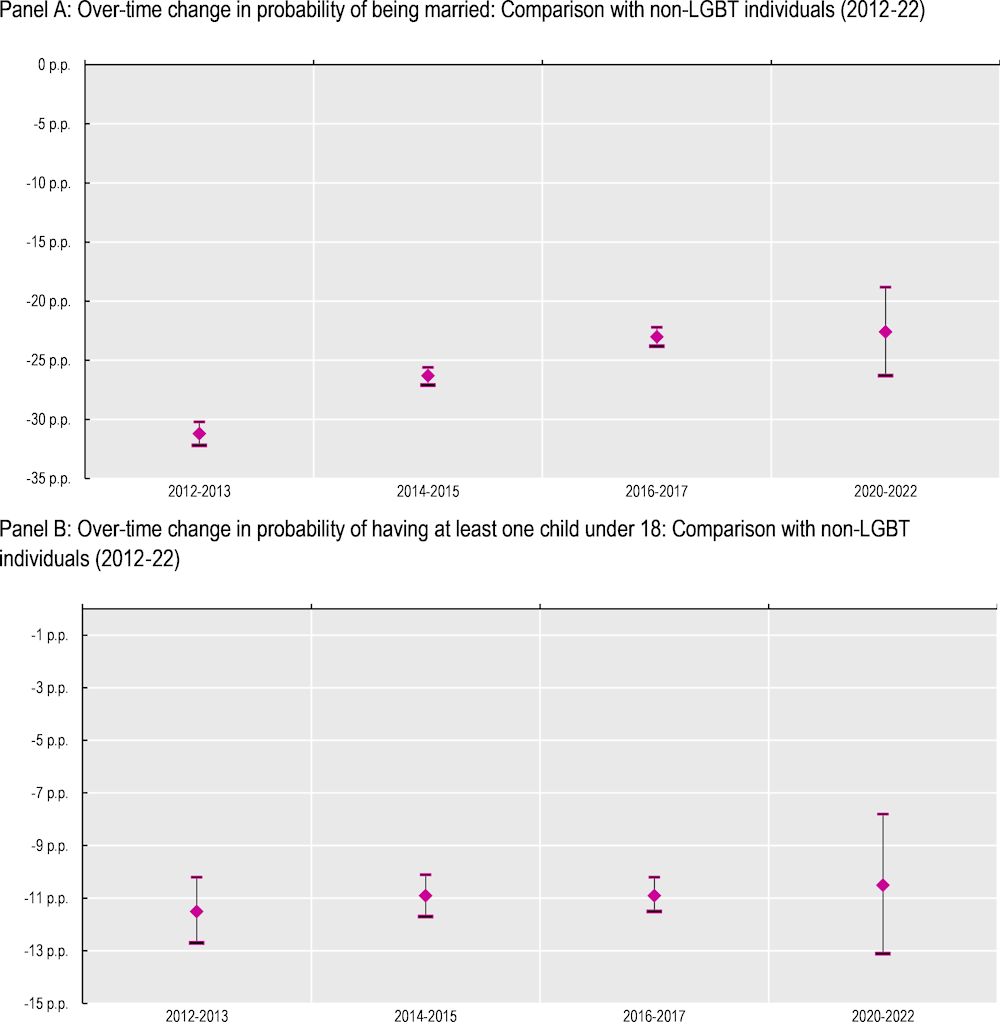
Note: LGBT refers to respondents who self-identify as gay/lesbian, bisexual, and transgender (see Box 2.5 for more details). The percentage point differences are estimated from a Logistic regression, controlling for sex assigned at birth, age groups (18‑24, 25‑29, 30‑34, …, 80‑84, 85‑88), race and ethnicity, educational attainment, as well as state and year and month fixed effects. The percentage point differences are estimated at the average of the covariates. The error bars depict 95% confidence intervals. This means that we can be 95% confident that the true value lies within the range of the error bar. In other words, if the error bar crosses the x-axis, then the percentage point difference cannot be deemed as statistically different from 0 (at least not at this 95% confidence level). Standard errors robust to heteroscedasticity. Person-level weights used.
Source: Gallup US Daily Survey (2012‑17) and Gallup Poll Social Series (2020‑22).
2.4.5. Educational attainment
The vast majority of studies using nationally representative US data have found that LGB adults are better educated than their straight counterparts (Badgett, Carpenter and Sansone, 2021[14]; Sansone and Carpenter, 2020[61]; Gates, 2014[62]; Black, Sanders and Taylor, 2007[63]). In contrast, non-cisgender individuals show lower educational levels than cisgender individuals (Badgett, Carpenter and Sansone, 2021[14]; Wilkinson, Shifrer and Pearson, 2021[64]; Carpenter, Eppink and Gonzalez, 2020[65]; Wilkinson, Pearson and Liu, 2018[66]). However, studies focused on newer data, representing younger cohorts of LGB adults, yield a different conclusion. They indicate an educational attainment penalty for LGB adults, with young gay men being the only subgroup to demonstrate an educational advantage (Mittleman, 2022[67]; Sansone, 2019[68]; Pearson and Wilkinson, 2017[69]).
After demographic adjustments, the Household Pulse Survey confirms these findings. The educational penalty for non-cisgender individuals remains consistent across all age groups: non-cisgender adults are significantly less likely to graduate from high school, compared to their cisgender straight counterparts (Figure 2.11). However, the nature of the educational attainment gap between cisgender LGB+ and their straight peers changes with age (Figure 2.11): there is a significant college attainment advantage for mature and prime age cisgender LGB+ adults compared to their straight counterparts, but this shifts to a disadvantage for younger LGB+ generations. Results from Gallup also corroborate this pattern, showing that young LGBT adults are less likely to hold a Bachelor’s degree, while prime and mature adults are more likely to be college graduates.19 Furthermore, when the sample is divided by sex assigned at birth, an additional insight emerges. Cisgender lesbian females have experienced the most significant decline in college attainment across age groups, while cisgender gay males are the only subgroup with a consistent (albeit decreasing) college attainment advantage across those groups (Annex Figure 2.A.3).
LGBTI+ youth are evolving in environments that are much more hostile than those in which their cisgender straight peers live. This holds true both within schools and in broader societal contexts. Anti-LGBTI+ bullying at school is a worldwide problem and the United States is no exception (Unesco, 2016[70]). The trivialisation of insults such as “fag”, “dyke”, or “tranny”, along with the rampant verbal and physical harassment of boys perceived as too feminine and girls seen as too masculine, adversely affects the mental health of LGBTI+ youth and creates barriers to their educational attainment (Human Rights Campaign Foundation, 2023[71]; Conron, O’Neill and Vasquez, 2022[72]; National Academies of Sciences, Engineering, and Medicine, 2020[39]; Sansone, 2019[68]). Although the school climate for LGBTI+ youth has improved since the early 2000s, schools remain a challenging environment (Human Rights Campaign Foundation, 2023[45]; Kosciw, Clark and Menard, 2022[73]). In 2021, 82% of LGBTI+ students who responded to the National School Climate Survey, conducted biennially by the Gay, Lesbian, and Straight Education Network in the United States, reported feeling unsafe in school due to at least one of their actual or perceived personal characteristics. For instance, 92% of LGBTI+ students heard negative remarks about gender expression (not acting “masculine enough” or “feminine enough”), with a majority (56%) declaring they heard these remarks frequently or often. Outside schools, the situation doesn’t necessarily improve for LGBTI+ youth. Notably, the increased use of internet among youth has resulted in online bullying. In 2021, nearly half of LGBTI+ students who responded to the National School Climate Survey reported being harassed or threatened by classmates via electronic media (i.e. text messages, emails, Instagram, Twitter, Tumblr, Facebook, Snapchat) during extracurricular time. In addition, LGBTI+ youth who come out might experience exclusionary behaviours by parents and other family members (Human Rights Campaign Foundation, 2023[45]; National Academies of Sciences, Engineering, and Medicine, 2020[39]), which likely contribute to their elevated risk of homelessness (National Academies of Sciences, Engineering, and Medicine, 2020[39]).
While such adversities can be immensely challenging, there is evidence that they might lead some LGBTI+ youth to develop coping strategies that translate into greater perseverance in academic pursuits (Pachankis and Hatzenbuehler, 2013[74]). First, the anticipation that the bullying LGBTI+ individuals face in school settings and elsewhere might continue into the labour market could encourage some to seek higher educational qualifications and other forms of human capital as a compensatory strategy. Indeed, two‑thirds of LGBTI+ youth are afraid they will be discriminated against at work due to their LGBTI+ identity (Human Rights Campaign Foundation, 2023[45]). Second, given the reduced self-esteem and increased family rejection experienced by LGBTI+ youth relative to their cisgender straight peers (National Academies of Sciences, Engineering, and Medicine, 2020[39]), investing more in human capital can boost their self-worth and perceived acceptance. Third, LGBTI+ might invest more in human capital to ease relocation to more accepting neighbourhoods (as illustrated in Section 2.3) and to secure roles in more accepting occupations. If these coping strategies are indeed at play, the data in Figure 2.11 (which are consistent with prior research) suggest that, until recently, they have allowed LGB+ individuals to over-compensate. However, this does not seem to be the case for non-cisgender individuals. A few factors might explain these disparities. For one, non-cisgender individuals often encounter more negative attitudes than their cisgender LGB+ counterparts (OECD, 2019[7]; Valfort, 2017[27]), including in the school setting (Human Rights Campaign Foundation, 2023[45]), a topic the next chapter will delve deeper into. In addition, presumably due to the enhanced stigma they face, non-cisgender individuals report higher rates of mental health disorders like depression, anxiety, and suicidal thoughts – an issue that Chapter 3 will also explore further. These mental health struggles can severely impede academic focus and performance. Lastly, the consistent educational disadvantage seen among non-cisgender individuals across all age groups might also derive from identity challenges. The process of understanding, accepting, and expressing one’s gender identity might be particularly overwhelming during childhood and adolescence – a distress referred to as “gender dysphoria” –, making it challenging to balance personal growth with educational demands.
Why haven’t young cisgender LGB+ individuals maintained their educational attainment premium? First, as LGBTI+ people from younger cohorts “come out of the closet” earlier (National Academies of Sciences, Engineering, and Medicine, 2020[39]), they might be more likely to be impacted by bullying and loss of family support than their predecessors from older generations. Another plausible explanation is the continuous improvement in both social and legal acceptance, which may have reduced the need to over-compensate in terms of human capital. For example, research has shown that the legalisation of same‑sex marriage across US states resulted in an increase in employment for people in same‑sex couples. This change appears to be driven by a growing acceptance of homosexuality and, consequently, reduced discrimination against LGB job applicants and employees (Sansone, 2019[75]). LGBTI+ youth might be aware of these enhanced job prospects and thus may not feel the same urgency to invest heavily in their education. Another possible explanation could be the reduction in the so-called “non-disclosure bias” (Valfort, 2017[27]). Historically, lower-educated LGBTI+ adults might have been less inclined than their higher-educated counterparts to openly identify as LGBTI+ in surveys and other life areas. For instance, evidence has shown that, among men who report having sex with men in the United States, those of advantaged background are more likely to self-identify as homosexual or bisexual (Pathela et al., 2006[76]; Barrett, C. and Pollack, 2005[77]). This reluctance may stem from traditionally and persistent lower levels of acceptance of LGBTI+ individuals among populations with limited education, as illustrated in Chapter 3. However, as society shifts towards greater acceptance of non-heterosexual and non-cisgender identities, a greater number of lower-educated LGBTI+ individuals might feel empowered to “come out of the closet”.
Among cisgender LGB+ individuals, lesbians have experienced the most significant decline in educational attainment across age groups (Annex Figure 2.A.3). Historically, cisgender lesbian females have surpassed their straight counterparts in education (Mittleman, 2022[67]). One explanation is their stronger incentive to defy patriarchal norms of the era, which advocated for early marriage, childrearing, and economic dependence on a male provider. By obtaining a Bachelor’s degree or higher, they could delay the traditional marital and parenting timelines. Such higher education potentially also allowed them to avoid entering a heterosexual marriage altogether by providing the prospect of financial independence. Lastly, their sexual orientation naturally protected them from unintended pregnancies, which, given the limited access to contraceptives at the time, frequently caused several of their straight peers to not attend or drop out of college.
With the advancement of gender equality, many barriers that once hindered women’s college completion have been removed, leading to a prevailing notion that girls should attain at least a college degree. Consequently, there has been a significant surge in girls’ educational attainment, allowing them to outpace boys in many instances (OECD, 2022[78]; England and Bearak, 2012[79]). One explanation for this trend is that personal characteristics (including personality traits) traditionally viewed as “feminine” (which often align with societal expectations for girls) are, on average, more conducive to academic success than certain characteristics stereotypically deemed masculine, such as conscientiousness compared to excessive assertiveness. In this context, cisgender lesbian females face challenges compared to their cisgender straight counterparts (Mittleman, 2022[67]). They have been shown to possess, on average, personal characteristics that are less typical of their gender and thus more aligned with characteristics traditionally associated with men (Burn and Martell, 2022[80]). On the other hand, the gender atypicality observed, on average, in cisgender gay males, which has been consistently demonstrated in research, might also be a reason they surpass their straight peers academically (Mittleman, 2022[67]). Finally, stereotypes about LGBTI+ individuals can also influence educational (and other life‑related) choices of LGBTI+ individuals. For instance, stereotypes for gay men – such as that of the effeminate, rich, well-educated, urban gay male, with a successful career – are still present in contemporary representations in media (van Meer and Pollmann, 2022[81]; McInroy and Craig, 2017[82]; Rothmann, 2013[83]; Meyer, 2010[84]). All these factors could help explain why cisgender gay males remain the only LGBTI+ subgroup to consistently exhibit an educational advantage, even among younger generations (Annex Figure 2.A.3).
Figure 2.11. After demographic adjustments, an educational penalty prevails among all cohorts of non-cisgender individuals, but emerges only among younger cohorts of cisgender LGB+ individuals
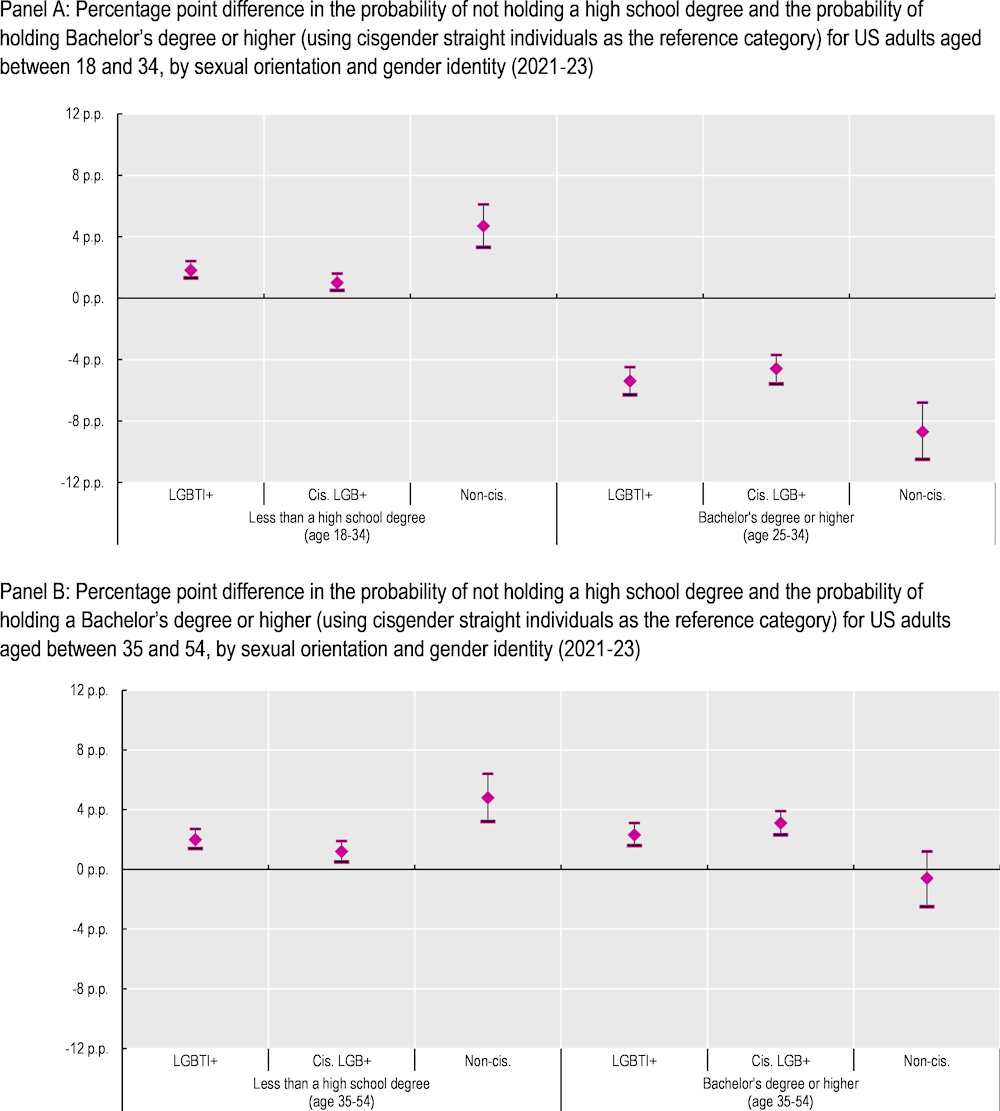
Who are LGBTI+ Americans?
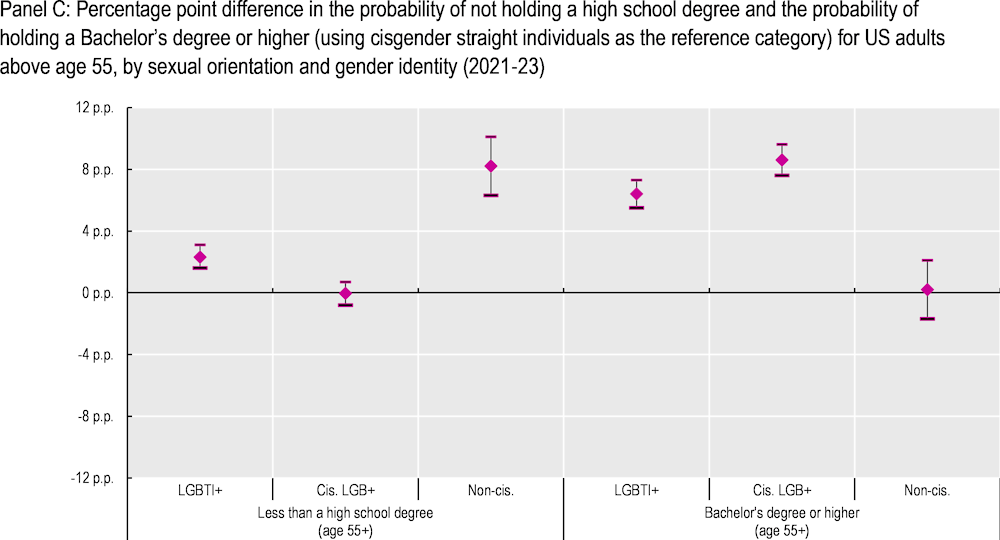
Note: LGBTI+ refers to respondents who self-identify as gay/lesbian, bisexual, transgender, other non-heterosexual, and other non-cisgender (see Box 2.5 for more details). The percentage point differences are estimated from a Logistic regression, controlling for sex assigned at birth, age groups (18‑24, 25‑29, 30‑34, …, 80‑84, 85‑88), race and ethnicity, marital and parental status, number of adults in the household, living in one of the 15 largest metropolitan statistical areas (metro areas), as well as state and survey wave fixed effects. The percentage point differences are estimated at the average of the covariates. The error bars depict 95% confidence intervals. This means that we can be 95% confident that the true value lies within the range of the error bar. In other words, if the error bar crosses the x-axis, then the percentage point difference cannot be deemed as statistically different from 0 (at least not at this 95% confidence level). Standard errors robust to heteroscedasticity. Person-level weights used.
Source: Household Pulse Survey (21 July 2021 – 10 July 2023).
References
[88] Aksoy, C. et al. (2020), “Do laws shape attitudes? Evidence from same-sex relationship recognition policies in Europe”, European Economic Review, Vol. 124, https://doi.org/10.1016/j.euroecorev.2020.103399.
[44] Ayoub, P. and J. Garretson (2017), “Getting the Message Out: Media Context and Global Changes in Attitudes Toward Homosexuality”, Comparative Political Studies, 50(8), 1055–1085, https://doi.org/10.1177/0010414016666836.
[14] Badgett, M., C. Carpenter and A. Sansone (2021), “LGBTQ Economics”, Journal of Economic Perspectives, 35 (2): 141-70, pp. 141-70.
[85] Badgett, M. and N. Goldberg (2009), Best practices for asking questions about sexual orientation on surveys.
[77] Barrett, D. C. and L. Pollack (2005), “Whose Gay Community? Social Class, Sexual Self-Expression, and Gay Community Involvement”, Sociological Quarterly, 46 (3), 2005, p. 437-456.
[52] Besnier, N. and K. Alexeyeff (2014), “Gender on the Edge: Transgender, Gay, and Other Pacific Islanders”, University of Hawai’i Press, http://www.jstor.org/stable/j.ctt6wqhsc.
[41] Bettinsoli, M., A. Suppes and J. Napier (2020), Predictors of Attitudes Toward Gay Men and Lesbian Women in 23 Countries, Social Psychological and Personality Science, 11(5), 697–708, https://doi.org/10.1177/1948550619887785.
[15] Black, D. et al. (2000), Demographics of the Gay and Lesbian Population in the United States: Evidence from Available Systematic Data Sources, Demography 37(2): 139–54, https://doi.org/10.1257/JEP.35.2.141.
[63] Black, D., S. Sanders and L. Taylor (2007), The economics of lesbian and gay families., Journal of Economic Perspectives, 21(2), 53–70, https://doi.org/10.1257/jep.21.2.53.
[80] Burn, I. and M. Martell (2022), “Gender typicality and sexual minority labour market diferentials”, British Journal of Industrial Relations, 60(4), 784–814.
[65] Carpenter, C., S. Eppink and G. Gonzalez (2020), Transgender status, gender identity, and socioeconomic outcomes in the United States, Industrial & Labor Relations Review, 73(3), 573-599.
[18] Carpenter, C., M. Lee and L. Nettuno (2022), Economic outcomes for transgender people and other gender minorities in the United States: First estimates from a nationally representative sample, Southern Economic Journal Volume89, Issue2.
[32] Coffman, K., L. Coffman and K. Ericson (2016), The Size of the LGBT Population and the Magnitude of Antigay Sentiment Are Substantially Underestimated, Management Science 63 (10): 3168-86.
[54] Coffman, K., L. Coffman and K. Marzilli (2024), Non-Binary Gender Economics, National Bureau of Economic Research.
[72] Conron, K., K. O’Neill and L. Vasquez (2022), Educational Experiences of Transgender People, Los Angeles, CA: The Williams Institute.
[16] Deng, B. and T. Watson (2023), LGBTQ+ Data Availability: What we can learn from four major surveys, The Brookings Institution.
[79] England, P. and J. Bearak (2012), Women’s Education and Their Likelihood of Marriage: A Historic Reversal, Austin, TX: Council on Contemporary Families.
[60] Farr, R., C. Vazquez and C. Patterson (2020), LGBTQ adoptive parents and their children, In A.E. Goldberg and K.R. Allen (Eds.), LGBT-Parent Families: Innovations in Research and Implications for Practice (2nd ed.). New York: Springer.
[23] Fields, J. et al. (2020), Design and Operation of the 2020 Household Pulse Survey, 2020. U.S. Census Bureau. Forthcoming.
[8] Flores, A. (2019), Social Acceptance of LGBT People in 174 Countries, 1981 to 2017, The Williams Institute, Los Angeles.
[10] Flores, A. and S. Barclay (2015), Trends in Public Support for Marriage for Same-Sex Couples by State, Williams Institute, UCLA School of Law.
[29] Folch, M. (2022), The LGBTQ+ Gap: Recent Estimates for Young Adults in the United States, https://doi.org/10.2139/ssrn.4072893.
[4] Fundamental Rights Agency (2015), The fundamental rights situation of intersex people | European Union Agency for Fundamental Rights, https://fra.europa.eu/en/publication/2015/fundamental-rights-situation-intersex-people (accessed on 25 November 2019).
[55] Gates, G. (2015), Marriage and Family: LGBT Individuals and Same-Sex Couples., The Future of Children 25, no. 2 (2015): 67–87., http://www.jstor.org/stable/43581973.
[62] Gates, G. (2014), LGB Families and Relationships: Analyses of the 2013 National Health Interview Survey, Los Angeles, CA: Williams Institute, UCLA School of Law.
[59] Gates, G. and T. Brown (2015), Marriage and Same-Sex Couples after Obergefell, Los Angeles, CA: Williams Institute, UCLA School of Law.
[37] Goldberg, A. (2023), Impact of HB 1557 (Florida’s Don’t Say Gay Bill) on LGBTQ+ Parents in Florida, Williams Institute, https://williamsinstitute.law.ucla.edu/wp-content/uploads/Dont-Say-Gay-Impact-Jan-2023.pdf.
[56] Goldberg, S. and K. Conron (2018), How Many Same-Sex Couples in the U.S. Are Raising Children?, Los Angeles, CA: Williams Institute, UCLA School of Law.
[48] Grov, C. et al. (2006), “Race, ethnicity, gender, and generational factors associated with the coming‐out process among gay, lesbian, and bisexual individuals”, The Journal of Sex Research, 43:2, 115-121, https://doi.org/10.1080/00224490609552306.
[43] Hall, W., H. Dawes and N. Plocek (2021), “Sexual Orientation Identity Development Milestones Among Lesbian, Gay, Bisexual, and Queer People: A Systematic Review and Meta-Analysis”, Frontiers in Psychology, Vol. 12, https://doi.org/10.3389/fpsyg.2021.753954.
[40] Herek, G. (2002), Gender gaps in public opinion about lesbians and gay men, Public Opinion Quarterly, 66, 40–66.
[28] Herman, J., A. Flores and K. O’Neill (2022), How Many Adults and Youth Identify as Transgender in the United States?, The Williams Institute, UCLA School of Law.
[45] Human Rights Campaign Foundation (2023), “2023 LGBTQ+ Youth Report”, https://reports.hrc.org/2023-lgbtq-youth-report#.
[12] Human Rights Campaign Foundation (2023), “Impact of Gender Affirming Care Bans on LGBTQ+ Adults”, https://hrc-prod-requests.s3-us-west-2.amazonaws.com/GAC-Ban-Memo-Final.pdf.
[71] Human Rights Campaign Foundation (2023), LGBTQ+ Americans Under Attack: A Report and Reflectio non the 2023 State Legislative Session.
[30] Human Rights Campaign Foundation (2018), A workplace divided: understanding the climate for LGBTQ workers nationwide., https://www.hrc.org/resources/a-workplace-divided-understanding-the-climate-for-lgbtq-workers-nationwide.
[25] IPSOS (2023), LGBT+ PRIDE 2023: A 30-Country Ipsos Global Advisor Survey, https://www.ipsos.com/sites/default/files/ct/news/documents/2023-05/Ipsos%20LGBT%2B%20Pride%202023%20Global%20Survey%20Report%20-%20rev.pdf.
[51] Jacobs, S. (1997), “Two-Spirit people: Native American gender identity”, Sexuality, and spirituality. University of Illinois Press.
[9] Jones, R. et al. (2019), Fifty Years After Stonewall: Widespread Support for LGBT Issues – Findings from American Values Atlas 2018, Washington, DC: Public Religion Research Institute, https://www.prri.org/research/fifty-years-after-stonewall-widespread-support-for-lgbt-issues-findings-from-american-values-atlas-2018/.
[3] Jones, T. et al. (2016), Intersex: Stories and Statistics from Australia, Open Book Publishers, https://doi.org/10.11647/obp.0089.
[6] Kasprowski, D. et al. (2021), “LGBTQI* people in Germany face staggering health disparities”, DIW Weekly Report 5-6, pp. 42-50, https://doi.org/10.18723/diw_dwr:2021-5-1.
[73] Kosciw, J., C. Clark and L. Menard (2022), “The 2021 National School Climate Survey: The experiences of LGBTQ+ youth in our nation’s schools.”, New York: GLSEN.
[35] Levine, A. (2022), “Sexualities and Geographic Mobility Between Childhood and Adulthood in the United States”, Demography 1 August 2022; 59 (4): 1541–1569, https://doi.org/10.1215/00703370-10085223.
[50] Maguen, S. et al. (2002), “Developmental milestones and disclosure of sexual orientation among, gay, lesbian, and bisexual youths”, Journal of Applied Developmental Psychology. 2002;23(2):219–233.
[24] Marken, S. (2018), “Still Listening: The State of Telephone Surveys”, https://news.gallup.com/opinion/methodology/225143/listening-state-telephone-surveys.aspx.
[19] Martell, M. and L. Roncolato (2023), Economic Vulnerability of Sexual Minorities: Evidence from the US Household Pulse Survey., Popul Res Policy Rev. 2023;42(2):28.
[82] McInroy, L. and S. Craig (2017), “Perspectives of LGBTQ emerging adults on the depiction and impact of LGBTQ media representation”, Journal of Youth Studies, Vol. 20/1, pp. 32-46, https://doi.org/10.1080/13676261.2016.1184243.
[36] Medina, C. and L. Mahowald (2023), Discrimination and Barriers to Well-Being: The State of the LGBTQI+ Community in 2022, The Center for American Progress, https://www.americanprogress.org/article/discrimination-and-barriers-to-well-being-the-state-of-the-lgbtqi-community-in-2022/.
[1] Medina, C. and L. Mahowald (2021), “Key Issues Facing People With Intersex Traits”, The Center for American Progress, https://www.americanprogress.org/article/key-issues-facing-people-intersex-traits/.
[46] Meyer, I. (2010), “Identity, Stress, and Resilience in Lesbians, Gay Men, and Bisexuals of Color”, The Counseling Psychologist, 38(3), 442–454, https://doi.org/10.1177/0011000009351601.
[47] Meyer, I. (2003), Prejudice, social stress, and mental health in lesbian, gay and bisexual populations: conceptual issues and research evidence, Psychol Bull. 2003;129:674-697.
[84] Meyer, M. (2010), “Representing bisexuality on television: The case for intersectional hybrids”, Journal of Bisexuality, 10, 366–387.
[67] Mittleman, J. (2022), Intersecting the Academic Gender Gap: The Education of Lesbian, Gay, and Bisexual America., American Sociological Review, 87(2), 303–335., https://doi.org/10.1177/00031224221075776.
[42] Morgan, E. and M. van Dulmen (2021), Sexuality in Emerging Adulthood, online edn, Oxford Academic, 23 Sept. 2021, https://doi.org/10.1093/oso/9780190057008.001.0001.
[38] Movement Advancement Project (2023), Equality Maps Snapshot: LGBTQ Equality By State, https://www.mapresearch.org/equality-maps/.
[11] Movement Advancement Project (2020), Mapping LGBTQ Equality: 2010 to 2020, https://www.lgbtmap.org/file/2020-tally-report.pdf.
[34] Movement Advancement Project (2019), Where We Call Home: LGBT People in Rural America., http://www.lgbtmap.org/rural-lgbt.
[33] National Academies of Sciences, Engineering, and Medicine (2022), Measuring Sex, Gender Identity, and Sexual Orientation, Washington, DC: The National Academies Press, https://doi.org/10.17226/26424.
[39] National Academies of Sciences, Engineering, and Medicine (2020), Understanding the Well-Being of LGBTQI+ Populations, Washington, DC: The National Academies Press, https://doi.org/10.17226/25877.
[17] National Science and Technology Council (2023), “Federal Evidence Agenda on LGBTQI+ Equity”, A Report by the Subcommittee on Sexual Orientation, Gender Identity, and Variations in Sex Characteristics (SOGI) Data. Subcommittee on Equitable Data.
[13] OECD (2023), The Road to LGBTI+ Inclusion in Germany: Progress at the Federal and Länder Levels, OECD Publishing, Paris, https://doi.org/10.1787/977b463a-en.
[78] OECD (2022), “Education at a Glance 2022: OECD Indicators”, OECD Publishing, Paris,, https://doi.org/10.1787/3197152b-en.
[5] OECD (2020), Over the Rainbow? The Road to LGBTI Inclusion, OECD Publishing, Paris, https://doi.org/10.1787/8d2fd1a8-en.
[7] OECD (2019), Society at a Glance 2019: OECD Social Indicators, OECD Publishing, Paris, https://doi.org/10.1787/soc_glance-2019-en.
[89] Ofosu, E. et al. (2019), “Same-sex marriage legalization associated with reduced implicit and explicit antigay bias”, Proceedings of the National Academy of Sciences, 116(18), 8846-8851, https://doi.org/10.1073/pnas.1806000116.
[74] Pachankis, J. and M. Hatzenbuehler (2013), The Social Development of Contingent Self-Worth in Sexual Minority Young Men: An Empirical Investigation of the ‘Best Little Boy in the World Hypothesis., Basic and Applied Social Psychology 35(2):176–90.
[76] Pathela, P. et al. (2006), “Discordance between Sexual Behavior and Self-Reported Sexual Identity: A Population-Based Survey of New York City Men”, Annals of Internal Medicine, 145 (6), 2006, p. 416-425.
[69] Pearson, J. and L. Wilkinson (2017), Same-sex sexuality and educational attainment: The pathway to college, Journal of Homosexuality, 64(4), 538–576.
[26] Pew Research Center (2022), About 5% of young adults in the U.S. say their gender is different from their sex assigned at birth, Washington, DC: Pew Research Center.
[31] Robertson, R. et al. (2018), Estimates of Non-Heterosexual Prevalence: The Roles of Anonymity and Privacy in Survey Methodology, Archives of Sexual Behavior 47 (4): 1069-84.
[49] Rosario, M., E. Schrimshaw and J. Hunter (2004), “Ethnic/racial differences in the coming-out process of lesbian, gay, and bisexual youths: a comparison of sexual identity development over time.”, Cultur Divers Ethnic Minor Psychol. 2004 Aug;10(3):215-28, https://doi.org/10.1037/1099-9809.10.3.215.
[2] Rosenwohl-Mack, A. et al. (2020), “A national study on the physical and mental health of intersex adults in the U.S.”, PLoS One. 2020 Oct 9;15(10):e0240088, https://doi.org/10.1371/journal.pone.0240088.
[83] Rothmann, J. (2013), “Send in the (gay) clowns’: Will & Grace and Modern Family as’ sensibly queer”, Acta Academica, 45, 40–83.
[68] Sansone, D. (2019), LGBT students: New evidence on demographics and educational outcomes., Economics of Education Review, 73(April), 101933.
[75] Sansone, D. (2019), Pink work: Same-sex marriage, employment and discrimination, Journal of Public Economics, Volume 180,, https://doi.org/10.1016/j.jpubeco.2019.104086.
[61] Sansone, D. and C. Carpenter (2020), Turing’s Children: Representation of Sexual Minorities in STEM, PLOS ONE 15 (11).
[53] Scherer, Z. (2022), “Number of Same-Sex Couple Households Exceeded 1 Million in 2021”, United States Census Bureau, https://www.census.gov/library/stories/2022/11/same-sex-couple-households-exceeded-one-million.html.
[90] Tankard, M. and E. Paluck (2017), “he Effect of a Supreme Court Decision Regarding Gay Marriage on Social Norms and Personal Attitudes”, Psychological Science, 28(9), 1334–1344, https://doi.org/10.1177/0956797617709594.
[87] Tate, C., J. Ledbetter and C. Youssef (2013), A two-question method for assessing gender categories in the social and medical sciences., J Sex Res. 2013;50(8):767-76.
[57] Taylor, D. (2020), “Same-Sex Couples Are More Likely to Adopt or Foster Children”, United States Census Bureau.
[86] Tordoff, D. et al. (2019), Increased Ascertainment of Transgender and Non-binary Patients Using a 2-Step Versus 1-Step Gender Identity Intake Question in an STD Clinic Setting., Sex Transm Dis. 2019 Apr;46(4):254-259.
[58] Tornello, S. and C. Patterson (2015), Timing of parenthood and experiences of gay fathers: A life course perspective., Journal of GLBT Family Studies, 11, 35–56.
[70] Unesco (2016), “Out in the open: education sector responses to violence based on sexual orientation or gender identity/expression: summary report”, https://unesdoc.unesco.org/ark:/48223/pf0000244652.
[21] United States Census Bureau (2023), “Source of the Data and Accuracy of the Estimates for the Household Pulse Survey – Phase 3.9”, https://www2.census.gov/programs-surveys/demo/technical-documentation/hhp/Phase3-9_Source_and_Accuracy_Week59.pdf.
[22] United States Census Bureau (2021), “Nonresponse Bias Report for the 2020 Household Pulse Survey”, https://www2.census.gov/programs-surveys/demo/technical-documentation/hhp/2020_HPS_NR_Bias_Report-final.pdf.
[27] Valfort, M. (2017), “LGBTI in OECD Countries: A Review”, OECD Social, Employment and Migration Working Papers, No. 198, OECD Publishing, Paris, https://doi.org/10.1787/d5d49711-en.
[81] van Meer, M. and M. Pollmann (2022), “Media Representations of Lesbians, Gay Men, and Bisexuals on Dutch Television and People’s Stereotypes and Attitudes About LGBs”, Sexuality & Culture 26, 640–664, https://doi.org/10.1007/s12119-021-09913-x.
[66] Wilkinson, L., J. Pearson and H. Liu (2018), Educational attainment of transgender adults: Does the timing of transgender identity milestones matter?, Social Science Research, https://doi.org/10.1016/j.ssresearch.2018.04.006.
[64] Wilkinson, L., D. Shifrer and J. Pearson (2021), Educational Outcomes of Gender-Diverse Youth: A National Population-Based Study, Gender & Society 35(5):806–37.
[20] Wu, M., K. Zhao and F. Fils-Aime (2022), “Response rates of online surveys in published research: A meta-analysis”, Computers in Human Behavior Reports, Vol. 7, https://doi.org/10.1016/j.chbr.2022.100206.
Annex 2.A. Additional Figures
Annex Figure 2.A.1. After demographic adjustments, further analysis confirms LGBTI+ self-identification’s link to race but not to ethnicity
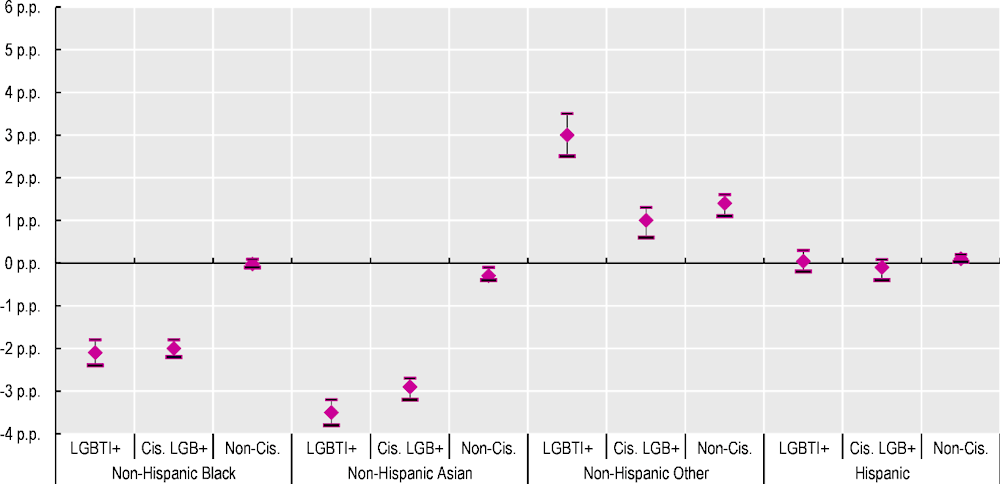
Note: LGBTI+ refers to respondents who self-identify as gay/lesbian, bisexual, transgender, other non-heterosexual, and other non-cisgender (see Box 2.5 for more details). The percentage point differences are estimated from a Logistic regression, controlling for sex assigned at birth, age groups (18‑24, 25‑29, 30‑34, …, 80‑84, 85‑88), race and ethnicity, marital and parental status, number of adults in the household, educational attainment, living in one of the 15 largest metropolitan statistical areas (metro areas), as well as state and survey wave fixed effects. The percentage point differences are estimated at the average of the covariates. The error bars depict 95% confidence intervals. This means that we can be 95% confident that the true value lies within the range of the error bar. In other words, if the error bar crosses the x-axis, then the percentage point difference cannot be deemed as statistically different from 0 (at least not at this 95% confidence level). Standard errors robust to heteroscedasticity. Person-level weights used.
Source: Household Pulse Survey (21 July 2021 – 10 July 2023).
Annex Figure 2.A.2. Cisgender gay males face the strongest disparity in family structure
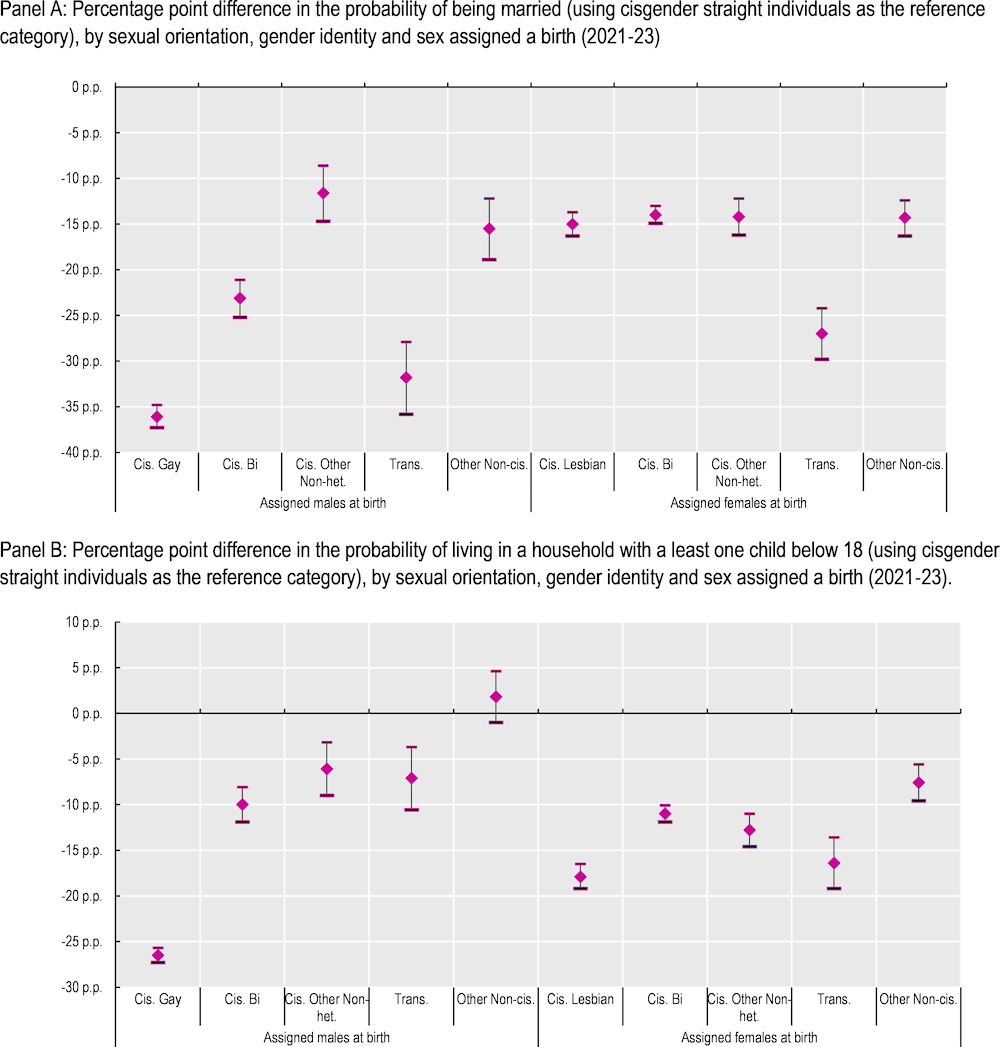
Note: The percentage point differences are estimated from a Logistic regression, controlling for age groups (18‑24, 25‑29, 30‑34, …, 80‑84, 85‑88), race and ethnicity, educational attainment, living in one of the 15 largest metropolitan statistical areas (metro areas), as well as state and survey wave fixed effects. The percentage point differences are estimated at the average of the covariates. The error bars depict 95% confidence intervals. This means that we can be 95% confident that the true value lies within the range of the error bar. In other words, if the error bar crosses the x-axis, then the percentage point difference cannot be deemed as statistically different from 0 (at least not at this 95% confidence level). Standard errors robust to heteroscedasticity. Person-level weights used.
Source: Household Pulse Survey (21 July 2021 – 10 July 2023).
Annex Figure 2.A.3. College attainment declines most for cisgender lesbian females, while cisgender gay males maintain a diminishing advantage across age groups
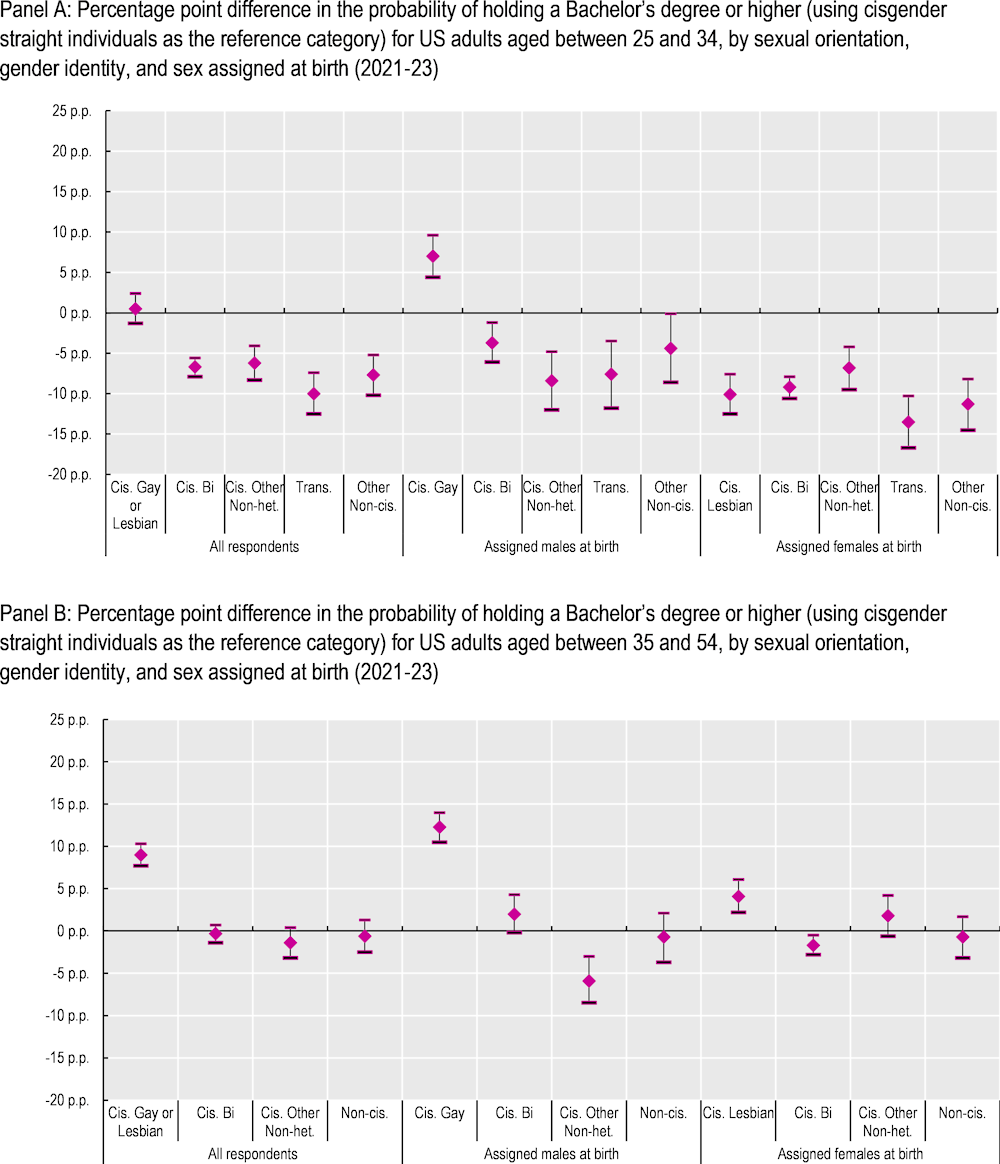
Who are LGBTI+ Americans?
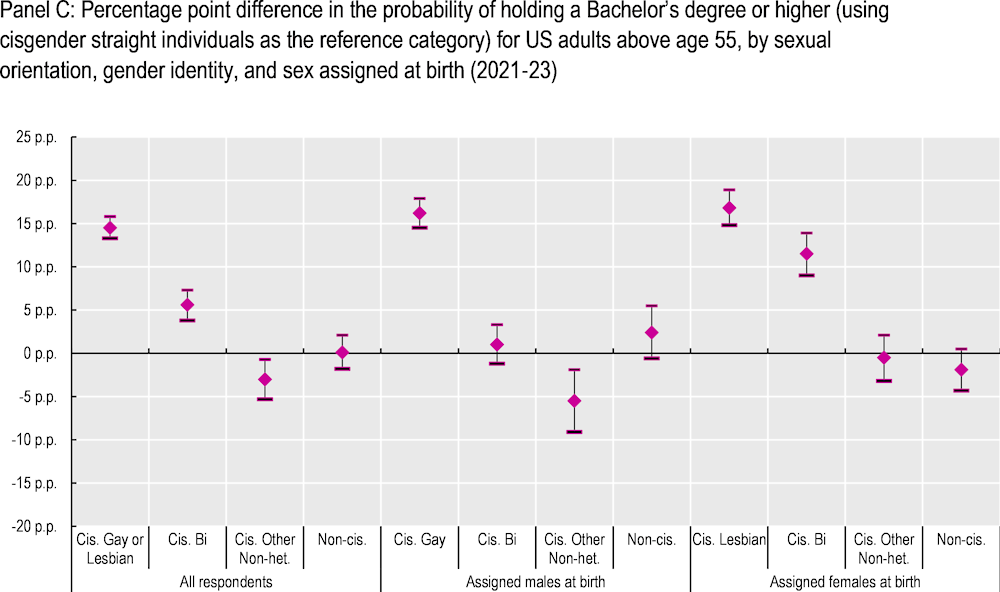
Note: The percentage point differences are estimated from a Logistic regression, controlling for sex assigned at birth, age groups (18‑24, 25‑29, 30‑34, …, 80‑84, 85‑88), race and ethnicity, marital and parental status, number of adults in the household, living in one of the 15 largest metropolitan statistical areas (metro areas), as well as state and survey wave fixed effects. The percentage point differences are estimated at the average of the covariates. The error bars depict 95% confidence intervals. This means that we can be 95% confident that the true value lies within the range of the error bar. In other words, if the error bar crosses the x-axis, then the percentage point difference cannot be deemed as statistically different from 0 (at least not at this 95% confidence level). Standard errors robust to heteroscedasticity. Transgender and other non-cisgender were not separately analysed for prime age and mature adults, due to limited sample size for transgender individuals. Person-level weights used.
Source: Household Pulse Survey (21 July 2021 – 10 July 2023).
Notes
← 1. More precisely, the 2019 update of the LGBT Global Acceptance Index (LGBT-GAI) established by Andrew Flores shows that acceptance of LGBT people improved between 1981 and 2017 across the globe, with only limited polarisation: while 131 of 174 countries experienced increases in acceptance, only 16 are characterised by a decline (27 experienced no change). However, it is important to keep in mind that these results mainly capture levels and trends in social acceptance of homosexuality. Although the LGBT-GAI seeks to measure acceptance of lesbian, gay, bisexual and transgender people altogether, only seven of the 71 questions used to compute the index focus on acceptance of transgender individuals. Moreover, these questions are measured at only one point in time, which means that the evolution of the LGBT-GAI over time fails to capture potential improvement in attitudes towards transgender individuals.
← 2. Numerous alternative surveys, whether nationwide or focused on specific subnational jurisdictions, have tried to distinguish self-identified LGBTI+ individuals. Some, such as the National Health Interview Survey or the General Social Survey, have included questions related to sexual orientation. Others, like the Behavioural Risk Factor Surveillance System or polls by the Pew Research Center, have addressed gender identity. Yet, none of these surveys offer a nationally representative sample of the LGBT(I+) adult population in the same way that the Gallup or the HPS data does.
← 3. However, it is important to note that the Census Bureau is planning to request Office of Management and Budget (OMB) approval to conduct a test of sexual orientation and gender identity questions on the ACS in 2024.
← 4. For transgender individuals, it is possible that these different ways of defining their sexual orientation are correlated with the extent of their medical and social gender transition. However, this specific information is not included in the HPS data.
← 5. While the exact implications of these numbers can be challenging to interpret, the Census Bureau’s Household Pulse Survey indicates that the majority of non-cisgender adults identify as non-heterosexual. In 2023, 65% of non-cisgender adults self-identified as LGB+, 23% as straight, 11% answered “I don’t know” to the sexual orientation question, and 1% did not answer the question at all.
← 6. The Census Bureau’s adult population (persons 18 years and over) estimate for 2022 was 260 836 730 and Census Bureau’s US state resident population totals in 2022 is obtained from: www.census.gov/newsroom/press-kits/2022/22-national-state-population-estimates.html
← 7. Of these transgender adults, 23% did not self-identify as transgender in the gender identity question but reported a binary gender (male/female) different from their sex assigned at birth (male/female). This evidence further demonstrates that surveys which identify transgender individuals through a single direct question tend to undercount the transgender population. In contrast, surveys employing a two‑stage approach – first asking about sex assignment at birth and then about current gender identity – produce more accurate estimates (National Academies of Sciences, Engineering, and Medicine, 2020[39]; Tordoff et al., 2019[86]; Tate, Ledbetter and Youssef, 2013[87]).
← 8. In addition, 1.9% of respondents in 2023 indicated “I don’t know” in the sexual orientation question, 1.3% had a missing response in this question, and 1.2% had a missing response in the gender identity question. While some respondents who answer “I don’t know” might belong to the LGBTI+ population (e.g. those questioning their sexual orientation), we did not include individuals who selected this option in the LGBTI+ estimate. We made this decision because a significant share likely chose this option due to either a lack of understanding of the question or uncertainty about the most appropriate category to select (Badgett and Goldberg, 2009[85]).
← 9. Reliance on opt-in panels consists in exploiting pre‑existing samples, that are composed of members who have signed up to take online surveys, in exchange of small rewards. Polling companies employ a variety of statistical techniques to adjust opt-in panels to ensure they match the national population on a chosen set of dimensions. That said, the fact that respondents are self-selected raises a risk of bias that may lead to overstate the share of LGBTI+ individuals (in case those who decide to answer surveys related to LGBTI+ issues are the most open to those issues) or to understate this share (in case those who decide to answer surveys related to LGBTI+ issues are the most hostile to those issues).
← 10. For instance, a surge in LGB identification was documented in the General Social Survey (National Academies of Sciences, Engineering, and Medicine, 2020[39]) and in the National Health Interview Survey (Deng and Watson, 2023[16]), noting that this upward trend was also witnessed among self-identified cohabitating same‑sex couples (Badgett, Carpenter and Sansone, 2021[14]).
← 11. In arriving at this conclusion, Katherine Coffman, Lucas Coffman and Keith Marzilli Ericson compared the likelihood of individuals reporting LGB status, depending on whether the sexual orientation question is asked through a self-administered online survey or through an item count technique also conducted online. (The “item count technique” is a survey method used to elicit truthful responses to sensitive questions by providing respondents with a list of items and asking them to indicate how many, but not specifically which, items apply to them, thereby preserving their anonymity.) The authors show that the proportion of LGB respondents is significantly higher when the item count technique (ICT) is used, especially if the question on sexual orientation is based on sexual self-identification. In this case, the proportion of LGB individuals increases by 65% with the ICT (compared to the self-administered online survey), noting that the impact of the ICT is smaller when sexual orientation is measured based on sexual behaviour, and almost non-existent when it is based on sexual attraction. These findings suggest that experiencing sexual attraction to a same‑sex person is viewed as socially more acceptable than defining oneself as L, G, or B.
← 12. Legal protections and social acceptance of LGBTI+ individuals are strongly interlinked. While countries with greater acceptance of sexual and gender minorities are more likely to pass LGBTI+-inclusive laws, evidence shows that legal changes in favour of LGBTI people in turn do cause changes in attitudes towards this population. Individuals perceive legal changes as reflections of advancements in what is socially acceptable and many are willing to conform to these shifts (Tankard and Paluck, 2017[90]). For instance, in European countries where same‑sex marriage is legal, acceptance of homosexuality increased much faster after those countries adopted same‑sex relationship recognition policies (Aksoy et al., 2020[88]). In the United States, a similar trend was observed. While both implicit and explicit antigay biases were already on the decline before state‑level same‑sex marriage legalization, they decreased at a sharper rate following legalisation (Ofosu et al., 2019[89]) More generally, same‑sex marriage legalisation across US states led to an increase in employment of people in same‑sex couples, a change driven by improvements in attitudes towards homosexuality and, hence, lower discrimination against LGB individuals (Sansone, 2019[75]).
← 13. Both correlations are statistically different from zero at the 99% confidence level.
← 14. On 28 March 2022, the Florida Legislature passed HB 1557, the “Parental Rights in Education” bill, also named the “Don’t Say Gay” bill. This bill prohibits classroom instruction on sexual orientation or gender identity before the 4th grade and requires such instruction to be “age‑appropriate or developmentally appropriate”.
← 15. Higher LGBTI+ self-identification among AFAB individuals and the increasing gap in LGBTI+ self-identification between AFABs and AMABs hold after accounting for differences between these groups with respect to geographic location, age, race/ethnicity, partnership and parental status, number of adults in the household, and educational attainment. Results available upon request.
← 16. Higher LGBTI+ self-identification among young adults and the increasing gap in LGBTI+ self-identification between them and the broader population hold after accounting for differences between these groups with respect to geographic location, age, race/ethnicity, partnership and parental status, number of adults in the household, and educational attainment. Results available upon request.
← 17. Even when restricting the sample to married adults living with only one other adult (likely the spouse), LGBTI+ are approximately 15 percentage points less likely to live in a household with at least one child under 18. This penalty is consistent and statistically significant at the 99% confidence level across all LGBTI+ subgroups. Results available upon request.
← 18. In addition, LGBTI+ adults, especially non-cisgender adults, face challenges accessing adequate health insurance: LGBTI+ adults are more likely than non-LGBTI+ adults to not be covered by a health insurance or a health coverage plan, and more likely to have insurance through Medicaid (Medina and Mahowald, 2023[36]).
← 19. Logistic regressions estimated using the Gallup US Daily Survey (2017) shows a 5% penalty in college attainment for young adults, and a 5% and 10% college premium for prime and mature adults, respectively. All estimates are statistically significant at the 99% confidence level. Results available upon request.