Hungary has improved its waste and material management by increasing recycling and recovery. However, its efforts to foster the transition to a circular economy have so far been limited. This chapter provides an overview of trends in material consumption and waste management, as well as related policy and institutional frameworks. It discusses the country’s main objectives for waste and material management over the last decade and assesses performance in these areas. The chapter also examines Hungary’s progress in promoting a circular economy.
OECD Environmental Performance Reviews: Hungary 2018

Chapter 4. Waste, material management and circular economy
Abstract
The statistical data for Israel are supplied by and under the responsibility of the relevant Israeli authorities. The use of such data by the OECD is without prejudice to the status of the Golan Heights, East Jerusalem and Israeli settlements in the West Bank under the terms of international law.
4.1. Introduction
Hungary has a well-developed policy and legal framework for waste management, mainly driven by EU requirements and supported by quantitative targets and economic instruments. It has taken steps to improve material management, but has so far shown limited efforts to foster the transition to a circular economy. There are positive waste management trends: decoupling of waste generation from economic growth, increased recycling and recovery rates, and decreased use of landfilling. However, Hungary remains an average performer and in some aspects – such as glass recycling – lags behind its European neighbours.
The transition to a circular economy requires new policies, new business models and new ways of working with businesses and society. Hungary’s recent institutional instability, re-centralisation of waste-related governance and lack of collaborative mechanisms for a circular economy may undermine progress in this field.
4.2. Trends in material consumption and waste management
4.2.1. Material consumption
Sustainable material management is a challenge in Hungary since the country is poor in raw materials, relying on energy and material imports (EEA, 2016a). Hungary’s economy is less resource-intensive than that of other European countries of the OECD. Domestic material consumption (DMC) per capita amounted to 10.9 tonnes (30 kg per person per day) in 2016. This is below the OECD Europe average (35 kg per person per day).
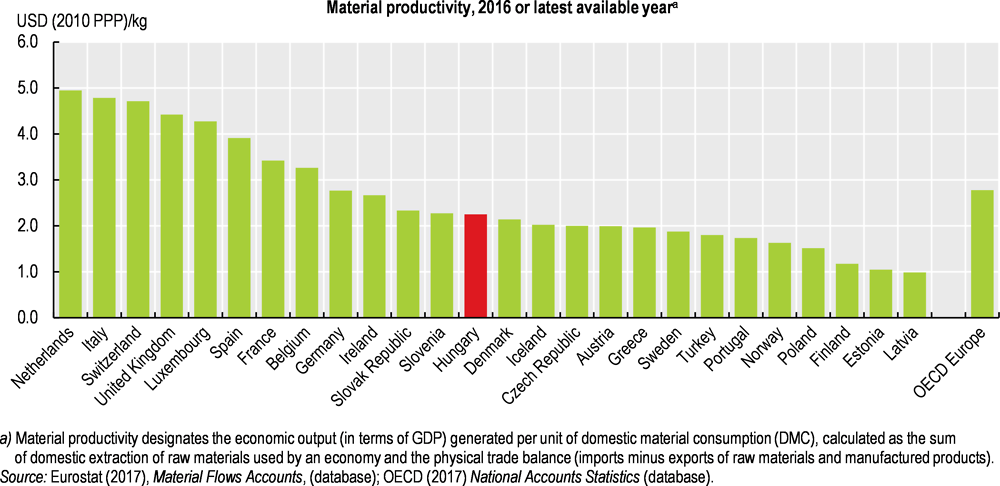
In terms of material productivity (defined as the amount of economic value generated per unit of material used, or gross domestic product [GDP] per unit of DMC), Hungary is below the OECD Europe average (Figure 4.1). This indicates that the country could use material resources more efficiently to produce wealth. However, its performance is similar to that of neighbouring Central European countries such as Slovenia, the Czech Republic or the Slovak Republic.
Figure 4.1. Material productivity remains below OECD Europe average
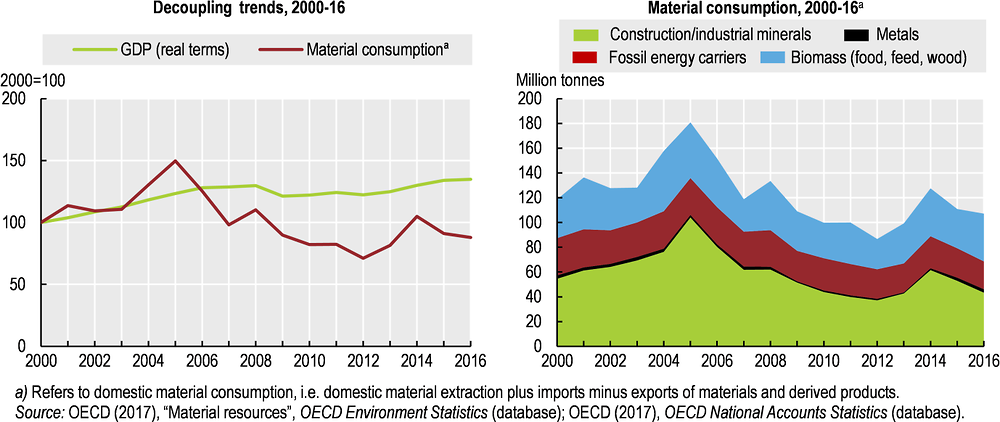
DMC decreased by 12% between 2000 and 2016. It dropped by 35% between 2008 and 2012 due to the economic crisis, but increased again with the economic recovery (Figure 4.2).
Figure 4.2. Material consumption, dominated by construction minerals and biomass, is declining
In 2016, about 40% of the materials consumed were construction minerals, a share slightly lower than the OECD average, followed by biomass (36%) and fossil energy carriers (21%). The peak in use of construction minerals observed in 2005 is reported to be the result of motorway construction and the related gravel, sand and clay extraction.
Around 30% of the materials were imported in 2016. The country is particularly dependent on imports of fossil fuels. In terms of material outputs, an estimated 30% of the materials are used for products that are exported; about 70% of materials are consumed in the country. Nearly 15% of Hungary’s consumption ends up as waste.
4.2.2. Trends in waste generation and management
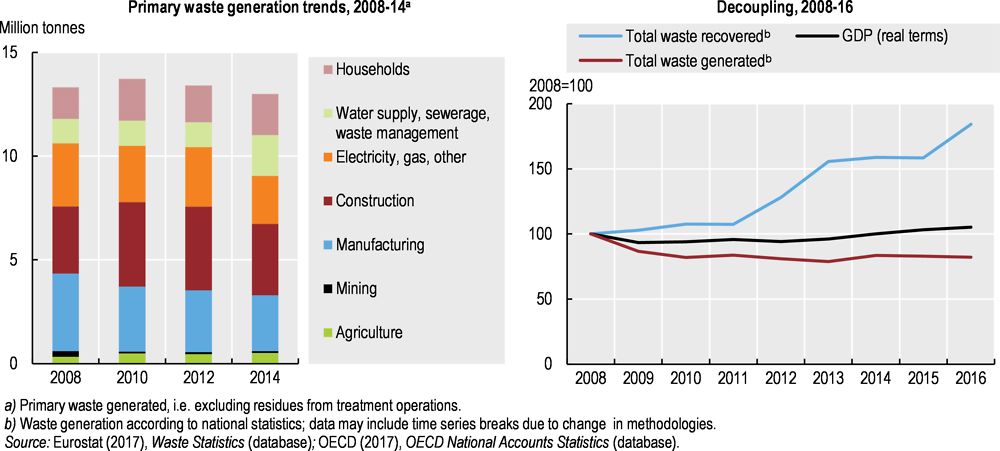
Hungary generated about 16 million tonnes of waste in 2014. As in many countries, construction and demolition (C&D) waste constituted the largest share. From 2008 to 2015, total waste generation decreased by 17% while GDP increased by 3%, which is a significant achievement (Figure 4.3).
Figure 4.3. Total waste generation is declining, while recovery is increasing
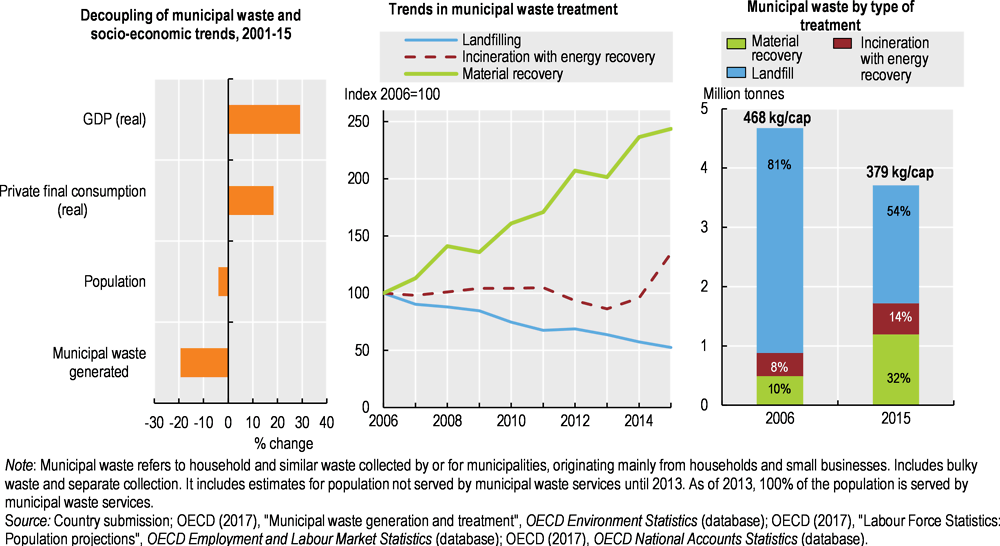
In recent years, Hungary has achieved decoupling between GDP growth and municipal waste generation (Figure 4.4). In 2014, it generated 3.8 million tonnes of municipal solid waste (MSW), 73% of which originated from households (EEA, 2016b). Municipal waste generation decreased by around 19% between 2001 and 2015 despite significant GDP growth (+29%). In 2015, Hungary generated 379 kg/capita of MSW, well below the OECD average of 520 kg/capita. Together, plastics, paper and cardboard, glass and metal represent close to 45% of municipal waste, while organic waste represents about 23%.
Figure 4.4. Landfilling of municipal waste is going down, but remains high
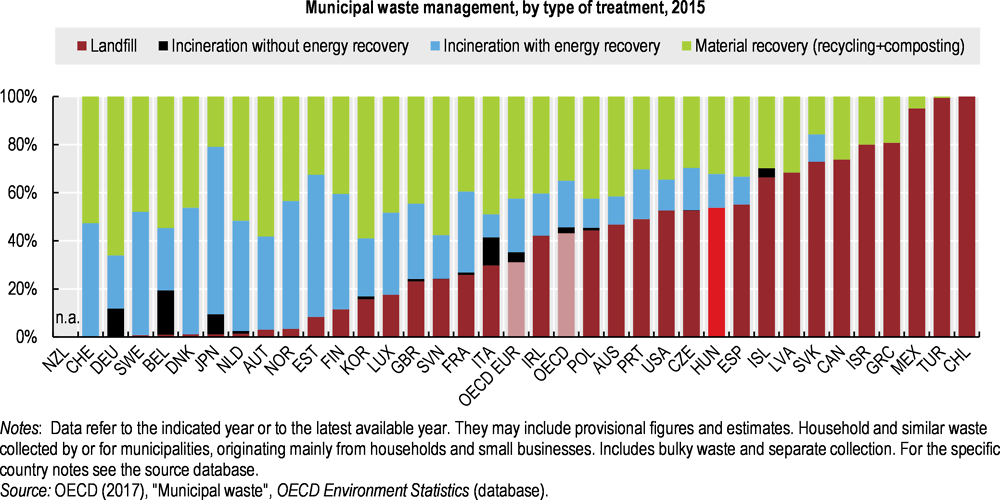
Landfilling remains the most frequent treatment option for municipal waste (54% in 2015). However, material recovery rates (including recycling and composting) steadily increased from 10% to 32% over 2006-15 (Figure 4.4). This rate is still below the OECD average (Figure 4.5). Energy recovery slightly increased from 9% to 14% between 2008 and 2015.
Figure 4.5. Hungary is lagging behind in waste recovery
C&D waste represents around 22% of total waste generation with important yearly variations during the review period. In 2008, Hungary produced 3.2 million tonnes of C&D waste. This amount grew to 4 million tonnes in 2010 and 2012, then came down to 3.4 million tonnes in 2014. The share of landfilling has significantly decreased (a 53% decrease since 2009) with the increase of material recycling. In 2016, 23% of all C&D waste was landfilled.
Overall, the generation of hazardous waste decreased substantially from around 1.4 million tonnes (HCSO, 2014) in 2006 to about 550 000 tonnes in 2016 with strong annual variations. Chemical waste, contaminated soils, mineral wastes from waste treatment and waste oils are the most important categories of hazardous waste (BiPRO, 2014c). Industrial hazardous waste from the energy sector, manufacturing, and mining and quarrying has been on the decline since 2010 (EEA, 2016c).
4.2.3. The information basis
Hungary has good quality data on waste and material flows. It has developed a good monitoring system for waste generation and treatment since the establishment of the Waste Management Information System (HIR) in 2004. The HIR, based on the European Waste Catalogue, receives around 25 000 data entries per year (HCSO, 2014). Prior to 2004, the general data availability for waste management was poor. Estimates often complemented sporadically collected data (EEA, 2016b).
In 2015, a web-based Electronic Waste Information System (EHIR) was set up as part of the government’s National Environmental Information System (OKIR). EHIR contains data from quarterly or annual mandatory reporting by waste generators, collectors, transporters, dealers, brokers and treatment facilities (OKIR, 2015). Aggregated data have been publicly available since 2004.
Material flows are monitored and analysed in accordance with the 2001 Eurostat methodological guidelines, which are aligned with OECD methodology for material flows and indicators. Since 2007, the Hungarian Central Statistical Office (HCSO) has published annual nationally aggregated material flow accounts. HCSO produces indicators such as DMC, domestic material input and domestic extraction. The indicators are used in a series of government publications such as the Indicators of Sustainable Development and other environmental reports.
While the quality of data on waste and material flows is good, data are not easily accessible to the public and key stakeholders (Rayment et al., 2017). Improving accessibility of information could facilitate better monitoring of industry initiatives on resource efficiency and waste prevention.
4.3. Legal and institutional framework for waste and circular economy
4.3.1. Institutional arrangements
At the national level, the Ministry of Agriculture is the main authority for waste management policies. It is also the lead ministry for the transition to a circular economy, albeit this transition is perceived as an extension of waste management policies. The Ministry of National Development has oversight of key public services, including MSW management. The Prime Minister’s Office and other ministries, such as the Ministry of National Economy which oversees innovation policies, could play a more active role in promoting resource efficiency. There is no dedicated institutional co‑ordination mechanism between the different ministries for the promotion of a circular economy.
During the review period, waste management authorities were subject to several administrative reshuffles. The National Waste Management Agency (2011-15) was the single national co‑ordinator for waste management policies. It organised the collection and recovery of waste, including the separate collection systems to be financed with environmental product fees. It also assisted regional authorities with regional waste management plans. The Agency was replaced by the National Waste Management Directorate (NWMD) of the National Inspectorate for Environment and Nature, which operated in 2015-17. The NWMD managed the waste information system, waste data and indicators, and its duties covered municipal, industrial and commercial waste subject to a product fee. It also raised awareness about waste prevention and recycling (including for separate collection). In 2017, the NWMD was incorporated into the Ministry of Agriculture.
At the county and local levels, institutional settings for waste management were also deeply transformed in 2012, following the municipal and territorial public sector reform and adoption of the new Act on Waste. The territorial reform led to recentralisation of counties’ responsibilities and the creation of government offices as deconcentrated administration bodies at the county and district levels (Chapter 2. ).
Counties and municipalities have lost important waste management planning responsibilities. Until 2013, county authorities developed regional waste management plans with support of the National Waste Management Agency. Municipalities then developed their own local waste management plans based on the regional plan. At present, counties and municipalities no longer develop separate local waste management plans.
Municipalities are still responsible for public waste management service contracts, including collection, transport, treatment of waste, and operation and maintenance of waste management facilities. However, they have limited flexibility. The Act on Waste created a new obligation to attribute such contracts only to certified public service operators. These operators are non-profit business associations in which the state of local governments control the decision-making process (for instance, through a majority of shares or voting rights arrangements). In 2016, there were around 130 public service operators. In addition, some local authorities have also created about 40 associations to carry out this responsibility jointly.
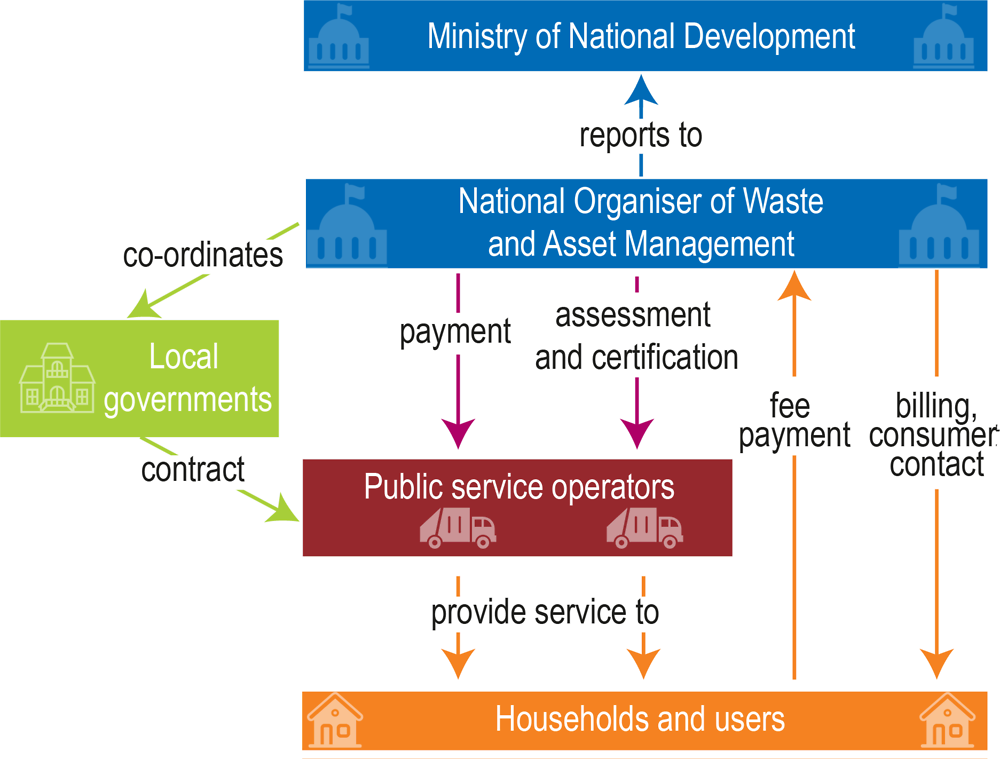
The system created in 2012 allowed for better oversight of private sector activities by the government. At the same time, it limited incentives for public service operators to collect waste for recovery. In addition, the various service operators and local governments lacked co‑ordination, and local authorities charged different prices. To overcome these issues, Hungary further recentralised some of the tasks of local governments. It set up a co-ordinating body called the National Organiser of Waste and Asset Management (NHKV) in April 2016. This central body oversees payment for public waste management services, taking over this role from local authorities (Figure 4.6). The new governance structure for municipal waste management poses several risks. It could limit the capacity of local authorities to tailor waste management services to local needs, restrain them from setting more ambitious objectives than the minimum national requirements, and limit their ability to promote the circular economy.
Figure 4.6. Municipal waste management responsibilities have been centralised
Source: Country submission.
4.3.2. Legal framework
Hungary has a comprehensive framework in place for waste management policies, in line with EU legislation. The 2000 Act on Waste was the main legal instrument in this domain. After significant modifications by the 2012 Act on Waste, it was updated again in 2014 to address requirements of the EU Waste Framework Directive (2008/98/EC).
The 2011 Act on Environmental Product Fee is also particularly relevant for waste management as it implements the extended producer responsibility (EPR) principle. The fee covers a wide range of products, including packaging (metal, paper, wood, glass), paper, tyres, batteries, electrical and electronic products, oils, plastic bags and plastic products, cosmetics, soaps and detergents, and lubricating oils.
These laws are complemented by a series of decrees on specific waste streams: packaging, C&D waste, batteries and accumulators, end-of-life vehicles, hazardous waste, and waste electrical and electronic equipment (WEEE). There are also decrees related to waste treatment operations, transport and transboundary shipments of waste, public waste management services, registering and licensing, and data reporting.
4.4. Policy framework and objectives
4.4.1. Waste management policies
Hungary’s comprehensive waste management policy framework is driven by EU waste legislation. For example, in accordance with the EU Landfill Directive, Hungary sought to reduce the amount of biodegradable municipal waste landfilled to a maximum of 75% by 2004, 50% by 2009 and 35% by 2016 compared to 1995 levels.
The first National Waste Management Plan (NWMP) for 2003‑08 focused on diverting biodegradable municipal waste from landfills in line with EU objectives. A second NWMP for 2009-14 was drafted, but never officially adopted. The lack of a waste management plan was partly compensated by two other documents: the Strategy for the Management of Biodegradable Waste in Municipal Solid Waste Management 2004-16 and the Development Strategy for Municipal Solid Waste Management 2007-16. The National Environment Programme (2009-13) also included overall waste management objectives.
The current NWMP 2014-20 (Box 4.1) was adopted in December 2013. It focuses on enhancing recovery rates, setting up and improving separate collection, reducing waste generation, providing training and information, and fostering the reuse of products. It sets out key principles highlighted in EU waste policies such as the waste hierarchy, which calls for priority first on prevention, then reuse, recycling, other recovery and disposal.
In addition to the NWMP, Hungary has been developing detailed yearly National Plans for Collection and Recovery (NPCR) since 2012 and the National Waste Management Public Services Plan (NWMPSP) since 2016. The NPCR includes financial planning for EPR-managed waste and the environment product fees (with expected costs for the collection, pre-treatment and recycling of materials). The NWMPSP addresses mainly municipal waste management and lays down national targets and minimum levels of public services for individual waste management areas.
Box 4.1. Waste management objectives are driven by EU targets
The NWMP 2014-20 identifies needs related to recycling and recovery in nine focal areas: municipal waste; non-hazardous production waste; non-hazardous agricultural and food industry waste; sewage sludge; C&D waste; hazardous waste, particularly high-priority hazardous waste streams; packaging waste; biodegradable waste; and waste tyres. The NWMP also includes monitoring requirements.
The plan incorporates the National Waste Prevention Programme. Its main objectives are to promote the decoupling of resource use from economic growth, reduce material use and waste generation, manage resources more efficiently, promote solutions with the lowest impact on the environment during the life-cycle of products and economic activities, and promote job creation. The programme identifies five main areas of action: prevention of the generation of C&D waste, reuse, green public procurement, environmentally friendly production and management, and awareness raising.
It also includes figures and analysis for the previous period (2009-14), as well as quantitative targets for specific waste streams that are set mainly in EU directives as follows:
The preparation for reuse and recycling rate of municipal paper, plastic, metal and glass waste should be increased to 50% by 2020 in line with Directive 2008/98/EC.
Batteries and accumulators must be recycled (recycling processes must achieve a minimum efficiency of 65% for lead-acid batteries, 75% for nickel-cadmium batteries and 50% for other batteries) in line with Directive 2006/66/EC.
From 1 January 2016, the total amount of the separately collected WEEE should be at least equivalent to 45% of the average amount of WEEE that had been put on the market in the three preceding years in line with Directive 2012/19/EU.
By 2020, the preparing for re-use, recycling and other material recovery of non-hazardous C&D waste should be enhanced up to 70% (measured by weight) in line with Directive 2008/98/EC.
Source: Country submission.
Hungary is anticipating difficulties with the new EU circular economy package, which includes legislative proposals on waste with long-term targets to reduce landfilling, as well as to increase recycling and reuse. There are particular concerns about its ability to meet future recovery and recycling targets.
4.4.2. Circular economy and material management policies
Hungary does not have a dedicated policy framework for a circular economy. Instead, several national strategies and action plans address the issue of material and resource management. The 4th National Environment Programme (NEP) (2015-20), which is the overarching strategy for environmental policy, identifies resource efficiency as a priority. Other sectoral strategies and plans, such as the National Environmental Technology Innovation Strategy (NETIS), the National Framework Strategy on Sustainable Development, the National Forest Programme, the National Energy Efficiency Action Plan and the Renewable Energy Action Plan 2010-20, emphasise resource efficiency as well.
Hungary uses material flows information and indicators for target setting. As part of NETIS, it has adopted 17 targets for sustainable resource management to be achieved by 2020 (Table 4.1). Hungary has set an objective to reduce its material intensity (the ratio between DMC and GDP) to 80% of the 2007 level by 2020. It has also set objectives to increase recycling of packaging waste and decrease generation of MSW. Nevertheless, such targets remain indicative and are not related to any specific policy measures or action plan. Their level of ambition is not adapted following the monitoring of performance.
Table 4.1. Sustainable resource management targets remain indicative and often lack ambition
|
Indicator (compared to 2007 level =100) |
2007 |
2012 |
2013 |
2014 |
2015 |
2016 |
Target 2020 |
|---|---|---|---|---|---|---|---|
|
1. Material intensity |
100 |
74.6 |
83.9 |
104.1 |
97.3 |
.. |
80 |
|
2. Energy intensity |
100 |
91.6 |
90.7 |
86.8 |
89.9 |
.. |
80 |
|
3. Water intensity |
100 |
90.4 |
85.4 |
80.8 |
79.5 |
.. |
80 |
|
4. Import dependence on fossil fuels |
100 |
92.5 |
95.9 |
106.4 |
94.2 |
.. |
75 |
|
5. Share of renewables in electricity production |
100 |
134.0 |
140.4 |
155.3 |
155.3 |
.. |
275 |
|
6. Energy efficiency of road transport |
100 |
88.1 |
77.8 |
83.1 |
87.7 |
.. |
80 |
|
7. Energy efficiency of rail transport |
100 |
91.2 |
81.1 |
86.9 |
95.2 |
.. |
85 |
|
8. Consumption of packaging material in trade |
100 |
104.6 |
105.6 |
104.5 |
119,7 |
.. |
75 |
|
9. Generation of municipal solid waste |
100 |
88.0 |
82.7 |
84.2 |
82.5 |
82.9 |
70 |
|
10. Recycling of packaging waste |
100 |
110.1 |
110.4 |
109.3 |
106.4 |
.. |
150 |
|
11. Wastewater generation |
100 |
81.6 |
93.0 |
92.4 |
92.7 |
105.2 |
70 |
|
12. Population connected to wastewater treatment plants |
100 |
106.0 |
107.4 |
109.7 |
112.6 |
115.5 |
125 |
|
13. Environment-related public and private R&D expenditure |
100 |
108.1 |
118.2 |
99.9 |
.. |
.. |
200 |
|
14. Trade of energy-saving equipment |
100 |
.. |
.. |
.. |
.. |
.. |
250 |
|
15. Share of employment in environmental industry |
100 |
89.2 |
93.0 |
87.6 |
.. |
.. |
200 |
|
16. Environment-related patents and certifications registered |
100 |
34.6 |
35.7 |
.. |
.. |
.. |
300 |
|
17. Export income from environmental industrial activities |
100 |
135.2 |
112.7 |
110.0 |
.. |
.. |
150 |
Source: Country submission.
4.5. Strengthening waste management performance and accelerating circular economy transition
While it is on track to meet most of its waste management objectives, Hungary remains an average performer in promoting recovery and recycling of waste. There is growing interest in the transition to a circular economy, but public authorities do little to support local and business initiatives in this field. As the country has used EU funds primarily to invest in treatment infrastructure for unsorted municipal waste, it is now focusing on separate collection systems to enhance municipal waste recycling. Waste prevention measures, especially for C&D waste, are also a priority.
Economic instruments are in place to contribute to waste management objectives. However, the price of landfilling remains low despite the introduction of a landfill tax. Changes to municipal waste tariffs could be undermining cost recovery and further investments in waste management services. Product fees and the new governance system for EPR do not seem to be conducive to improved environmental performance and engagement of the private sector.
4.5.1. From landfilling to waste reduction and recycling
Remediation of former landfills
By 2009, Hungary had successfully closed old former landfill sites that did not comply with EU standards. Seventy landfill sites are now operating with a permit, of which 60 are owned by local governments. Remediation programmes for former landfills are being rolled out. Between 2007 and 2013, 23 former landfill sites were remediated for a total of HUF 39.3 billion (around EUR 127 million) through the Environment and Energy Operational Programme. At the same time, 889 abandoned landfill sites were re‑cultivated. The Environment and Energy Efficiency Programme for 2014-20 also earmarks funds for environmental remediation, including that of landfills. Despite efforts to control landfill sites, illegal dumping remains high in Hungary. The Ministry of Agriculture supports awareness-raising campaigns to address this problem, for instance through participation in the “TeSzedd!” (“Pick up!”) campaign. Since 2011, the “Pick up!” campaign has taken place annually to raise awareness about sound waste management practices. Each year, more than 100 000 volunteers clean up litter and illegal dumpsites throughout Hungary.
Municipal waste
Landfills are still the most frequent destination of waste: 54% of municipal waste ends up in landfills. Material recovery of municipal waste has increased steadily since 2008 and reached 32% in 2015, but remains below the OECD average. Composting is at a particularly low level.
Hungary has one municipal waste incinerator with energy recovery connected to district heating in Budapest. It has an annual capacity of 420 000 tonnes per year (around 11% of the total generated municipal waste in 2015). However, Hungary considers that additional incineration capacity, including regional incinerators, may be needed to reduce the landfill disposal rate by 2030 in line with future EU targets. An incineration project for sewage sludge and municipal waste is at an early stage of development. The country has invested massively in municipal waste pre-treatment and sorting facilities. In 2014, its 23 mechanical biological treatment plants operated with a capacity of nearly 1.2 million tonnes per year (EC, 2016). The high capacity of such plants and additional incineration capacity for unsorted municipal waste may be detrimental to separate collection efforts to promote high quality recycling.
Hungary had introduced a ban on landfilling of untreated waste and hazardous waste prior to EU accession in 2004. Subsequently, it progressed rapidly towards the diversion of biodegradable municipal waste from landfill. Hungary met the requirements of the EU Landfill Directive (1999/31/EC) to progressively reduce the amount of biodegradable waste going to landfill until 2016. In that year, the Hungarian government reported achieving the objective to reduce the amount of biodegradable waste going to landfills by 65% compared to 1995 levels. Furthermore, Hungary is on track to meet the Waste Framework Directive targets to increase the recovery rate of municipal paper, plastic, metal and glass waste to 50% by 2020. This rate was 41% in 2014.
Regarding packaging waste, Hungary overachieved most of the recovery and recycling objectives for specific waste flows set in the EU Packaging and Packaging Waste Directive (94/62/EC). However, it failed to meet the overall recycling objective of 55% for packaging waste during 2012-14 mainly due to the low recycling rate for glass (Table 4.2). To remedy this situation, Hungary introduced as of January 2018 take-back obligations for glass for large supermarkets retailers. Most EU countries have achieved high glass recycling rates: Sweden and Belgium have exceeded 90%. Some high performing countries combine a “bring system” for glass (whereby the consumer brings waste to a collection point) with a deposit-refund system (often for refillable containers). For example, a deposit-refund scheme for both single-use and refillable beverage containers in Lithuania proved instrumental in raising the collection rate for glass beverage containers from 32% to 73% within a few months in 2016 (USAD, 2017). Door-to-door separate collection of glass or pay-as-you throw schemes charging users for waste (measured by weight or volume) could also help enhance glass recycling.
Table 4.2. The recycling of glass packaging remains particularly low
|
Recycling targets of Directive 94/62/EC |
Achieved in 2014 |
|
|---|---|---|
|
Paper |
60% |
74.5% |
|
Plastics |
22.5% |
49.9% |
|
Glass |
60% |
36.3% |
|
Metals |
50% |
83.5% |
|
Wood |
15% |
33.7% |
Source: Country submission.
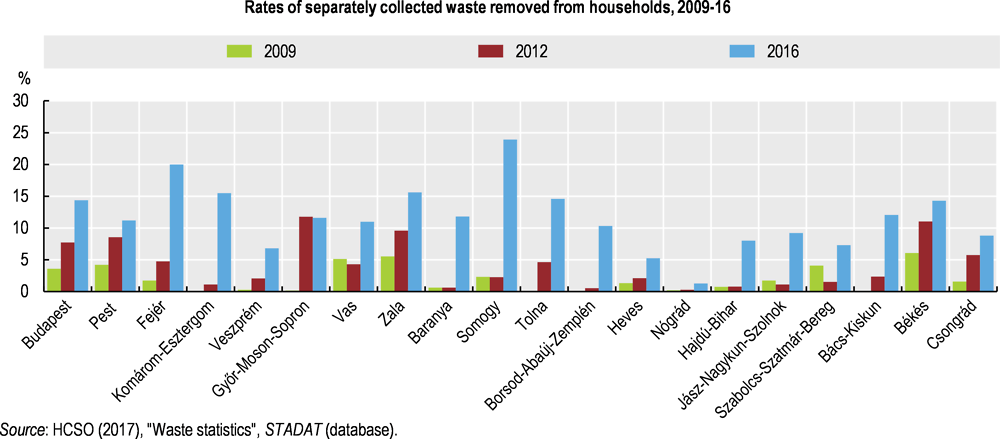
Separate collection of household waste, which promotes quality recycling, increased during the review period, but remains low. There are important variations between counties. Budapest, Békés and Zala, for example, reached separate collection levels of around 15%, while separate collection was virtually inexistent in Nógrád in 2016 (Figure 4.7). A possible explanation for low separate collection rates could be the burning of solid waste for heating. This remains a widespread practice in Hungary despite awareness-raising campaigns to inform the public about its health and environmental consequences. Together, plastics, paper and cardboard, glass, metal and organic waste represent close to 68% of municipal waste. This indicates there is room to improve separate collection of household waste, leading to higher recycling rates. The introduction of door-to-door separate waste collection obligations in 2015 and the earmarking of EUR 300 million of EU funds for 2014-20 to improve public waste management services should also help increase recycling rates.
Figure 4.7. Separate waste collection increased, but remains low and varied across counties
Regarding prevention of municipal waste, Hungary has been active in the European Waste Reduction Week, a European-wide awareness-raising campaign for waste reduction. It has also joined initiatives such as the “Green list campaign” to encourage shopping practices that reduce waste. However, the National Waste Prevention Programme does not set quantitative objectives for waste prevention, making it difficult to monitor progress.
Construction and demolition waste
C&D waste is a priority in the Hungarian Waste Prevention programme. To boost prevention and management of C&D waste, a new government decree is planned for adoption in 2018. It aims to introduce mandatory waste prevention plans for construction activities, promote selective demolition to help remove recyclable and reusable parts of C&D waste, and foster sales centres for C&D reusable materials.
A large share of treated C&D waste is now recovered. It is mainly used for backfilling, where waste replaces non-waste materials in excavation or landscaping. In 2013, re-use, recycling and other material recovery of non-hazardous C&D waste reached 63%. This means that the country is on track to meet the objective of 70% by 2020.
Nevertheless, it is not always clear whether these landscaping operations would take place regardless of the availability of waste. Some suggest that backfilling is a way for operators to avoid paying the landfill tax for C&D waste (Deloitte et al., 2015).
Hungary has a mining royalty fee that applies to extraction of virgin construction materials. However, the fee is not conceived as an economic instrument for environmental purposes. Its level is not set to promote use of secondary raw materials.
Industrial waste and hazardous waste
Industrial waste and hazardous waste are not targeted by a specific policy or strategy, but are covered by general objectives of the NWMP. Since 2017, industrial waste is covered by the landfill tax, which could help further divert waste from landfills.
During the review period, Hungary experienced several accidents, putting in question the effectiveness of its hazardous waste management. In 2010, a dam break led to a red mud toxic spill near Kolontár (killing ten people and polluting land over several kilometres). Environmentalists pointed to several weaknesses ranging from the lack of inspections and controls to inappropriate waste management licensing. The waste storage licence for the red mud failed to recognise its hazardous qualities. In another case, environmental non‑governmental organisations alerted Hungarian authorities in 2015 to about nearly 3 000 tonnes of hazardous waste. It was stored in corroded and leaking barrels on the yard of the defunct plant of the Budapest Chemical Works site in the city of Budapest. Although the waste has been removed, the soil has yet to be remediated. The case shows the limits of the environmental liability regime for contaminated sites (Chapter 2. ).
Waste shipments
Regarding transboundary movements of waste, Hungary has intensive waste trade with its neighbouring countries. It has been party to the Basel Convention since 1992 and implements the 2006 EU waste shipment regulation. Hungary also prohibits the import of hazardous and municipal waste, as well as municipal waste incineration residues, for disposal.
The country reports to the European Commission and the Basel Convention secretariat all hazardous waste shipments and some additional categories of waste (including some non‑hazardous waste) in line with the EU waste shipment regulation. In 2011, Hungary exported more than 1.1 million tonnes of mainly non-hazardous (green-listed) waste destined for recovery operations in other EU member states.
Hungary is a net exporter of hazardous waste. However, exports remain low compared to other European countries on a per capita basis. According to Eurostat data, it exported 3 kg per capita in 2014 compared to an average of 12 kg in the European Union. In 2015, Hungary exported close to 30 000 tonnes of hazardous waste compared to its imports of 2 000 tonnes of waste. Exports mainly consisted of acid lead accumulators (24 000 tonnes). The main export destinations are neighbouring EU countries. Such exports are expected to decrease substantially after a recovery facility for such products opened in Jászberény in 2015. Imports come mostly from Romania and consist of end-of-life appliances containing hydrofluorocarbons.
In 2015, Hungary established a specific department to control and authorise transboundary waste shipments. The new authority is preparing annual control plans and reports on waste shipments and controls. During the review period, Hungary increased the number of on-site inspections related to waste shipments (60 cases in 2016). It also set up a 24-hour service called Green Commando to detect international illegal waste shipments.
4.5.2. Improving waste management performance through economic instruments
Hungary has increased the use of economic instruments with the introduction of a new landfill tax and the extended use of product fees. The country has also changed the system for waste tariffs, which are now set at the national level. The latter reform, along with limiting the private sector’s role in EPR schemes, may help the central government in its co-ordination role, avoiding wide regional waste-tariff discrepancies and facilitating access to waste data. However, these actions may have detrimental long-term effects on waste management performance.
Waste tariffs
Since 2008, there has been a major change in tariffs for waste management services to households. They were capped in 2013 (at around 90% of the 2012 level) by the new Act on Waste. This move was part of government efforts to reduce the financial burden on households. Furthermore, since 2013 waste tariffs have been determined at the national level and no longer by municipalities. Since April 2016, the NHKV has been billing and collecting public waste management service fees from the population and paying for the service of public service operators.
The new system was introduced to eliminate wide discrepancies in tariffs and waste performance between municipalities. The standard fee can be corrected depending on the quality of the waste management services and fulfilment of waste management targets. However, there are concerns that the fee levels do not guarantee recovery of actual waste management costs (EC, 2017). It is doubtful whether the new system will encourage further initiatives by municipalities to significantly improve waste management services. The new system could be subsidising waste management services to the detriment of the polluter pays principle. There is also a risk that tariff setting becomes overly politicised, leading to below-cost fees and deteriorating services. Hungary should undertake robust monitoring and evaluation of the new system to validate the choice of institutional arrangements and ensure overall cost recovery.
Landfill tax
A landfill tax was introduced in 2013 and rose from EUR 10 (HUF 3 000) per tonne to EUR 20 (HUF 6 000) per tonne in 2014, with revenues earmarked for waste management. At the same time, its scope was extended to cover industrial waste. The tax was expected to grow up to EUR 40 (HUF 12 000) per tonne in 2016. However, the rates were frozen at 2014 levels and later increases have not been implemented. The government reported that such an increase could be counterproductive and lead to more illegal dumping. As a result, the cost of landfilling remains low, which could represent a set-back for the promotion of recycling.
In the new state-controlled system for municipal waste management, public service operators are obliged to fulfil recycling targets and other minimum requirements defined in the NWMPSP, while tariffs are set the national level. The main driver for public sector operators is no longer the price of waste treatment operations (i.e. the landfill tax), but rather the minimum standards set by the NWMPSP. To maintain the landfill tax as an incentive, the tax should be increased to a level that would encourage municipalities and operators to go beyond the minimum requirements set in the NWMPSP.
Product fees
Fees were introduced in 2012 for a wide range of products, including batteries, packaging materials, electrical and electronics equipment, tyres, plastic bags, plastics and office paper. The single-use carrier bag tax (at HUF 1 900 per kg), which is one of the environmental product fees, has been an effective way of stimulating the shift to reusable bags and contributing to waste prevention. The consumption of single-use plastic bags fell from 3.3 thousand tonnes in 2011 to 1.7 thousand tonnes in 2012.
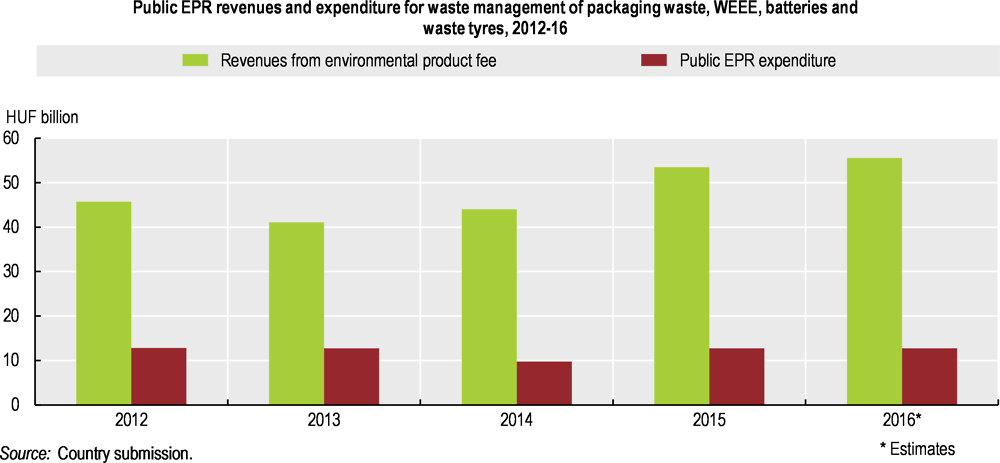
Product fees were extended to additional categories, including photovoltaic panels, in 2015. However, this instrument does not always seek to achieve environmental objectives and promote environmental performance. Rather, product fees are primarily a fundraising tool for the central state budget. It is estimated that only 22% to 31% of the product fee revenue is used for financing the collection and treatment of waste products (Figure 4.8). Without a clear link between the cost of end-of-life management and the fee amount, the fee does not provide a sufficient incentive to improve eco-design and product performance.
Figure 4.8. Product fee revenues largely exceed expenditure for end-of-life product management
Extended producer responsibility schemes
Product fees are combined with a wider EPR system with take-back obligations for several products. These include packaging, industrial and automotive batteries, and some WEEE. End-of-life vehicles and medicines benefit from take-back obligations, while tyres and lubricants are only subject to product fees (Table 4.3). National targets correspond to EU targets for collection and recycling of all these products apart from medicines. Collection objectives for WEEE and batteries have been fulfilled. Hungary took steps to improve the performance of EPR schemes. In 2015, for example, it introduced a system of coupons to help increase collection of WEEE. When consumers take back their e-waste to a selling point, they get a coupon for purchasing the next piece of electrical or electronic equipment. Nevertheless, Hungary had difficulties meeting the EU packaging targets in 2012-14 (EC, 2017) mainly due to failure to achieve glass packaging recycling targets.
Table 4.3. Extended producer responsibility schemes and product fees
|
Products covered by the environmental product fee (without regulatory EPR scheme) |
Products covered by a regulatory EPR scheme (without environmental product fee) |
Products covered by a regulatory EPR scheme and subject to the environmental product fee |
|---|---|---|
|
Tyres; lubricants |
Portable batteries; WEEE categories 5, 5a, 8; end-of life vehicles; medicines |
Packaging; industrial and automotive batteries; WEEE categories 1-4, 6-7, 9-10 |
Source: Country submission.
Hungary modified the governance of EPR schemes in 2012. Until then, producers could either join a producer-funded producer responsibility organisation (PRO) or choose self-compliance. Since 2012, some EPR schemes (packaging, industrial and automotive batteries, some WEEE) have been modified. They now give producers a choice between a central co-ordination system managed by the national government together with a product fee, or self-compliance with a reduced fee. For such products, PROs are no longer allowed to operate. There are other examples of government-run EPR systems such as the system for WEEE in some US states (Washington, Connecticut) and the People’s Republic of China. However, most OECD member countries have opted for EPR approaches that give producers managerial or decision-making responsibilities within either a single PRO or competing PRO systems.
According to government officials, the system has helped make waste management data more reliable and enhanced recycling in the short term. However, it has raised concerns that taxes on producers under the auspices of the government-run EPR system will be directed to non-EPR purposes. This could lead to higher long-term costs for the system, while incentives to improve products via eco-design remain limited. Hungary should monitor and evaluate the new institutional arrangements for EPR schemes to analyse and address potential longer-term negative impacts.
4.5.3. Steering the shift towards a circular economy
Hungary lacks a steering mechanism for the transition to a circular economy. There are ongoing efforts to include resource efficiency and circular economy in cross-cutting and sectoral policies such as NETIS. However, the targets set in NETIS remain indicative and are not translated into other policy measures and mechanisms. The Irinyi Plan on Innovative Industry Development Directions could provide an opportunity to encourage the move to a circular economy in the production value chain.
Several non-governmental initiatives address circular economy issues. The Hungarian Cleaner Production Centre of the Corvinus University of Budapest is involved in international and European projects to promote best practices on resource efficiency and cleaner production. The National Industrial Symbiosis project co-funded by the EU LIFE+ Environment programme helped Hungarian industries develop industrial symbiosis approaches where wastes or by-products of one industry become raw materials for another (Box 4.2). The Circular Economy Foundation, founded in 2013, gathers business partners to promote a circular economy and provides a forum to share experiences and best practices. The Ablakon Bedeott Pénz programme encourages dissemination of good practices in companies through an award for environmental performance, including on waste management and resource efficiency. This initiative is led by KöVET, an association of environment-focused consulting companies. However, there is no co-operation platform supported by public authorities to encourage companies to share best resource efficiency and circular economy practices.
Box 4.2. National Industrial Symbiosis encouraged innovation for the circular economy
Over 2009-12, the Industrial Development Coordination Agency (IFKA) collaborated with a UK-based platform to encourage industrial symbiosis in the central region of Hungary. The three-year National Industrial Symbiosis project built capacity among Hungarian businesses and set up an industry network through a series of workshops and site visits. Thanks to the project, around 1 200 tonnes of industrial waste were diverted from landfill and used in different industrial processes.
After the end of the project, IFKA joined the European Climate Knowledge and Innovation Community (Climate KIC) as a partner. Knowledge and Innovation Communities (KICs) are partnerships that bring together businesses, research centres and universities. They receive support from the Budapest-based European Institute of Innovation and Technology. As a Climate KIC partner, IFKA has been able to continue the promotion of industrial symbiosis in Hungary and take part in other EU funded-projects.
The ongoing three-year Transition Regions towards Industrial Symbiosis project (2016-19) aims at integrating industrial symbiosis practices into regional policy instruments by disseminating good industry practices. For example, the Hungarian company Clean Way has developed an application for construction and demolition firms gathering information about emerging waste in construction and demolition sites to facilitate reuse and recycling.
Source: IFKA (2018), National Industrial Symbiosis Project (2012).
Recommendations on waste, material management and circular economy
Introduce a whole-of-government approach through collaboration between relevant ministries to steer the transition to a circular economy; develop a national circular economy action plan with measurable targets and timelines; improve the prominence and visibility of resource efficiency targets and circular economy measures in the Waste Management Plan and the Irinyi Plan on Innovative Industry Development Directions; establish a platform for broader co-operation between businesses, financial institutions and other stakeholders to promote development of a circular economy.
Design and implement additional incentives for municipalities to strengthen waste management performance and allow for greater flexibility for municipalities in waste management planning; encourage best practice exchanges between municipalities by supporting associations of local authorities or environmental NGOs in developing guidelines, training and best practice recognition initiatives.
Continue improving door-to-door separate waste collection; introduce deposit-refund or pay-as-you-throw schemes for glass.
Evaluate the impact of new fixed waste tariffs for households on waste management performance and on the viability of waste management companies and infrastructure projects; consider raising waste tariffs, while compensating vulnerable households for the costs of waste management services; continue increasing the landfill tax to levels initially foreseen to encourage more separate collection and recycling efforts by municipalities.
Monitor the impact and evaluate the performance of state-operated extended producer responsibility schemes on long-term waste management performance, overall costs and promotion of eco-design of products; ensure that product fees reflect end-of-life management costs, are predictable and encourage private sector investment.
References
BIO Intelligence service et al. (2009), “Web platform to facilitate the reuse of construction materials, waste prevention best practices” (factsheet), prepared for the European Commission, Brussels, June 2009, http://ec.europa.eu/environment/waste/prevention/pdf/Nemsitt_hu_Factsheet.pdf.
BiPRO (2016), “Detailed assessment of waste management plans – first batch”, final report prepared for the European Commission, January 2016, http://ec.europa.eu/environment/waste/studies/pdf/Assessment_of_WMP_final_report.pdf.
BiPRO (2015), “Detailed evaluation report for assessing the waste management plan of Hungary – National”, prepared for the European Commission, Brussels, January 2015.
BiPRO (2014a), “Assessment of separate collection schemes in the 28 capitals of the EU, national factsheet on separate collection: Hungary”, prepared for the European Commission, Brussels, http://ec.europa.eu/environment/waste/studies/pdf/Separate%20collection_Final%20Report.pdf.
BiPRO (2014b), “Assessment of separate collection schemes in the 28 capitals of the EU, capital factsheet on separate collection: Budapest”, prepared for the European Commission, Brussels, http://ec.europa.eu/environment/waste/studies/pdf/Separate%20collection_Final%20Report.pdf.
BiPRO (2014c), “Screening information on hazardous waste management – Hungary”, prepared for the European Commission, Brussels.
BiPRO (2012), “Screening of waste management performance of EU member states”, July 2012, prepared for the European Commission, Brussels, http://ec.europa.eu/environment/waste/studies/pdf/Screening_report.pdf.
Daily News Hungary (2015), “Let’s do it Hungary, the Environment Clean-up campaign”, Daily News Hungary, 14 May 2015, http://dailynewshungary.com/lets-do-it-hungary-the-environmental-clean-up-campaign/.
Deloitte et al. (2015), “Construction and demolition waste management in Hungary”, in Resource Efficient Use of Mixed Waste, prepared for the European Commission, Brussels, September 2015, http://ec.europa.eu/environment/waste/studies/deliverables/CDW_Hungary_Factsheet_Final.pdf.
EC (2017), The EU Environmental Implementation Review, Country Report – Hungary, Commission Staff Working Document, SWD (2017) 46 final, European Commission, Brussels, 3 February 2017, http://ec.europa.eu/environment/eir/pdf/report_hu_en.pdf.
EC (2016), Municipal Waste Compliance Promotion Exercise 2014-15, http://ec.europa.eu/environment/waste/framework/pdf/municipal_waste_compliance_report_2014_2015.pdf.
EEA (2016a) “More from less — material resource efficiency in Europe 2015 overview of policies, instruments and targets in 32 countries” (country profile: Hungary), European Environment Agency, Copenhagen, www.eea.europa.eu/publications/more-from-less.
EEA (2016b), “Municipal waste management” (country factsheet: Hungary), European Environment Agency, Copenhagen.
EEA (2016c), “Industrial pollution” (country profile: Hungary), European Environment Agency, Copenhagen, www.eea.europa.eu/themes/industry/industrial-pollution/industrial-pollution-country-profiles-2016/hu.pdf.
EEA (2013), Municipal Waste Management in Hungary, European Environment Agency, Copenhagen, www.eea.europa.eu/publications/managing-municipal-solid-waste/hungary-municipal-waste-management.
GoH (2013), Országos Hulladékgazdálkodási Terv 2014-2020 (National Waste Management Plan 2014-2020, Budapest), http://videkstrategia.kormany.hu/download/c/96/90000/Orszagos%20Hulladekgazdalkodasi%20Terv%202014-2020.pdf.
HCSO (2015), Indicators of Sustainable Development for Hungary, 2014, Hungarian Central Statistical Office, Budapest, www.ksh.hu/docs/eng/xftp/idoszaki/fenntartfejl/efenntartfejl14.pdf.
HCSO (2014), Environmental Report 2013, Hungarian Central Statistical Office, Budapest, www.ksh.hu/docs/eng/xftp/idoszaki/ekornyhelyzetkep13.pdf.
IFKA (2018), IFKA Public Benefit Non-Profit Ltd. for the Development of Industry website, https://ifka.hu/en (accessed 5 February 2018).
Javór et al. (2011), The Kolontár Report: Causes and Lessons from the Red Mud Disaster, 2011, Greenpeace Hungary, Budapest.
KOVET (2017), Ablakon Bedobott Pénz Program website, www.ablakonbedobottpenz.hu/ (accessed 25 April 2017).
National Council for Sustainable Development (2013), National Framework Strategy on Sustainable Development of Hungary, www.nfft.hu/documents/127649/1361679/NFFT-ENG-web.pdf/f692c792-424d-4f5a-9f9d-9e6200303148.
National Environmental Information System (2015), OKIR EHIR Waste Management (database), http://web.okir.hu/en/ehir (accessed 16 February 2017).
National Industrial Symbiosis Programme (2012), “ISIM-TCC-industrial symbiosis: An innovative method in tackling climate change”, final report prepared for LIFE, http://ec.europa.eu/environment/life/project/Projects/index.cfm?fuseaction=home.showFile&rep=file&fil=LIFE08_ENV_H_000291_FTR.pdf (accessed 25 April 2017).
OECD (2016a), “Hungary”, in OECD Regional Outlook 2016: Productive Regions for Inclusive Societies, OECD Publishing, Paris, http://dx.doi.org/10.1787/9789264260245-27-en.
OECD (2016b), OECD Economic Surveys: Hungary 2016, OECD Publishing, Paris, http://dx.doi.org/10.1787/eco_surveys-hun-2016-en.
OECD (2010), OECD Economic Surveys: Hungary 2010, OECD Publishing, Paris, http://dx.doi.org/10.1787/eco_surveys-hun-2010-en.
Parliament of Hungary (2014), National Development 2030 – National Development and Territorial Development Concept, Resolution No. 1/2014, Budapest, http://regionalispolitika.kormany.hu/download/b/c9/e0000/OFTK_vegleges_EN.pdf.
Rayment, M. et al. (2017), “Support to the fitness check of monitoring and reporting obligations arising from EU environmental legislation,” final report 10.2779/903905, March 2017, prepared for the European Union, http://ec.europa.eu/environment/legal/reporting/pdf/Reporting%20and%20monitoring/support_fitness_check_report_annexes.pdf.
SCP (2014), Hungary-Waste Prevention Programme, European Topic Centre on Sustainable Consumption and Production website, http://scp.eionet.europa.eu/facts/WPP/hungary (accessed 15 February 2017).
USAD (2017), Užstato Sistemos Administratorius, Lithuania website, http://grazintiverta.lt/en/ (accessed 18 August 2017).
