This chapter presents an overview of Colombia’s urbanisation process. It starts by looking at the country’s urbanisation trends and highlights that Colombia’s quick urbanisation has led to a number of challenges, including the widespread development of informal settlements. The chapter also examines the economic performance of Colombian cities. It argues that cities are the motors of economic growth, with widespread informal economy affecting productivity in particular. Finally, the chapter explores life in Colombian cities through an analysis of housing, poverty and inequality, safety, mobility and environmental performance.
National Urban Policy Review of Colombia
1. Colombia’s urbanisation trends and challenges
Abstract
Introduction
Colombia has seen rapid urbanisation over the past seven decades. While cities are the main engines of economic growth of Colombia, this fast urbanisation has also led to a number of challenges in cities, including the development of informal settlements and a high number of households facing a quantitative and qualitative housing deficit, inequality, insecurity, congestion and high levels of pollution. As Colombia recovers from the effects of the COVID-19 pandemic, manages the massive international wave of immigration, tackles the rising levels of poverty and inequality, consolidates the peace process that puts an end to more than seven decades of armed conflict and deals with the global climate emergency, the functioning of its cities will become more relevant to achieve national development goals. Well aware of these challenges, the Colombian authorities have committed to a reform agenda where housing and urban policy play a key role in addressing the inefficient development patterns resulting from decades of disorderly urbanisation such as housing deficit, under-productive cities, informal settlements and environmental pollution.
Colombia has made multiple efforts to improve the quality of urbanisation and make cities a key element to support the country’s socio-economic development process. The current national urban policy, the National Policy for the Consolidation of the System of Cities (CONPES 3819, hereinafter “System of Cities”), adopted in 2014, is the latest example in a series of urban policies to make the urbanisation process conducive to meeting people’s needs and underpin economic development while ensuring environmental sustainability. However, improving the quality of urbanisation is a long-term process that requires regular adjustments to policy. In this sense, Colombia’s national government is working on a draft proposal for a new national urban policy called Ciudades 4.0 (Cities 4.0), which builds on the hard-won gains from years of experience of urban policy. This review intends to support the process of urban policy renewal through an analysis of Colombia’s urban policies and the formulation of policy recommendations based on the experience of other OECD member countries.
Colombia’s urbanisation trends
A highly urbanised and polycentric country
Colombia is a highly urbanised country, considering both national and international definitions. According to the latest population and housing census carried out in 2018, 75.5% of its population lived in urban areas. As per the international definition of the degree of urbanisation endorsed at the 2020 United Nations Statistical Commission, 64% of the Colombian population lived in cities in 2015, while 25% lived in towns and semi-dense areas and 11% in rural areas, compared with 45%, 32% and 23% respectively in upper-middle-income countries (OECD/EC, 2020[1]). While this categorisation and methodology used to define urban and rural areas differ from the definitions used by the Colombian statistics office (National Administrative Department of Statistics, Departamento Administrativo Nacional de Estadística, DANE) (see Box 1.1 on the Colombian definitions of urban and rural areas), they are used here to allow for international comparison. From these numbers, on average, Colombia is more urbanised than other countries in the same income group (upper-middle-income countries)1, except for Argentina (Figure 1.1).
Colombia’s population has urbanised quickly over the past 70 years. By the end of the 1930s, 70% of the population lived in rural areas. Between 1951 and 1964, the urban population passed from 2.7 million to 24 million people (Rueda, 1999[2]). The share of the population living in urban areas rose from 38.3% in 1950 to 75.5% in 2018 according to the latest census. Between 2005 and 2018, the number of urban inhabitants (living in municipal cores) grew by an annual average rate of 1.3% per year, from 30.9 million to 36.4 million – a slower pace than the annual average growth rate of 2.3% between 1985 and 2004. However, the number of rural inhabitants (living in populated centres and dispersed rural areas) grew more slowly than the number of urban inhabitants between 2005 and 2018, at an annual average of 0.7%, going from 10.7 million to 11.8 million. According to projections by Colombia’s National Administrative Department of Statistics (Departamento Administrativo Nacional de Estadística, DANE), the share of the population living in urban areas is expected to rise further to reach 76% by 2050 (DANE, n.d.[3]).
Figure 1.1. Population by degree of urbanisation, selection of upper-middle-income countries, 2015

Note: UMICs – Upper-middle-income countries.
Source: European Commission, (n.d.[4]) Global Human Settlement Layer, https://joint-research-centre.ec.europa.eu/global-human-settlement-layer-ghsl_en.
The rapid urbanisation of Colombia has mainly resulted from massive migration flows from rural to urban areas since the late 1930s, as people from rural areas moved to cities to find better employment opportunities and enjoy higher wages and better living conditions (Schultz, 1971[5]). This phenomenon was further enhanced by 50 years of armed conflicts and violence, which have forced millions of people to flee areas of conflict, most often located in rural areas, until the end of the conflict in 2016 (Camargo et al., 2020[6]; Ibáñez and Moya, 2006[7]). Between 1986 and 2021, there were over 9.2 million events of forced displacement,2 50% of those occurring between 1995 and 2005. In January 2022, the Victims’ Unit of the Colombian government had registered 8.2 million single victims of forced displacement.3
Box 1.1. Definition of urban and rural areas and territorial organisation in Colombia
Definition of urban and rural areas in Colombia
According to DANE, urban areas (áreas urbanas) are areas intended for urban use as defined in the land use plans in districts, municipalities or non-municipalised territories that generally have road infrastructure and primary energy, water and sewage networks, hospitals and schools, amongst other essential public services. Areas with incomplete urbanisation processes can also be included. The departments’ capital cities and municipal cores (i.e. areas delimited by the census perimeter, whose limits are established by municipal council agreement and within which the municipality’s administrative headquarter is located) are urban areas (DANE, n.d.[8]). Urban areas contrast with rural areas or other municipal areas which are characterised by a dispersed pattern of houses and agricultural uses. These areas do not include a layout or nomenclature of streets, roads or avenues, nor do they generally include public services or other facilities typical of urban areas.
For statistical purposes, the prevailing definition of “urban” and “rural” used by DANE is largely based on the concepts of municipal cores (cabeceras municipales) and populated centres and dispersed rural areas (centros poblados y rural disperso).
Territorial organisation
Colombia has a two-tier local government structure:
The upper territorial level is comprised of 32 departments (departamentos) and the Capital District of Bogotá (hereafter Bogotá, D.C.). These territorial units correspond to OECD Territorial Level 2 (TL2) regions, according to the OECD territorial grids (OECD, 2020[9]). These territorial entities enjoy administrative autonomy and are responsible for the planning and promotion of economic and social development within their territory and provision of services as determined by the constitution and Colombia’s laws. They also exercise functions of co-ordination and intermediation between municipalities, as well as between the national government and municipalities (DANE, n.d.[8]).
The lower tier of local governments is made up of 1 102 municipalities (municipios) as of 2021. Municipalities have political, fiscal and administrative autonomy as defined by the Constitution of 1991 (Article 311) and Colombia’s laws (Law 136 of 2 June 1994). They are in charge of providing public services such as electricity, urban transport, cadastre, local planning and municipal police. They are also responsible for the promotion of community participation in their management as well as for the social and cultural improvement of their inhabitants (DANE, n.d.[8]). Eleven of these municipalities are categorised as districts (distritos) which are municipalities with particular political, commercial, historical, touristic, cultural, industrial, environmental or border characteristics and importance. These 11 districts are: Barrancabermeja, Distrito Especial Portuario, Biodiverso, Industrial y Turístico; Barranquilla, Distrito Especial, Industrial y Portuario; Bogotá, Distrito Capital; Buenaventura, Distrito Especial, Industrial y Portuario; Cali, Distrito Especial Deportivo, Cultural, Turístico, Empresarial y de Servicios; Cartagena de Indias, Distrito Turístico, Histórico y Cultural; Medellín, Distrito Especial de Ciencia, Tecnología e Innovación; Riohacha, Distrito Especial Turístico y Cultura; Santa Cruz de Mompox, Distrito Especial, Turístico, Cultural e Histórico; Santa Marta, Distrito Turístico, Cultural e Histórico; and Tumaco, Distrito Especial, Industrial, Portuario, Biodiverso y Ecoturístico.
The constitution also recognises 817 Indigenous territories governed by Indigenous communities according to their own customs and by their own representatives. They are home to 1.4 million people.
Source: DANE (n.d.[8]), Conceptos básicos, National Administrative Department of Statistics, Bogotá; OECD/UCLG (2016[10]), Subnational Governments Around the World: Structure and Finance, https://www.uclg.org/sites/default/files/global_observatory_on_local_finance_0.pdf.
More recently, Colombia has also been the main destination of the Venezuelan exodus, with more than 2.6 million Venezuelan migrants and refugees having settled in Colombian cities in hope of finding jobs and better economic opportunities as of December 2020, according to DANE’s Great Integrated Household Survey (Gran Encuesta Integrada de Hogares, GEIH) (Gobierno de Colombia, n.d.[11]). While Bogotá, D.C. has the highest number of migrants, many Venezuelan families have also settled in municipalities along the frontier between Colombia and Venezuela. In the frontier municipality of Cúcuta, for example, as a result of massive inflows of Venezuelan households, the population in the municipal core rose by 3.2% between 2017 and 2018 alone, whereas the population in the overall city increased by an average annual rate of 0.9% between 2011 and 2017 (DANE). The contribution of the Venezuelan exodus to population growth in municipalities like Cúcuta could still be underestimated due to under-registration of migrants. With almost 5 million Venezuelans leaving their country since 2016, this massive exodus is one of the largest displacement crises in the world (Moreno Horta and Rossiasco, 2019[12]), which puts unprecedented pressure on Colombian cities.
Figure 1.2. Share of the population living in urban areas, by department and in the Capital District of Bogotá, 2018

Source: DANE (2018[13]), Censo Nacional de Población y Vivienda - CNPV – 2018, www.datos.gov.co/Estad-sticas-Nacionales/Censo-Nacional-de-Poblaci-n-y-Vivienda-CNPV-2018/qzc6-q9qw.
The level of urbanisation varies across Colombian departments. The most urbanised departments are located in the centre, north and west of the country. The department of Atlántico located in northern Colombia bordering the Caribbean Sea is the most urbanised, with 95% of its population living in urban areas. Departments located in the south and east of the country are the least urbanised (the department of Vaupés at the frontier with Brazil has only 29.6% of its population living in urban areas).
Colombia has a polycentric urban system, i.e. its population is concentrated in several major cities, in contrast with most Latin American countries which usually have a much higher level of urban concentration (apart from Brazil which has the lowest urban primacy index among the larger Latin American countries, i.e. the lowest ratio of largest city population to the total urban population) (OECD, 2014[14]). Almost 40% of the urban population (13.2 million people) live in the municipal cores of 5 municipalities (Bogotá, D.C., 7.4 million; Medellín, 2.4 million; Cali, 2.2 million; Barranquilla, 1.2 million; and Cartagena, 1.0 million). By contrast, less than 15% of Colombia’s urban population live in the 942 municipalities that count fewer than 20 000 inhabitants in their urban cores. In general, the larger the municipality in 2005, the greater its population growth since 2005. However, the population in the five most populated cities has increased more slowly than in the country overall. Population in Barranquilla, Bogotá, D.C., Cali, Cartagena and Medellín taken together has grown by 11.5% since 2005, while the overall urban population has increased by 15.7% in Colombia. The population increased in the majority of municipalities since 2005 (Figure 1.3). The population decreased in about 360 municipalities but these are mostly very small municipalities with fewer than 10 000 inhabitants (220 of these 360 municipalities).
Figure 1.3. Change in population in Colombian municipalities between 2005 and 2018

Source: DANE (2018[13]), Censo Nacional de Población y Vivienda - CNPV – 2018, www.datos.gov.co/Estad-sticas-Nacionales/Censo-Nacional-de-Poblaci-n-y-Vivienda-CNPV-2018/qzc6-q9qw.
Colombia’s urban population is concentrated in functional urban areas (FUAs). FUAs in Colombia have been defined by the Colombian System of Cities (Sistema de Ciudades) – a classification of cities defined by the National Planning Department (Departamento Nacional de Planeación, DNP) to take better advantage of urbanisation and its agglomeration benefits and to reduce regional equity and poverty gaps (Gobierno de Colombia, 2014[15]) (see Box 1.2 for more details on the definition of FUAs by Colombia’s System of Cities and by the OECD). The System of Cities identifies 18 FUAs, which include 113 municipalities, and 38 single-municipality functional cities. These 56 functional areas and single-municipality functional cities are mostly located in the west and centre of Colombia and account for 66% of the total national population (around 32 million people in 2018) and 80% of Colombia’s urban population (around 29 million people).
The OECD, together with the European Commission (EC), has also defined FUAs in Colombia following a methodology that allows comparison between countries. This methodology is slightly different from the one used by Colombia’s System of Cities (the main difference consists in the commute threshold considered4 – i.e. 10% for the Colombian methodology and 15% for the EU/OECD methodology, see Box 1.2 and Annex 1.A for more details) and identifies 53 FUAs in Colombia made up of 106 municipalities, distributed mainly in the north, west and centre of the country. Forty-five of these 53 FUAs do not have a commuting zone (i.e. 84% of total FUAs) – a high share of FUAs compared with other OECD countries (27% on average). Consequently, the share of the Colombian FUA population living in commuting zones is only 2.6%, much less than the OECD average of 23.9% (Figure 1.4), which could suggest potential barriers to agglomeration economies such as inadequate transport infrastructure (see sections below for more details on agglomeration economies and transport infrastructure). The functional urban system in Colombia is also characterised by the high share of small FUAs with fewer than 200 000 inhabitants (60%), compared with other OECD countries where small urban areas account for 42% of FUAs (Figure 1.5).
Box 1.2. Definitions of Colombian FUAs according to Colombia’s System of Cities and the EU/OECD
Definition of Colombian FUAs by Colombia’s System of Cities
Based on recent trends in Colombia’s urbanisation (regarding population growth, the location of the main economic activities and the provision of housing and other services in municipalities), the Mission of the System of Cities (Misión del Sistema de Ciudades), created by the DNP and made up of a team of national and international experts, developed a methodology that defines a new scale of analysis that goes beyond the municipal administrative borders and identifies FUAs. It considers sets of cities that share functional, economic, social, cultural and environmental relationships, that interact with each other, in order to make the most of the benefits of urbanisation, according to several criteria (see Annex 1.A for more details on the methodology) (Gobierno de Colombia, 2014[15]).
Following this methodology, Colombia’s System of Cities identifies 18 functional cities (i.e. groups of municipalities between which there are functional relationships in terms of economic activities and supply and demand of services, usually concentrated around a main city) of which 14 revolve around capital cities and which include 113 municipalities, and 38 single-municipality functional cities (i.e. urban centres whose functional area remains within the administrative limits of the municipality). Colombia’s System of Cities also identifies ten urban-regional axes and corridors (Bogotá, D.C., EjeCaribe, Medellín-Rionegro, Cali-Buenaventura, Bucaramanga-Barrancabermeja, Cúcuta, Montería-Sincelejo, Eje Cafetero, Tunja-Duitama-Sogamoso and Apartadó-Turbo) (Gobierno de Colombia, 2014[15]). The remaining 951 Colombian municipalities are considered mostly rural.
Colombian law (1625/2013) also establishes the principles and functions of metropolitan areas, which are administrative entities formed by two or more municipalities, which have high economic, social and physical relationships and are integrated around a core municipality (Sanchez-Serra, 2016[16]). The six metropolitan areas (Barranquilla, Bucaramanga, Centro Occidente, Cúcuta, Valle de Aburrá and Valledupar) have legal status as well as administrative and fiscal autonomy, and do not necessarily match the FUAs defined by the Misión del Sistema de Ciudades.1
Definition of Colombian FUAs by the EU/OECD
The OECD and the EC have jointly developed a methodology to define FUAs in a consistent way across countries (Dijkstra, Poelman and Veneri, 2019[17]). Using population density and travel-to-work flows as key information, this methodology is slightly different from the one used by Colombia’s System of Cities, the main difference being the commuting threshold taken into account to identify the FUAs (see Annex 1.A for more details on the methodology). The OECD identifies 53 FUAs in Colombia made up of 106 municipalities, distributed mainly in the west and centre of the country (see Annex 1.A for the comparison between the FUAs as identified by the OECD and the ones identified by Colombia’s System of Cities). It does not distinguish between multi- and single-municipality functional cities.
Among these FUAs, the OECD defines metropolitan areas as FUAs with 500 000 or more inhabitants, therefore differing from Colombia’s legally instituted metropolitan areas as seen above. In Colombia, there are 20 metropolitan areas according to the OECD definition, including 4 large metropolitan areas with more than 1.5 million inhabitants (Barranquilla, Bogotá, D.C., Cali and Medellín).
1. There are also a number of metropolitan areas that have been recognised but not yet institutionalised. This is the case for example of the metropolitan areas of Bogotá, D.C., Cali, Popayán, the binational metropolitan areas of Arauca-El Amparo (Colombia-Venezuela) and Ipiales (Colombia-Ecuador), and the trinational metropolitan area of Leticia-Tabatinga (Colombia-Brazil-Perú).
Source: Gobierno de Colombia (2014[15]), Política Nacional para Consolidar el Sistema de Ciudades en Colombia, CONPES 3819, https://s3.pagegear.co/38/69/2017/conpes_3819_sistema_de_ciudades.pdf; Sanchez-Serra, D. (2016[16]) (2016), “Functional Urban Areas in Colombia”, https://dx.doi.org/10.1787/5jln4pn1zqq5-en; Dijkstra, L., H. Poelman and P. Veneri (2019[17]), “The EU-OECD definition of a functional urban area”, https://dx.doi.org/10.1787/d58cb34d-en.
Figure 1.4. Share of the population in the commuting zone over total population in the FUA

Source: OECD (2020[18]), Country Compilation of FUAs, https://www.oecd.org/cfe/regionaldevelopment/Appendix_all_fuas.pdf.
Figure 1.5. Percentage of FUAs by population size, Colombia and OECD

Source: OECD (2020[18]), Country Compilation of FUAs, https://www.oecd.org/cfe/regionaldevelopment/Appendix_all_fuas.pdf.
A young but ageing urban population
Colombia’s population is relatively young compared with other OECD countries. The old-age dependency ratio, i.e. the ratio of the number of people 65 years old or more over the number of people 15 to 64 years old, was 0.122 in Colombia in 2018 – one of the lowest among OECD countries (Figure 1.7). The population in Colombia’s metropolitan areas as defined by the OECD (i.e. FUAs with 500 000 or more inhabitants) is also young compared with other OECD metropolitan areas (Figure 1.7). However, the total fertility rate is expected to decline from 1.95 in 2018 to 1.57 in 2050 – below the replacement level of 2.1 children born per woman. In parallel, life expectancy is expected to continue to increase from 76.5 years in 2018 to 79.2 in 2050. The combination of these trends will increase the old-age dependency ratio. The population in Colombian urban areas has been ageing more rapidly than in rural areas. Between 2005 and 2018, the base of the age pyramid in urban areas narrowed while the top widened, due to lower fertility rates (1.73 in 2018, compared with 2.7 in rural areas) and higher life expectancy (77.2 in 2018, compared with 74.6 in rural areas) (Figure 1.6).
Figure 1.6. Age pyramids in urban and rural areas, Colombia, 2005 and 2018

Source: DANE (2018[13]), Censo Nacional de Población y Vivienda - CNPV – 2018, www.datos.gov.co/Estad-sticas-Nacionales/Censo-Nacional-de-Poblaci-n-y-Vivienda-CNPV-2018/qzc6-q9qw.
Figure 1.7. Old-age dependency ratio in OECD countries and metropolitan areas, 2005 and 2018

Source: OECD.stat (n.d.[19]), Historical Population (database), https://stats.oecd.org/Index.aspx?DataSetCode=HISTPOP; OECD.stat (n.d.[20]), Metropolitan Areas (database), https://stats.oecd.org/Index.aspx?DataSetCode=CITIES.
Densification and urban expansion
There are two main manifestations of urban growth – through densification and through urban expansion. Densification means that the urban population increases through the rise in the density within the original boundary of the city and does not require any additional urban land. Urban expansion leads to the building of new neighbourhoods outside the core area of the city.
Colombia has urbanised through both densification and urban expansion, and its cities have a high population density. The urban core areas (cabeceras municipales) of Bogotá, D.C., Medellín and Bucaramanga, with respectively 17 755, 19 691 and 10 316 inhabitants per km2 in 2018,5 rank among the world’s most densely populated cities. Even when looking at the whole metropolitan areas, and with 883 inhabitants per km2 on average, Colombian metropolitan areas as defined by the OECD (i.e. FUAs with more than 500 000 inhabitants) are amongst the most densely populated among OECD countries and are more so than the OECD on average (644 inhabitants per km2) (Figure 1.8). The metropolitan areas of Medellín, Bogotá, D.C., Cali and Barranquilla in particular, with 4 022, 3 465, 1 700 and 1 663 inhabitants per km2 respectively, are among the 40 most densely populated metropolitan areas among the 668 metropolitan areas of the OECD for which data is available (OECD.stat, n.d.[20]).
Density has increased in Colombian urban core areas since 2005. The ratio of the overall population over the total area of urban areas rose by 25.8% since 2005, from around 8 944 inhabitants per km2 in 2005 according to population projections to around 11 259 inhabitants per km2 today. Density has decreased only in around 140 municipalities since 2005 but the large majority of them (122) have fewer than 10 000 inhabitants. The densest departments in Colombia are located in the centre and north of the country, while the departments in the south and east are the least dense (Figure 1.9).
While density has increased in Colombian urban core areas, urban population growth in Colombia has also led to some physical expansion of cities. Colombian cities have grown physically more than demographically, indicating a phenomenon of urban sprawl. Between 1990 and 2015, the urban footprint in Colombian cities grew by 2.50% while the population by 2.28%. In the largest cities, the difference between the increase in urban footprint (2.13%) and population (1.87%) is more marked in the same period (Castillo Varella, 2017[21]). This has significant environmental, economic and social consequences, including higher emissions from road transport (as sprawling cities are characterised by larger distances between homes and jobs, more likely to be travelled by car) and higher costs of providing key public services (such as water, electricity and public transport, which are more expensive to provide in sprawling rather than compact areas).
Figure 1.8. Density in metropolitan areas, selected OECD countries

Note: Unweighted average of density in OECD metropolitan areas (FUAs with more than 500 000 inhabitants).
Source: OECD.stat (n.d.[20]), Metropolitan Areas (database), OECD, Paris, https://stats.oecd.org/Index.aspx?DataSetCode=CITIES.
Figure 1.9. Density in municipal core areas and Colombian departments, 2018
Informal settlements
The fast urbanisation process in Colombia has been characterised by the development of informal settlements, mainly outside of municipal core areas but not only (many informal settlements are also located in urban centres), which are primarily inhabited by vulnerable groups of population. Cities were often unequipped to provide enough quality housing to the flow of low-income households displaced from rural to urban areas by conflict and violence, while informal settlements often became the only option for many migrants. According to Colombian legislation, an informal settlement is an illegal human settlement, made up of one or more houses, either consolidated or precarious,6 and located on public and/or private land without having the approval of the owner and without any type of legality or urban planning (Law 2044/2020). Precarious informal settlements are characterised by being partially or totally affected by: i) incomplete and insufficient integration to the formal urban structure and its support networks; ii) the possible existence of mitigable risk factors; iii) an urban environment with a lack of roads, public space or other urban infrastructure; iv) poor quality housing and with inadequate construction structures (structural vulnerability); v) housing with a lack of adequate infrastructure of public services and basic social services; vi) conditions of poverty, social exclusion or inhabited by people who are victims of forced displacement.
Across Colombia, there are 1 517 reported informal settlements and more than 60% of them are concentrated in 6 cities: Medellín accounts for 17.0% of total informal settlements in Colombia, followed by Villavicencio (11.8%), Neiva (8.9%), Bucaramanga (8.8%), Bogotá, D.C. (8.7%) and Cali (7.4%). While the share of households living in informal settlements has been decreasing since 2010 (Table 1.1), informal settlements represent around a quarter of the built areas of Colombian cities and are home to almost five million people (IDMC, 2020[23]).
Table 1.1. Urban households living in informal settlements
|
Year |
Number of households living in informal settlements |
Total number of households |
Percentage of households living in informal settlements |
|---|---|---|---|
|
2003 |
876 174 |
7 539 924 |
11.62 |
|
2004 |
689 297 |
7 753 388 |
8.89 |
|
2005 |
702 635 |
7 980 816 |
8.80 |
|
2007 |
1 302 034 |
8 729 053 |
14.92 |
|
2008 |
1 271 759 |
8 943 714 |
14.22 |
|
2009 |
1 436 371 |
9 224 485 |
15.57 |
|
2010 |
1 487 230 |
9 481 835 |
15.69 |
|
2011 |
1 422 185 |
9 694 643 |
14.67 |
|
2012 |
1 387 950 |
9 996 144 |
13.88 |
|
2013 |
1 354 708 |
10 283 314 |
13.17 |
|
2014 |
1 376 685 |
10 631 027 |
12.95 |
|
2015 |
1 317 633 |
10 522 475 |
12.20 |
|
2016 |
1 227 193 |
10 990 379 |
11.17 |
Source: DANE (n.d.[24]), Gran Encuesta Integrada de Hogares - GEIH, 2003-21, https://dane.maps.arcgis.com/home/index.html; Ministry of Housing, City and Territory (MVCT) and Ministry of Interior–UARIV 2018.
Informal settlements are often characterised by higher population densities. In Bogotá, D.C., for example, the highest densities are found in the urban periphery where informal settlements are located (Guzman and Bocarejo, 2017[25]). Informal settlements offer poor urban living conditions and pose many challenges, including a lack of access to basic services and a lack of secure land tenure, which can also exclude communities from political and public participation. Households who live in informal settlements are also more likely to have limited access to employment opportunities, education and social and health services.
Economic performance of Colombian cities
Colombian cities are the main engines of economic growth and hubs of employment
Urban areas are the economic engine of Colombia, accounting for about half of the national gross domestic product (GDP) growth over the past 40 years and for 85% of the country’s total GDP today. Economic activity is highly concentrated in a few municipalities. Half of Colombia’s real GDP is produced in 23 municipalities and almost 40% in only 5 cities. Bogotá, D.C. accounts for 22.9% of Colombia’s total GDP, while Medellín comes next with 5.6%, then Cali with 4.1%, Barranquilla with 2.6% and Cartagena with 2.1% of Colombia’s total GDP in 2018. Annual GDP growth in these 5 municipalities made up 63% of the total annual GDP growth in Colombia in 2016. However, this contribution to annual economic growth fell to 28.4% in 2017 and 28.5% in 2018 (Figure 1.10). In line with the concentration of Colombia’s GDP in just a small number of municipalities, half of Colombian companies are located in only 5 cities: in Bogotá, D.C. (29.4% of all companies in 2018), Medellín (8.7%), Cali (5.9%), Barranquilla (3.2%) and Bucaramanga (2.8%).
Figure 1.10. Contribution of municipalities to Colombia’s real GDP growth, 2012-18

Source: Authors’ calculations based on DANE data provided to the OECD.
While the contribution of the capital Bogotá, D.C. to Colombia’s total GDP is high, Colombia’s economy remains less concentrated than many other OECD economies. The metropolitan area of Bogotá, D.C. (according to the OECD definition) accounts for a lower share of national GDP (30.6%) than other OECD metropolitan areas such as the metropolitan area of Santiago in Chile (38.6% of Chile’s GDP) or the metropolitan area of Dublin (half of Ireland’s GDP) (Figure 1.11).
The labour force participation rate, i.e. the ratio between the economically active population and the working-age population, in Colombian urban areas was 62.6% in July-September 2021, up by 2.7 percentage points compared to 2020 (59.9%). This is 1.7 percentage points more than the national participation rate (60.9%) and 7.5 percentage points more than in dispersed rural and populated centres (55.1%). The employment rate was higher in urban areas (53.8%) than the national average (53.0%) and in dispersed rural and populated centres (50.5%). The unemployment rate is also higher in urban areas (14.1%) than the national average (12.9%) and dispersed rural and populated centres (8.2%) (Figure 1.12). In July-September 2021, the unemployment rate was higher than the national average in 19 out of the 23 capital cities and metropolitan areas, with the highest unemployment rate observed in Florencia at 19.6% (Figure 1.13).
There is a significant gap between men and women in the labour market. While the participation rate in the 13 capital cities and metropolitan areas was 73.9% for men in September 2021, it was only 55.4% for women. The unemployment rate was 11.1% for men in the 13 capital cities and metropolitan areas, compared with 15.3% for women (DANE, 2021[26]).
Figure 1.11. Contribution of OECD countries’ main metropolitan area to national GDP, 2018

Note: GDP (constant prices, constant purchasing power parity [PPP], base year 2015) of the metropolitan area (FUA with more than 500 000 inhabitants) with the highest GDP in the country over total national GDP (constant prices, constant PPP, base year 2015).
Source: Authors’ calculations based on OECD.stat (n.d.[20]), Metropolitan Areas (database), https://stats.oecd.org/Index.aspx?DataSetCode=CITIES.
There is a significant gap between men and women in the labour market. While the participation rate in the 13 capital cities and metropolitan areas was 73.9% for men in September 2021, it was only 55.4% for women. The unemployment rate was 11.1% for men in the 13 capital cities and metropolitan areas, compared with 15.3% for women (DANE, 2021[26]).
Figure 1.12. Participation rate, employment rate and unemployment rate, July-September 2021

Note: Data is for July-September 2021, moving quarter.
Source: DANE (2021[26]), Principales indicatores del mercado laboral September 2021, National Administrative Department of Statistics, Bogotá.
The large majority of formal and informal employed people (16.8 million out of 21.5 million people employed in December 2021, i.e. 78.2%) live in urban areas (cabeceras municipales) (Gobierno de Colombia, n.d.[11]). Employment is concentrated in a few municipalities where most of the Colombian population lives. Almost half of the employed population (11.4 million) are located in the 13 departments’ capital cities and metropolitan areas (ciudades y áreas metropolitanas).7 In urban areas, sectors that contribute the most to employment are: trade and repair of vehicles (22.4% of employment in 13 capital cities and metropolitan areas and 22.5% in cabeceras); public administration defence (13.8% in 13 capital cities and metropolitan areas and 13.6% in cabeceras); and manufacturing (12.5% in 13 cities and metropolitan areas and 11.7% in cabeceras). By contrast, in dispersed rural and populated centres, agriculture, livestock, forestry, fishing and hunting accounted for more than 60% of occupied jobs in July 2021.
Figure 1.13. Unemployment rate in 23 departments’ capital cities and metropolitan areas, July-September 2021

Note: MA – Metropolitan area, área metropolitana (A.M.).
Urban areas in Colombia were the hardest hit by the economic crisis linked to the COVID-19 pandemic. The number of employed people hit its lowest level in April 2020, falling to 16.5 million people, compared with 21.9 million people a year earlier. Urban areas accounted for 86% of the 5.4 million jobs lost in Colombia between April 2019 and April 2020 (of which 4 million were lost between March and April 2020) and employment fell by 4.6% in urban areas, while it fell by only 0.8% outside urban areas. On the other hand, urban areas have also been the main driver of job creation since April 2020. In April 2021, there were 3.4 million more people employed in urban areas than in April 2020, while the increase in Colombia overall was 3.9 million (i.e. 87% of jobs created in urban areas) (Figure 1.14). Trade and repair of vehicles, manufacturing and construction were the three sectors that contributed the most to the increase in employment in urban areas between February-April 2020 and February-April 2021.
Across OECD countries, the ability to telework has allowed firms and workers to better weather the current COVID-19 crisis and offers a source of resilience against potential future shocks. However, people and places are unequal regarding teleworking capacity. Across the OECD, the possibility of generating economic activity remotely tends to be stronger in cities than in less densely populated areas (OECD, 2020[28]). In Colombia, the share of jobs that are amenable to remote working is low compared with other OECD countries. Even Santander, which is the department in Colombia with the highest share of jobs amenable to teleworking (30%), fares worse than the average of most OECD countries (except the Slovak Republic and Turkey) (Figure 1.15). As the possibility of remote working correlates strongly with the skill requirement of the occupation (i.e. the share of jobs amenable to remote working increases with the share of workers with tertiary education (OECD, 2020[28])), low rates of potential remote working in regions in Colombia may reflect the low level of skills of the local workforce. These low rates could also reflect the industrial composition of the local economies in Colombia and the prevalence of economic sectors where teleworking is less of an option. Furthermore, individuals’ capacity to telework may be hindered by the lack of information technology (IT) equipment or access to a broadband Internet connection, family reasons such as having to take care of children or elderly relatives, or by the lack of space to work from home (OECD, 2020[28]).
Figure 1.14. Contribution of capital cities, metropolitan areas and other urban areas to annual employment changes, April 2019-April 2020 and April 2020-April 2021

Note: The 13 capital cities and metropolitan areas are: Barranquilla A.M., Bogotá, D.C., Bucaramanga A.M., Cali A.M., Cartagena, Cúcuta A.M., Ibagué, Manizales A.M., Medellín A.M., Montería, Pereira A.M., Pasto and Villavicencio. The ten capital cities are: Armenia, Florencia, Neiva, Popayán, Quibdó, Riohacha, Santa Marta, Sincelejo, Tunja and Valledupar. Other urban areas are other cabeceras municipales. Rural areas are centros poblados y rural disperse.
Source: Authors’ calculations based on DANE data provided to the OECD.
Figure 1.15. Share of jobs amenable to teleworking, TL2 regions, selected OECD countries, 2018

Source: OECD (2020[29]), Job Creation and Local Economic Development 2020: Rebuilding Better, https://dx.doi.org/10.1787/b02b2f39-en.
The informal economy is widespread in Colombian cities
Colombia’s labour market has a high level of informality. Even though labour informality decreased in recent years, especially since the 2012 tax reform that cut social security contributions and reduced non-wage labour costs, nearly 60% of all workers still work in the informal sector – a high share compared to other countries in Latin America (Figure 1.16) (OECD, 2019[30]). Between October and December 2021, in 23 of the main cities and their metropolitan areas, the level of informality reached 48% (Gobierno de Colombia, n.d.[11]). The high level of labour informality in Colombia has many causes. The minimum wage, at 86% of the median wage, is one of the highest in OECD countries and has discouraged employers from hiring formal workers, resulting in many low-skilled or young workers ending up with informal employment or being self-employed without any protection (OECD, 2019[30]). Despite the 2012 tax reform, non-wage labour costs remain high and represent almost 50% of the wages, also deterring employers from hiring formal workers. Furthermore, costly and complex business regulations hamper the formalisation of firms and jobs.
Low levels of skills among the Colombian population also explain the high level of informal employment. Colombia’s population is among the least skilled in OECD countries, as only 23.8% of the population aged between 25 and 64 years old have attained tertiary education (OECD, 2020[31]). In May-July 2020, in 23 capital cities and their metropolitan areas, 58% of informal workers had a secondary level of education and 19% had attained tertiary education, whereas 58% of formal workers had a tertiary degree (DANE, n.d.[24]). According to OECD estimates, completing secondary education decreases the probability of working in the informal sector by 15%, while completing tertiary education cuts the probability by 80% (OECD, 2019[30]). Finally, migration from Venezuela in recent years has also put more pressure on the Colombian labour market, with Venezuelan workers finding employment mostly in the informal sector. While Venezuelan migrants participate more in the economy than Colombian people (74% of them are economically active vs. 63% of Colombian people), 67% of employed Venezuelan migrants have a job in the informal sector (compared with around 60% of all workers as discussed above) (IMF, 2020[32]).
Figure 1.16. Share of workers in informal sector, 2018

Source: OECD (2019[30]), OECD Economic Surveys: Colombia 2019, https://dx.doi.org/10.1787/e4c64889-en.
Colombian cities concentrate most of the workers in the informal sector.8 The share of workers in the informal sector in the 13 capital cities and metropolitan areas was 48.1% in July-September 2021, while it was 49.3% in the 23 capital cities and metropolitan areas, a slight increase from 47.6% and 48.6% respectively in July-September 2020 (DANE, 2021[26]). The share of informal labour varies across urban areas. In the metropolitan area of Cúcuta, there are as many as 71.0% of workers employed in the informal sector, while the share is much lower in Bogotá, D.C., where 41.2% of workers are employed in the informal sector (DANE, 2021[33]) (Figure 1.17).
Informality has many detrimental effects, including on: productivity (see section below); social outcomes, as it reduces job quality and access to social services, labour protection and pensions; and on income inequalities – the hourly wage penalty, i.e. by how much less informal workers earn compared to formal ones, is as high as 49% according to OECD calculations (OECD, 2019[30]). Informality also contributes to reducing Colombia’s tax base and therefore the ability of governments to provide the adequate quantity and quality of public services.
Figure 1.17. Share of workers in informal sector in the 23 capital cities and their metropolitan areas, May-July 2020 and February-April 2021

Note: MA – Metropolitan area, área metropolitana (A.M.).
Source: DANE (n.d.[34]), GEIH - Empleo informal y seguridad social, https://www.dane.gov.co/index.php/calendario/icalrepeat.detail/2020/07/13/4617/-/geih-empleo-informal-y-seguridad-social.
Productivity in Colombian cities is low and agglomeration economies limited
While cities have been the engines of Colombia’s economic growth, labour productivity (i.e. GDP per worker) in Colombian metropolitan areas on average is the lowest among all metropolitan areas in OECD countries. With around USD 43 800 per worker in 2018, Bucaramanga is the most productive metropolitan area in Colombia but one of the least productive of all metropolitan areas in the OECD for which data is available (Figure 1.18).
Several reasons may explain the low labour productivity in Colombian metropolitan areas, including: the low level of skills compared with other OECD countries; the lack of competition in key sectors, such as transport or telecommunications; the high regulatory burden; and the relatively low integration in international trade (OECD, 2019[30]). The low levels of productivity are also explained by the high share of small and very small firms with very low productivity levels. Small- and medium-sized enterprises (SMEs) account for about 67% of employment and 28% of GDP in Colombia (in 2017), much below the average numbers observed in OECD countries (OECD, 2021[35]). In 2018, the share of companies with between 1 and 4 employees was 80% in Barranquilla, 81% in Cali, 83% in Bogotá, D.C. and 78% in Medellín (Figure 1.19). Many of these small firms are family-run businesses, while the share of self-employed workers accounts for half of employment – a much higher share than the OECD average of 15.7% (OECD, 2021[35]). Furthermore, as informality is mostly prevalent in small firms and given that firms relying on informal contracting are less likely to innovate and grow, this high share of small informal firms reduces productivity. The difference in productivity between formal and informal firms is estimated to be as high as 40% in Colombia (OECD, 2019[30]). While Colombia entered the COVID-19 crisis with one of the lowest shares of SMEs connected to high-speed broadband among OECD countries (8.7%), there has been a very fast SME digital uptake during the crisis (60% of Colombian SMEs have reported increasing their use of digital technologies since the start of the COVID-19 crisis). However, the lack of basic skills for many Colombians, including those needed to take part in the digital transition and the widespread mismatch between the supply and demand of skills will continue to hamper productivity improvements (OECD, 2021[35]).
Figure 1.18. Productivity in OECD metropolitan areas, 2018

Note: Data are for 2018, except for Canada (2016), Chile (2017), France (2016) and Japan (2016).
Source: OECD.stat (n.d.[20]), Metropolitan Areas (database), https://stats.oecd.org/Index.aspx?DataSetCode=CITIES.
As discussed previously, the past decades of urbanisation have led to an increased concentration of jobs and people in cities. However, low productivity levels in Colombian metropolitan areas suggest that cities in Colombia do not fully capture the benefits of agglomeration, i.e. when individuals and firms benefit from operating in close proximity (OECD, 2015[36]). Agglomeration economies arise because of the production benefits of physical proximity to other firms, workers and consumers, through three main channels: i) sharing effects through the gains from a greater variety of inputs and industrial specialisation, the common use of local indivisible goods and facilities, and the pooling of risk; ii) matching effects between firms and workers; and iii) learning effects through the generation, diffusion and accumulation of knowledge (Duranton and Puga, 2004[37]). In particular, agglomeration economies imply greater productivity for individual firms due to the greater amount of activity of nearby firms and the greater number of workers and consumers. Estimates of the impact of a city’s size on productivity suggest that a doubling in the size of an FUA increases worker productivity by 2-5% (Ahrend et al., 2014[38]).
Figure 1.19. Share of firms by number of employees in Colombia in a selection of the largest municipalities

Source: DANE (n.d.[39]), Directorio Estadístico de Empresas, https://www.dane.gov.co/index.php/servicios-al-ciudadano/servicios-informacion/directorio-estadistico/directorio-estadistico-de-empresas.
For cities to be productive and make the most of agglomeration economies and physical proximity of firms, workers and consumers, an efficient and affordable transport network to connect people to jobs and consumers to goods and services is needed, as agglomeration economies can be intensified by improving transport connectivity (Venables, 2007[40]). Cities’ productivity can also be improved and greater agglomeration benefits achieved by better co‑ordinating land use and investment planning at a metropolitan scale (Samad, Lozano-Gracia and Patman, 2012[41]). Furthermore, administrative fragmentation within an FUA has been shown to have a detrimental impact on productivity within the FUA (Ahrend et al., 2014[38]; OECD, 2015[42]). In Colombian cities, infrastructure bottlenecks, transport congestion and high transport costs, as well as the lack of co‑ordination of spatial planning instruments, have contributed to constraining the ability of Colombian cities to capture agglomeration benefits (for more details on transport, see the section below; for more details on land use and spatial planning instruments, see Chapter 3).
Living in Colombian cities
The quantitative and qualitative housing deficit in cities drive low housing affordability
Despite the Colombian government’s significant investments in the housing sector in the past years (see Chapter 4), having access to affordable and quality housing remains a major challenge for many Colombian households. House prices have increased sharply in the past 15 years. Between the fourth quarter of 2005 and the fourth quarter of 2020, real house prices more than doubled in Colombia (+107.3%) – the highest growth rate of all OECD countries and a much higher growth rate than in the OECD, where real house prices increased by 19.2% on average over the same period (see drivers for the housing price increase below) (Figure 1.20). The house price increase has slowed down in the past couple of years and house prices rose by only 0.9% between the fourth quarter of 2019 and the fourth quarter of 2020. However, Colombia’s GDP is projected to grow by 9.5% in 2021 and by 5.5% in 2022 (OECD, 2021[43]) and this fast economic recovery might drive house prices further up in the coming years.
Figure 1.20. Evolution of real house prices, OECD countries, Q4 2005-Q2 2021

Note: Data for Chile are available until Q4 2020, for the Czech Republic from Q1 2008, for Hungary from Q1 2007, for Latvia from Q1 2006, for Lithuania from Q1 2006, for Luxembourg from Q1 2007, for Korea until Q1 2021, for New Zealand until Q1 2021, for Slovenia from Q1 2007 and for Turkey from Q1 2010.
Source: OECD (n.d.[44]), Analytical House Prices Indicators (database), https://stats.oecd.org/Index.aspx?DataSetCode=HOUSE_PRICES.
House prices in Colombia have soared faster than household disposable income, making housing increasingly unaffordable for many Colombian households, especially for first-time buyers or those who have to move from low-priced areas to higher-priced ones for work reasons for example. Since 2006, the price-to-income ratio in Colombia has experienced one of the fastest increases among all OECD countries, as real house prices have steadily outpaced real wage growth (Figure 1.21). The price-to-income ratio is higher in urban areas than in rural areas in all departments except Cundinamarca and increased sharply in all departments between 2011 and 2019 (Figure 1.22). In Colombia, the average household net-adjusted disposable income per capita is USD 33 604, which is lower than the OECD average of USD 408 376 (OECD, n.d.[45]).
Figure 1.21. Price-to-income ratio, Q4 2006-Q4 2020

Note: Data for Colombia shows the evolution of the price-to-income ratio between Q4 2006 and Q4 2019. Data for the Czech Republic shows the evolution between Q1 2008 and Q4 2019. Data for Hungary, Luxembourg and Slovenia shows the evolution between Q1 2007 and Q4 2019.
Source: OECD (n.d.[44]), Analytical House Prices Indicators (database), https://stats.oecd.org/Index.aspx?DataSetCode=HOUSE_PRICES.
While homeownership remains the most common tenure for Colombian households (46.2% of them), the private rental sector plays a central role in Colombia, with 35.7% of Colombian households renting their accommodation on the private market – a higher share than in the OECD on average (23.1%) and the highest share in Latin America (21.9% in Chile and 15.0% in Mexico) (OECD, 2020[46]; Lombard, Hernandez-Garcia and Lopez Angulo, 2021[47]). The share of tenants tends to be higher in cities, with a high proportion of them renting from the informal rental market. According to the latest information available, about 60% of renters have either a verbal (63%) or a written contract (37%) (Torres Ramírez, 2012[48]). In Bogotá, D.C., it reaches 43.5% according to the 2018 National Quality of Life Survey conducted by DANE. However, the share of tenants on the private market in Colombia could be underestimated. According to the 2018 survey, as many as 14.7% of households declare that their accommodation is provided for free (DANE, 2019[49]) – with some of these households likely to be renting their accommodation on the informal rental market.
Since 2005, real rent prices have risen by 73.2% in Colombia – with a slower rise than for house purchase prices over the same period but one of the strongest growth rates among OECD countries (Figure 1.23) – making the private rental market increasingly unaffordable for many Colombian urban households. Rental price levels should, however, be taken with caution, as a significant share of the rental market is informal, making the collection of data complicated.
Figure 1.22. Price-to-income ratio, urban areas, by department, evolution 2011-19

Source: DANE (2019[49]), “Boletín Técnico: Encuesta Nacional de Calidad de Vida (ECV) 2018”, https://www.dane.gov.co/files/investigaciones/condiciones_vida/calidad_vida/Boletin_Tecnico_ECV_2018.pdf.
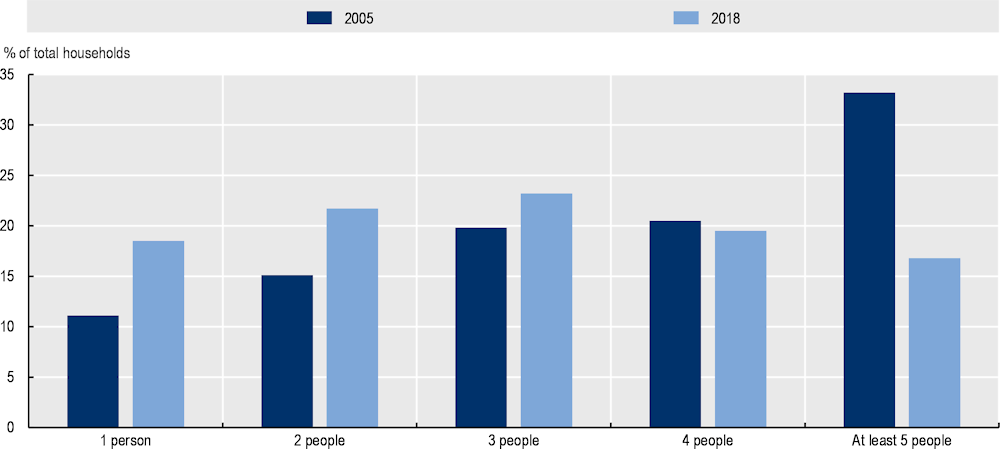
This increase in house prices has been driven by rising demand for housing not being met by sufficient growth in housing supply. As has been the case in many countries, strong demand for housing in Colombian cities has been fuelled by many factors, including sustained economic growth and rising real wages until 2020, as well as the increase in the number of households and the changes in household composition. With population growth and the number of people per household decreasing (Figure 1.24), the number of households in Colombia grew from 10.6 million in 2005 to 14.2 million in 2018 (+37.7%). Meanwhile, the increase in the number of housing units was slower (from 10.4 to 13.5 million, i.e. a growth rate of 29.7%). In cities, these factors have been further boosted by faster population growth, reflecting migration from rural areas and from abroad, as discussed previously. The rapid and recent migration from Venezuela has also increased housing demand and put more pressure on Colombian cities’ housing markets.
Figure 1.23. Rent prices, change between Q4 2005 and Q3 2021

Source: OECD (n.d.[44]), Analytical House Prices Indicators (database), https://stats.oecd.org/Index.aspx?DataSetCode=HOUSE_PRICES.
Figure 1.24. Households by number of people in Colombia
Source: (DANE, 2018[13]) Censo Nacional de Población y Vivienda – CNPV 2018; www.datos.gov.co/Estad-sticas-Nacionales/Censo-Nacional-de-Poblaci-n-y-Vivienda-CNPV-2018/qzc6-q9qw
The Colombian housing market is divided into two segments: i) social interest housing (vivienda de interés social, VIS), including priority interest housing (vivienda de interés social prioritario, VIP);9 and ii) non‑VIS, which includes any housing that does not fall into these categories. Given the increase in the price-to-income ratio, non-VIS housing has become increasingly unaffordable for many Colombian households. As a result, most of the housing demand in Colombian cities has been for VIS housing. However, housing supply in most major Colombian cities is mostly made of non-VIS housing, indicating a mismatch between housing demand and supply (Figure 1.25) (World Bank, 2019[50]).
Figure 1.25. Supply and demand for VIS and non-VIS housing, main Colombian cities, 2005-17

Source: World Bank (2019[50]), Vivienda digna para todos, http://documents.worldbank.org/curated/en/535261564743579904/Vivienda-Digna-para-Todos.
Furthermore, the increase in housing demand has not been met by an increase in housing supply. Between 2016 and 2020, the number of housing starts in Colombian main urban areas decreased, from around 165 000 in 2016 to 116 500 in 2020, due to the significant drop in housing starts in the non-VIS housing segment – by almost 50% between 2016 and 2020 (Figure 1.26).
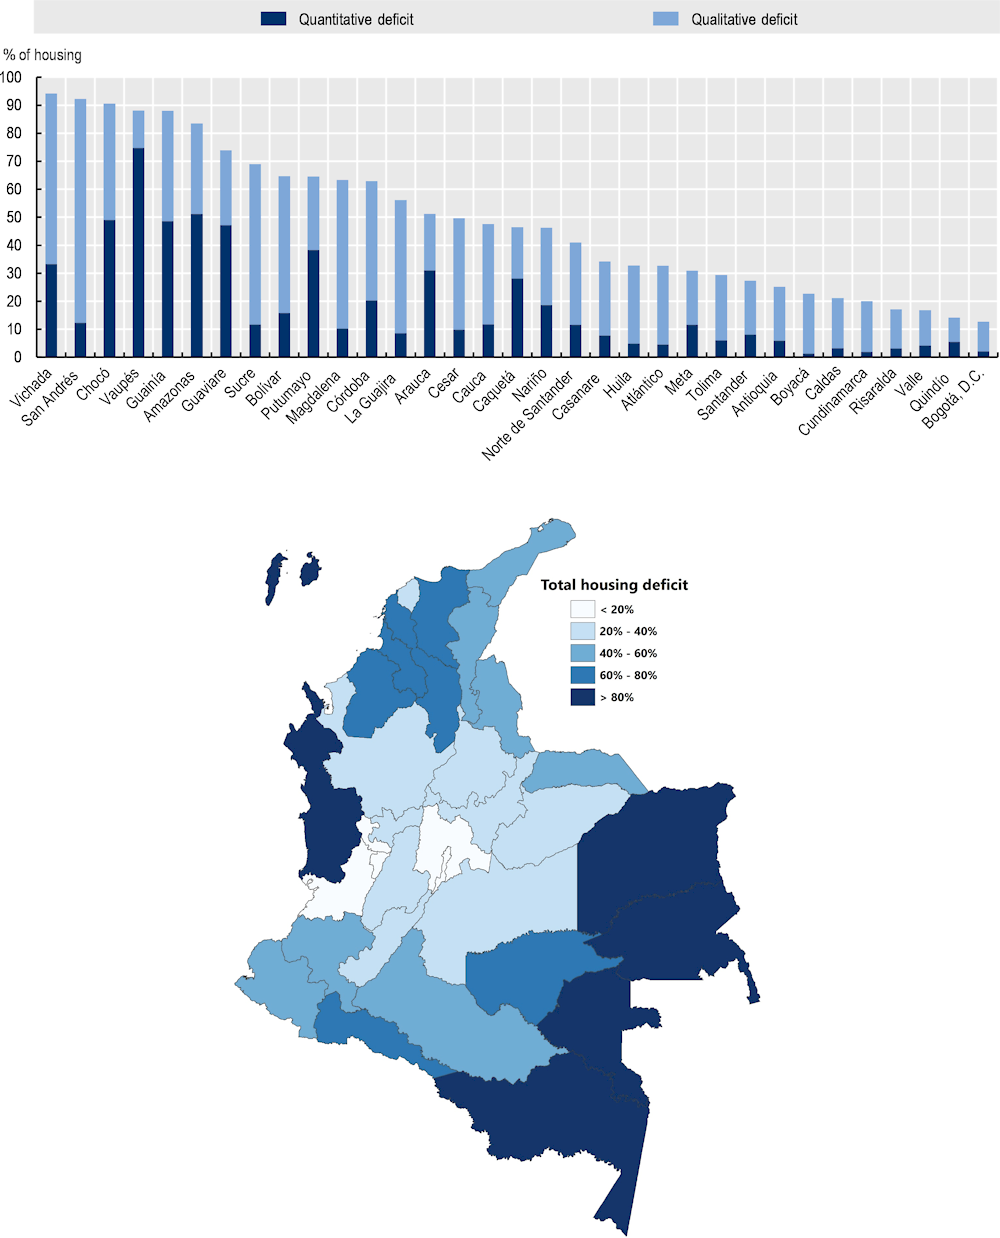
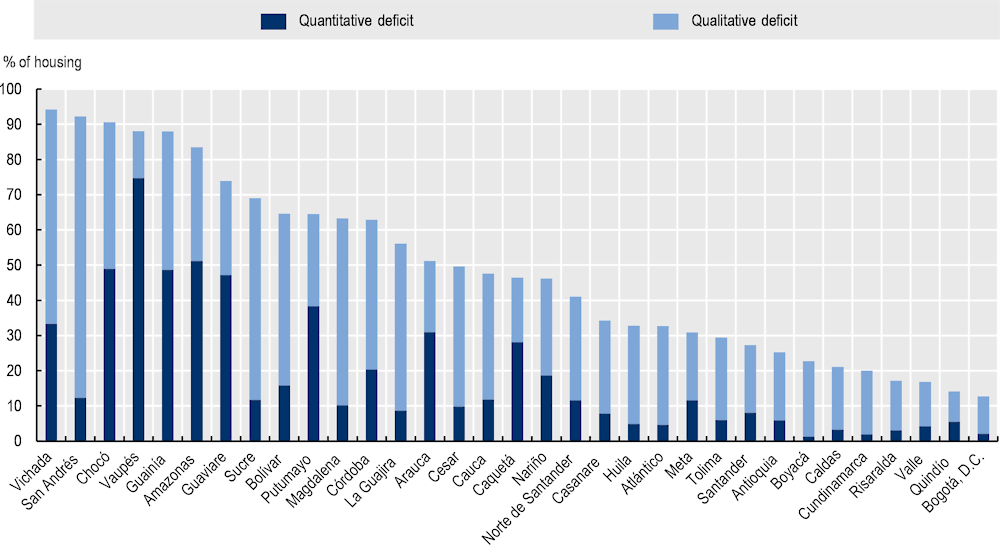
This drop in housing construction combined with the continuous increase in housing demand has led to a substantial housing deficit in Colombia. About 9.8% of Colombian households (i.e. 1.4 million households) live in housing with structural and space deficiencies for which it is necessary to add new housing to the stock. Alongside quantity considerations, it is also critical to assess the quality of housing, as housing should offer not only a place to sleep and rest but also safety, privacy and personal space that responds to people’s needs. Furthermore, housing quality is an important indicator of housing affordability, as vulnerable households who are more likely to live in poor housing conditions cannot afford to maintain or improve their dwelling or move to better-quality housing. The housing deficit in Colombia is not only quantitative, it is also and foremost qualitative (Box 1.3). At the national level, the overall (quantitative and qualitative) housing deficit is estimated at 36.6% (i.e. 36.6% of Colombian households experience deficient housing quantity or quality). Beyond the 9.8% of Colombian households that face a quantitative housing deficit, 26.8% (i.e. 3.8 million households) live in homes with a qualitative deficit that can be improved through renovation – meaning that 3 out of 4 households in a situation of housing deficit need a better home, not a new one (MVCT, 2020[51]).
Figure 1.26. Housing starts per housing type in 20 reference urban areas, 2016-20
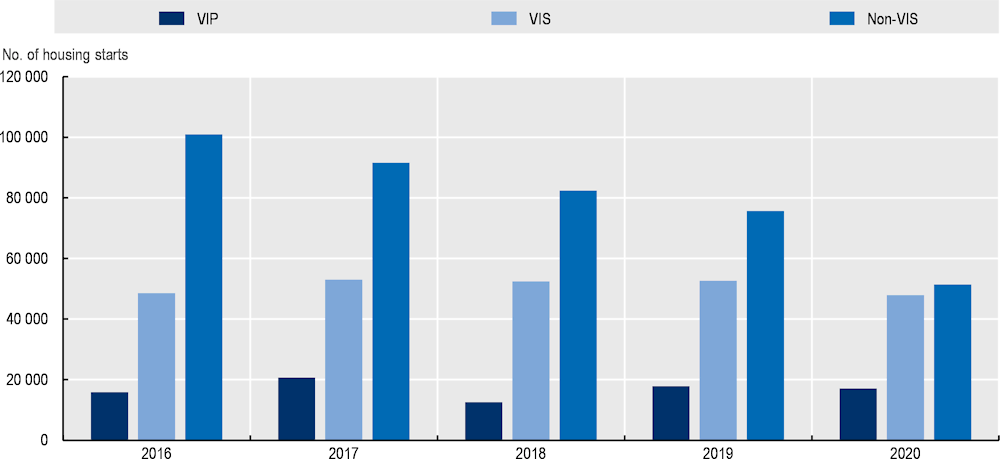
Note: The 20 reference urban areas are the FUAs of Armenia, Barranquilla, Bogotá, D.C., Bucaramanga, Cali, Cartagena, Cúcuta, Cundinamarca, Ibagué, Manizales, Medellín, Montería, Neiva, Pasto, Pereira, Popayán, Santa Marta, Tunja, Valledupar and Villavicencio .
Source: DANE (2021[52]), National Quality Life Survey, National Administrative Department of Statistics, Bogotá.
Box 1.3. Definition of quantitative and qualitative housing deficits
The quantitative housing deficit refers to the share of households who live in dwellings that are affected by heavy structural deficiencies and/or are providing too little domestic space. To reduce this deficit, new housing units must be built in order to increase the housing stock. According to the 2020 DANE methodology, the quantitative housing deficit in Colombia includes households living in:
Dwellings that are in the category “other” in the national population and housing census, which refers to buildings that are not suitable as housing units.
Accommodations made of precarious exterior building materials.
Housing units shared by three or more households: in urban areas (cabeceras municipales) and populated centres and dispersed rural areas (centros poblados y rural disperso), the quantitative deficit also includes situations of housing units shared by only two households, when there is more than six people cohabitating within the same dwelling. For those cases of cohabitation, the main households as well as single-person households are not included in the quantitative deficit estimation. Additional households only are considered in the estimation.
In urban areas only, households in which more than four people are sharing the same bedroom (situation considered as “irremediable overcrowding”).
The qualitative deficit refers to the share of households living in dwellings that require improvements or adjustments to meet adequate habitability conditions. This includes households living in:
Housing units:
with floor materials made of bare ground or sand
with a kitchen in the same room used for sleeping, or in a room without a sink, or with a kitchen outside of the building
without access to plumbing (indoor plumbing in urban areas)
without access to a sanitation system (in urban areas, dwellings without access to any system, or whose toilets are connected to a sceptic tank or not connected to any evacuation system)
without access to electricity
without access to a domestic waste service in urban areas.
Dwellings with rectifiable overcrowding (in urban areas, when there are three or four people per bedroom).
Note: Because of their specificity, ethnic and indigenous housing are not included in the housing deficit estimations and are treated separately.
Source: DANE (2020[53]), Nota metodológica: Déficit Habitacional CNPV 2018, National Administrative Department of Statistics, Bogotá.
The overall housing deficit is more prevalent in rural areas than in urban areas. In the department of Vichada, for example, which is mostly rural, there is a 94.2% housing deficit, while it is only 12.7% in Bogotá, D.C. (MVCT, 2020[51]). Departments that are located the furthest from the centre of the country are also those with the highest housing deficit, such as the departments of Amazonas, Bolívar, Chocó, Guainía, Guaviare, La Guajira, Magdalena, San Andrés, Sucre or Vaupés, which are also departments with a relatively high share of ethnic communities compared with the rest of the country (Figure 1.27). However, while facing a housing deficit is more common in rural areas, about half of households facing a housing deficit live in urban areas.
Capital cities are also showing a huge diversity of situations in terms of both quantitative and qualitative deficits. The three largest capital cities (Bogotá, D.C., Medellín and Cali) have a rather limited housing deficit (16%, 15% and 14% respectively) compared with other capital cities, especially when it comes to quantitative deficit (Figure 1.28).
All types of Colombian households (size, composition and employment situation) are affected by the housing deficit. While almost a third (29.1%) of single-person households face a housing deficit, 57.3% of households with 5 people and 67.6% of households with more than 6 people suffer from a quantitative or a qualitative housing deficit. In terms of employment situation, people looking for work are more affected (45.9% of them) by the housing deficit than people who earn an income from an activity (35.5%). International migrants seem to be particularly affected by the housing deficit, with 58.3% of people who used to live in another country 5 years before the 2018 census suffering from quantitative or qualitative housing deficit. This is much more than internal migrants (37.8% of the people who used to live in another Colombian municipality).
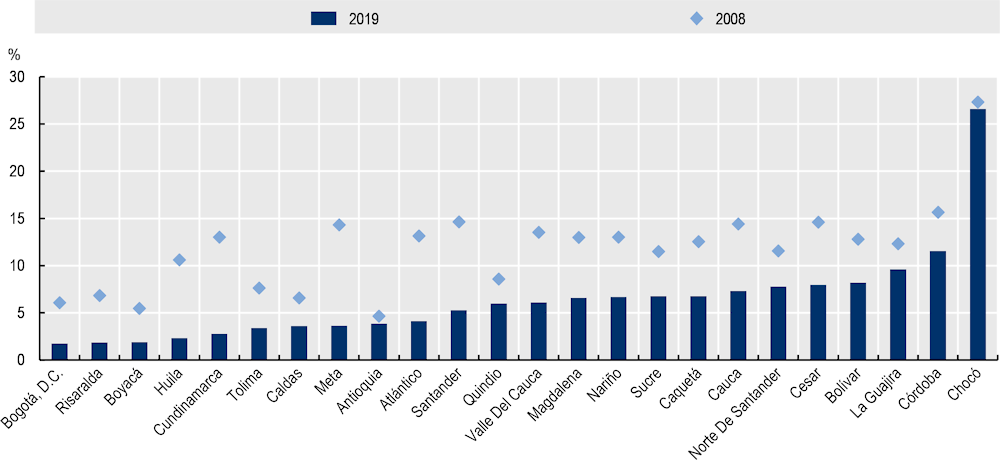
While more than a quarter of Colombian households face a qualitative housing deficit, housing conditions have improved in recent years. The share of households living in unliveable conditions10 decreased in all departments since 2008 (Figure 1.29). People living in urban areas generally enjoy better housing conditions that people living in rural areas. For example, the number of rooms per household member is higher for urban households than for rural households in all departments, except in the department of Atlántico. On average across all Colombian departments, there is 0.70 room per household member living in urban areas, while dwellings in rural areas have 0.63 room per household member. However, the number of rooms per household member is lower than in all OECD countries for which data is available.
In line with the changes in household composition, the average area of properties decreased from 104.2 m2 in 2008 to 84.3 m2 in 2018. The average number of bedrooms has also fallen, from 2.7 in 2008 to 2.3 in 2018 (in the VIS segment, it decreased from 2.5 to 2.1 over the same period). The increase in the share of households with one or two people is also correlated with the increase in the construction of small apartments, especially in cities, while in other parts of the country, this has led to subdivisions of houses or shared apartments (MVCT, 2020[51]).
Figure 1.27. Quantitative and qualitative housing deficit by Colombian department, 2018
Figure 1.28. Housing deficit in capital cities, 2018
Source: DANE 2018 Population and Housing Census.
In addition to people living in unliveable conditions, homelessness is a challenge in Colombia. According to the DANE census of people experiencing homelessness, between 2017 and 2021, there were about 34 091 homeless people in Colombia, who live either on the street, in temporary dormitories or in an institution (DANE, 2021[54]). Homeless people are mostly men and are concentrated in the largest cities, with more than 40% of them living in Bogotá, D.C. (Figure 1.30).
Figure 1.29. Share of households living in unliveable housing conditions, by department, 2008 and 2019
Source: MVCT (2020[51]) Análisis del Capacidades y Entornos del Ministerio de Vivienda, Ciudad y Territorio.
Figure 1.30. Homeless people in Colombian cities
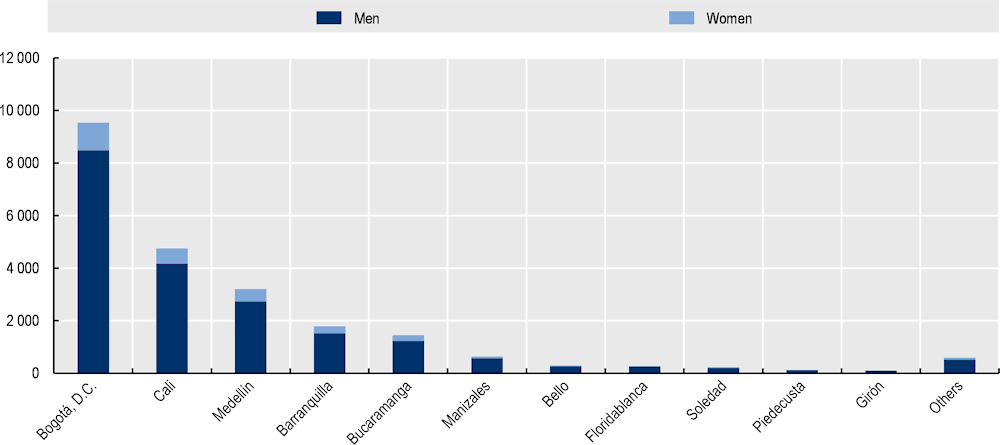
Note: Others are cities with fewer than 100 homeless people, i.e. Barbosa, Caldas, Copacabana, Envigado, Galapa, Girardota, Itagüí, La Estrella, Malambo, Puerto Colombia, Sabaneta.
Source: DANE (2021[54]), Censo de Habitantes de la Calle (Census of Homeless People), https://www.dane.gov.co/files/investigaciones/boletines/censo-habitantes-calle/presentacion-CHC-rueda-de-prensa-2021.pdf (2017 for Bogotá, D.C. and 2019 for the other municipalities).
Within housing quality, it is also critical to assess the adequacy of people’s living conditions, in particular whether dwellings have access to basic facilities. Almost all households living in urban areas have access to electricity and water (99.9% and 97.5% respectively) – much more so than in rural areas, where 92.9% and only 63.1% of households have access to electricity and water (Figure 1.31). Despite quick progress in recent years, access to the Internet is still quite low in Colombia, even in urban areas where only 61.6% of households have access. Among OECD countries, Colombia has the lowest level of fixed broadband Internet penetration, after Chile, Mexico, and Turkey, despite a sharp increase in the use of fibre optic connections in recent years (Figure 1.32).
Figure 1.31. Access to electricity, water and Internet, by degree of urbanisation, 2020
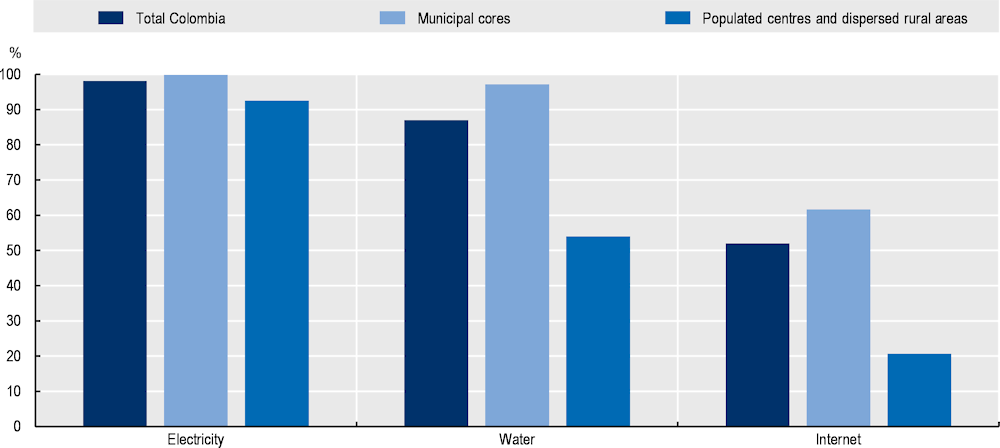
Source: DANE (2021[52]), National Quality of Life Survey, National Administrative Department of Statistics, Bogotá
Figure 1.32. Fixed broadband subscriptions per 100 inhabitants, by technology, OECD countries, June 2020
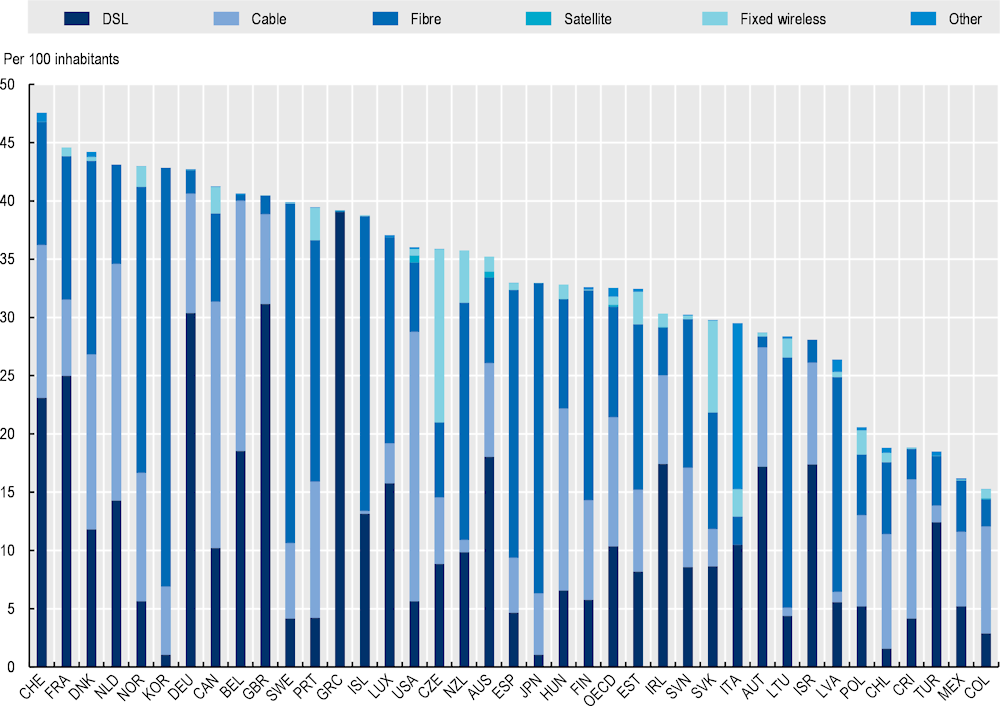
Note: Australia: Data reported for December 2018 and onwards are being collected by a new entity using a different methodology. Figures reported from December 2018 comprise a series break and are not comparable with previous data for any broadband measures Australia reports to the OECD; Canada: Fixed wireless includes satellite; France: Cable data include VDSL2 and fixed 4G solutions; Italy: Terrestrial fixed wireless data include WiMax lines; Other includes vDSL services. Data for Canada, Switzerland and the United States are preliminary.
Source: OECD (n.d.[55]), Broadband Portal, www.oecd.org/sti/broadband/oecdbroadbandportal.htm.
While social indicators have improved in urban areas, urban inequality remains an issue
Colombia has experienced significant improvements in terms of social indicators in the past two decades. GDP per capita has steadily increased between 2012 and 2019. However, regional inequalities are high and among the highest among OECD countries (OECD, 2019[30]). GDP per capita is much higher in urban areas than in rural areas (COP 818 988 per capita [EUR 179]) vs. COP 312 724 per capita [EUR 68] in 2019). The highest values of GDP per capita are found in the 13 departments’ capital cities and metropolitan areas (Figure 1.33).
Poverty measures have also considerably improved in Colombia over the past couple of decades, especially in urban areas, although poverty increased again in 2020 in the wake of the COVID-19 crisis. Poverty can be measured both directly and indirectly. Direct measurement of poverty evaluates individuals’ satisfaction (or non-deprivation) regarding key dimensions such as childhood and youth conditions, health, education, employment and housing conditions, while indirect measurement assesses the ability of households to purchase goods and services:
Direct measurement of poverty is measured by the UNDP - Multidimensional Poverty Index (5 dimensions,11 15 indicators). While at the national level in 2020, 18.1% of the population were considered as “poor” according to this measurement, this rate is lower in urban areas, with 12.5% of the urban population being poor. In rural areas, the incidence of multidimensional poverty is much higher, at 37.1% in 2019 (DANE, 2021[56]). At the municipal level, the highest levels of multidimensional poverty are found in municipalities located in the Orinoquía-Amazonía (east and south of Colombia) and Pacific regions, while the lowest levels were found in the municipalities located in the central and eastern regions of the country.
Indirect measurement of poverty is measured by the incidence of monetary poverty, which evaluates the percentage of the population that has an income per capita of the household below the poverty line according to the geographic location of the household. Between 2012 and 2019, monetary poverty decreased at the national level from 40.8% to 35.7% of Colombia’s population. The prevalence of monetary poverty was 32.3% in urban areas and 47.5% in populated centres and dispersed rural areas – i.e. monetary poverty is 1.5 times less prevalent in urban areas than in dispersed rural areas (Figure 1.34). However, this downward trend has been put to a halt by the COVID-19 crisis, as monetary poverty in Colombia increased to 42.5% in 2020 – 6.8 percentage points more than in 2019. Monetary poverty increased the most in municipal cores, from 32.3% in 2019 to 42.4% in 2020, catching up with the 42.9% observed in populated centres and dispersed rural areas in 2020. It increased in all capital cities and metropolitan areas in 2020, with the metropolitan areas of Barranquilla and Bucaramanga recording the greatest rises (from 25.6% in 2019 to 41.2% in 2020 and from 31.4% in 2019 to 46.1% in 2020 respectively).
Figure 1.33. Income per capita, national level and per level of urbanisation, 2012-19
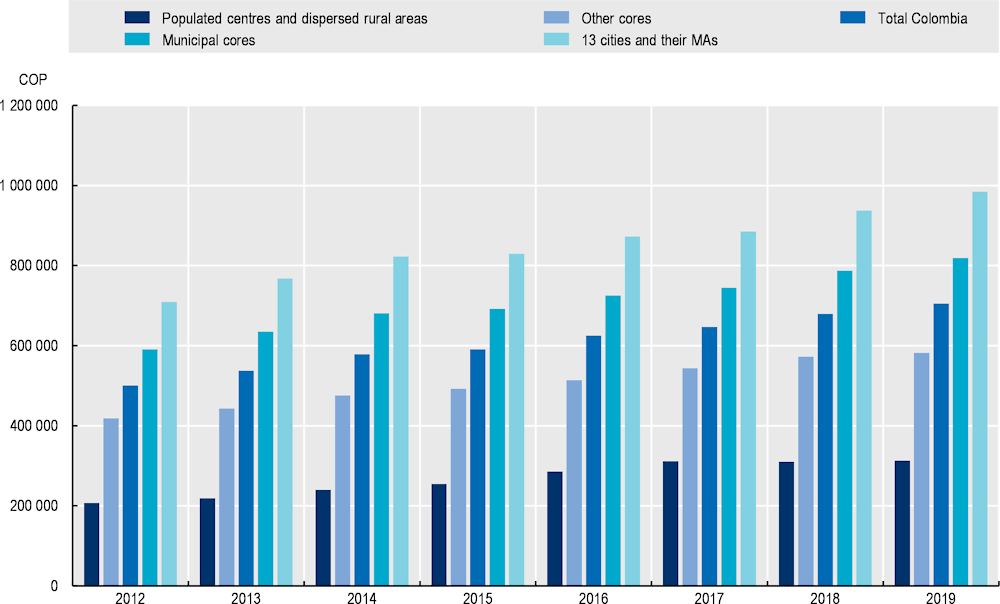
Note: The 13 cities and their MAs (metropolitan areas, área metropolitana or A.M.) are Barranquilla A.M, Bogotá, D.C., Bucaramanga A.M, Cali A.M, Cartagena, Cúcuta A.M., Ibagué, Manizales A.M., Medellín A.M., Montería, Pasto, Pereira A.M. and Villavicencia. Cabeceras refer to all cores (cabeceras) without the 13 cities and their MAs.
Source: DANE (n.d.[24]), Gran Encuesta de Hogares - GEIH, National Administrative Department of Statistics, Bogotá.
Figure 1.34. Monetary poverty incidence by degree of urbanisation, 2019
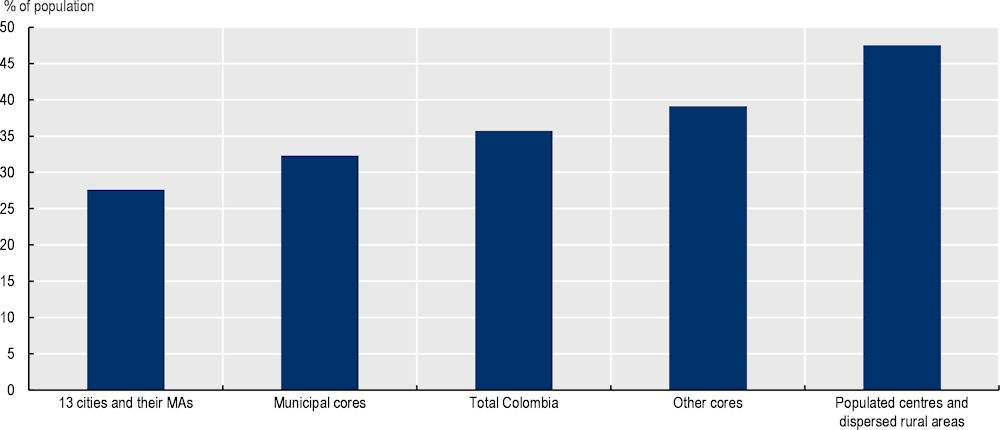
Note: The 13 cities and their MAs (metropolitan areas, área metropolitana or A.M.) are Barranquilla A.M, Bogotá, D.C., Bucaramanga A.M, Cali A.M, Cartagena, Cúcuta A.M., Ibagué, manizales A.M., Medellín A.M., Montería, Pasto, Pereira A.M. and Villavicencia. Cabeceras refer to all cores (cabeceras) without the 13 13 cities and their MAs.
Source: DANE (n.d.[24]), Gran Encuesta de Hogares - GEIH, National Administrative Department of Statistics, Bogotá.
These higher levels of poverty (measured either directly or indirectly) can be explained by the higher incidence of poverty among ethnic minorities and people displaced by the conflict, which are disproportionally concentrated in rural areas (OECD, 2019[30]).
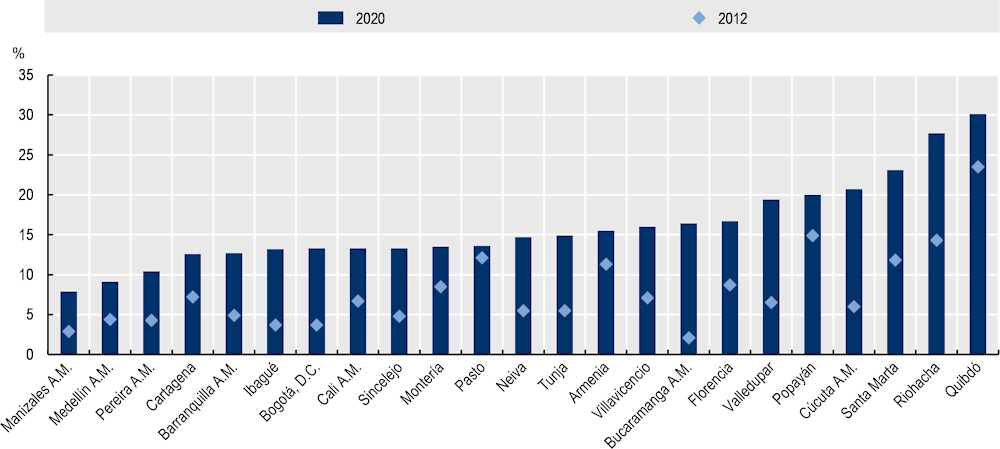
The share of the population living below the poverty threshold (incidencias de pobreza monetaria extrema) decreased in most capital cities and metropolitan areas between 2012 and 2019, but increased sharply in 2020, bringing the incidence of extreme poverty in municipal cores in 2020 to higher levels than in 2012 (14.2% in 2020 compared with 7.9% in 2012), annihilating all improvements achieved since then. However, the incidence of extreme poverty is lower in municipal cores than in populated centres and dispersed rural areas where 18.2% of people live in extreme poverty. The share of people living below the poverty threshold increased the most in Bucaramanga, Cúcuta and Riohacha (Figure 1.35). This rise in poverty in Cúcuta and Riohacha, located close to the Venezuelan border, could be explained by the inability of local labour markets to integrate the influx of migrants in the short term and to the short-term downward pressures on wages exerted by immigration (World Bank, 2018[57]).
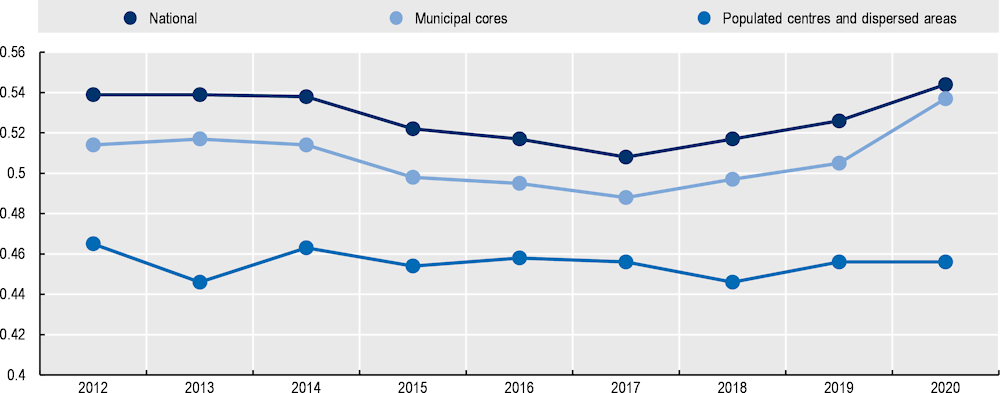
While levels of poverty are lower in urban than in rural areas, inequalities are wider in municipal cores than in less populated centres and dispersed rural areas. In 2020, the Gini index (which measures the extent to which the distribution of income among individuals or households within an economy deviates from a perfectly equal distribution)12 was 0.54 in municipal cores (following an increase in the index which started in 2018) and 0.46 in populated centres and dispersed rural areas (Figure 1.36), while the OECD average was 0.36% in 2016. The Gini index increased in all 23 capital cities and metropolitan areas except in Quibdó in 2020, with inequalities widening the most in the metropolitan area of Bucaramanga.
Figure 1.35. Incidence of extreme poverty in 23 capital cities and metropolitan areas, 2012 and 2020
Source: DANE (n.d.[24]), Gran Encuesta de Hogares - GEIH, National Administrative Department of Statistics, Bogotá.
Figure 1.36. Gini index in Colombia, municipal cores and populated centres and dispersed rural areas, 2012-20
Colombian cities remain unsafe despite recent improvements
The lack of safety and security has long been a significant challenge for Colombian cities, stemming in particular from a history of armed conflict triggering violence, civil conflict and illegal activities, high inequalities and the prevalence of marginalised areas and informal settlements characterised by the lack of access to basic services and high poverty levels. Security has improved substantially in Colombia and especially in cities in the past decade, thanks to proactive policies to curb crime and violence, both at the national and local levels (see Chapter 3).
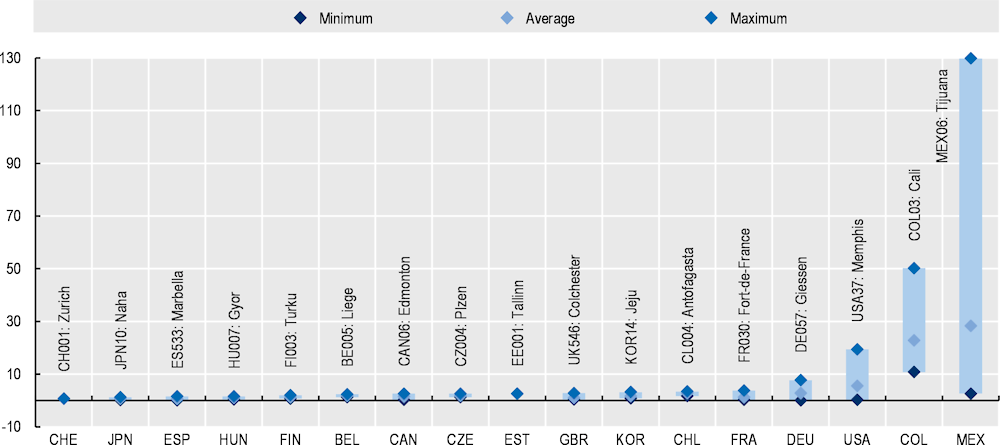
Despite such progress, insecurity is still higher than in rural areas. In 2020, 7.8% of people aged 15 years old or more reported being victims of a crime in urban areas, while this share was 6.6% in rural areas (Figure 1.37). In 2021, 9.2% of people were the victims of a crime in urban areas and 6.6% in rural areas. However, these numbers are not comparable with previous years, as a new methodology was adopted in 2021 to include victims of cybercrime. Furthermore, Colombian metropolitan areas are amongst the least safe among OECD metropolitan areas when taking into account the number of homicides per 100 000 inhabitants. Only some metropolitan areas in Mexico have more homicides per 100 000 inhabitants than Colombian metropolitan areas (Figure 1.38).
Figure 1.37. Victims of crimes, by city and level of urbanisation, 2018, 2019 and 2020
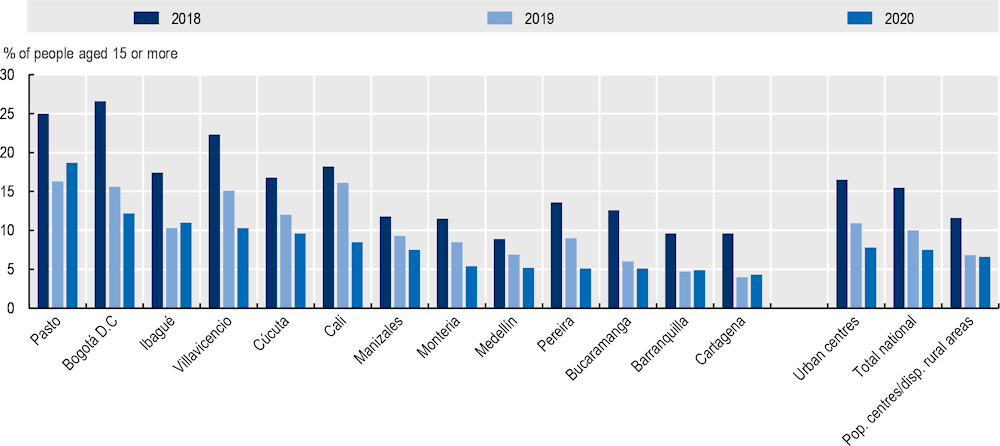
Note: Crimes include thefts from residences, thefts of livestock, thefts from persons, thefts of vehicles, fights and extortion. In the cases of theft from residences and theft of livestock, each resident of the home that suffered the crime is counted as a victim.
Pop. centres/disp. rural areas: Populated centres and dispersed rural areas.
Source: DANE (2020[59]), Encuesta de Convivencia y Seguridad Ciudadana, https://www.dane.gov.co/index.php/estadisticas-por-tema/seguridad-y-defensa/encuesta-de-convivencia-y-seguridad-ciudadana-ecsc.
Figure 1.38. Reported homicides per 100 000 inhabitants, OECD metropolitan areas, 2018 or latest year available
Source: OECD.stat (n.d.[20]), Metropolitan Areas (database), https://stats.oecd.org/Index.aspx?DataSetCode=CITIE.
Congestion, fatalities and pollution are the main mobility challenges in Colombian cities
Mobility has been a major challenge for Colombian cities – driven by the disconnect between urban planning and transport infrastructure, the expansion of the urban area of main cities and insufficient financial capacities at the local level to maintain roads and transport. Public transport is the preferred transport mode in Colombia’s main cities. However, motorcycles come next in most of the main Colombian cities (Table 1.2). In Cali, for example, almost a quarter of transit is done by motorcycle.
Table 1.2. Modal choice in main Colombian cities, %
|
City |
Public transport |
Car |
Motorcycle |
Bicycle |
Walking |
Other |
|---|---|---|---|---|---|---|
|
Bogotá, D.C. |
36 |
15 |
6 |
7 |
24 |
13 |
|
Medellín |
34 |
13 |
12 |
1 |
27 |
13 |
|
Cali |
38 |
15 |
23 |
5 |
5 |
14 |
|
Bucaramanga |
42 |
10 |
24 |
3 |
10 |
11 |
|
Barranquilla |
63 |
8 |
9 |
2 |
1 |
17 |
|
Cartagena |
50 |
6 |
16 |
1 |
3 |
24 |
|
Manizales |
57 |
12 |
11 |
1 |
11 |
8 |
|
Pereira |
24 |
12 |
17 |
1 |
35 |
11 |
|
Montería |
21 |
9 |
22 |
9 |
20 |
19 |
Note: Data for Bogotá, D.C., is for 2019, for Barranquilla, Bucaramanga, Cali, Cartagena, Manizales, Medellín and Montería 2018, and for Pereira 2017.
Source: Information provided by the MVCT.
Furthermore, despite efforts to increase the use of public transport, the number of motorised vehicles is still growing in Colombia. Between 2010 and 2017, the number of motorcycles more than doubled and the number of cars increased by 58%. In urban areas, this fast increase has partly been due to the lack of adequate and accessible public transport systems, fostering the use of private motorcycles in particular, which are considered by urban residents to be cheaper and faster (ITF/OECD, 2019[60]). The number of vehicles registered has also risen quickly in more recent years. In 2018, there were 14.4 million vehicles registered and, by April 2021, the number amounted to 16.3 million (Table 1.3).13 This rise in registered vehicles has raised significant challenges in terms of traffic management, infrastructure maintenance, road safety and environmental performance (ITF/OECD, 2019[60]).
Table 1.3. Registered vehicle fleet in Colombia, April 2021
|
Type of vehicles |
Number |
Percentage of total |
|---|---|---|
|
Motorcycles |
9 629 602 |
59 |
|
Cars, vans, lorries, buses, busetas, and others |
6 529 389 |
40 |
|
Vehicles for construction, trailers, etc. |
173 392 |
1 |
|
Total |
16 332 383 |
100 |
Source: RUNT (n.d.[61]), Homepage, www.runt.com.co (accessed on 15 November 2021).
The increase in motorcycle and car use has resulted in congestion in Colombian cities. Low frequency in public transport, lack of sufficient urban transportation options, overcrowding, high fees, relatively low quality of service and rising incomes have all led transport users to opt for alternatives to public transport, such as motorcycles, private cars or informal transport means, contributing to even more congestion. Illegal parking – partly due to a lack of monitoring and control by the authorities – as well as inadequate road design, poor road maintenance, incorrect road signs and inappropriate behaviour of drivers and pedestrians are all factors that have contributed to high congestion in Colombian cities (Bocajero, 2020[62]). Freight transport is also fostering more congestion in cities, as it can represent as much as 50% of urban traffic (DNP, 2020[63]). The inadequacy of freight transport vehicles, in particular, damages road infrastructures and deteriorates environmental quality in cities, leading some local authorities to restrict their access to certain urban zones, with, in turn, a negative impact on the local economies. Bogotá, D.C., is one of the most congested cities in the world. According to data and analytics provider INRIX, Bogotá, D.C. ranks the highest, with commuters spending on average 133 hours in traffic in 2020 (less than the 191 hours spent in 2019, due to reduced traffic because of the COVID-19 crisis and the associated lockdowns in 2020). Cali and Medellín rank 10th and 22nd, with 81 and 62 hours spent in traffic respectively (INRIX, 2021[64]). Other technology companies that provide satellite tracking of vehicles or develop navigation applications show a similar picture. For example, TomTom ranks Bogotá, D.C. third among the most congested cities worldwide, analysing the difference between the speed of circulation at low-demand times and average circulation speeds throughout the day (Bocajero, 2020[62]).
Investments in public transport have helped some Colombian cities decrease congestion but challenges remain. In Bogotá, D.C. for example, the TransMilenio Bus Rapid Transit (BRT) system, created in 1999 to provide a public transport solution in the capital, transports around 2.4 million passengers every day, accounting for 18.4% of total trips in the city (Secretaría Distrital de Movilidad, 2019[65]). According to the World Bank, the TransMilenio system has reduced by almost a third the average commuting time, while also making commutes safer, with a decrease of 90% in the number of accidents in the TransMilenio corridor (Suzuki, Cervero and Iuchi, 2013[66]). However, the shortfall of appropriate infrastructure compared with what was planned originally, the deterioration of some routes, worsening traffic congestion, a decline in service quality, overcrowding and long waiting times have cast a shadow on TransMilenio’s achievements and pushed users to turn to alternative transport modes, increasing congestion further. Similarly, in the cities where they exist (cities with more than 600 000 inhabitants), the demand for the Integrated Mass Transport Systems (Sistemas Integrados de Transporte Masivo, SITM) (e.g. buses, metro, metrocable) has grown from 3.8 million daily trips in 2012 to 5.4 million in 2018 (DNP, 2020[63]). However, operational problems such as a lack of updated information to users and an inefficient ticketing system hinder the SITM’s efficiency.
In addition to the time lost in commuting, mobility challenges have had a number of other detrimental effects, such as road fatalities, air pollution, greenhouse gas (GHG) emissions, increased wear on vehicles and roads, as well as social and psychological impacts due to higher levels of anxiety and stress. Colombia is 1 of the 8 OECD countries where the number of road deaths increased between 2010 and 2018, with a 25% rise in road deaths over the period – the second-highest increase behind Costa Rica. Colombia also has the second-highest number of road fatalities per 100 000 inhabitants among OECD countries, with 13.6 fatalities per 100 000 inhabitants in 2018 – just behind Costa Rica, which registered 15.7 road fatalities per 100 000 inhabitants (ITF, 2020[67]). While motorcycles represent 24% of the total number of vehicles used in Colombia, they are involved in more than half of road accidents.14
Road transport is also the largest consumer of energy and the largest source of carbon dioxide (CO2) emissions from fuel combustion in the country, with 589.1 kCO2 per capita in 2018 (OECD, n.d.[68]). According to the Colombian government’s estimates, the transport sector is responsible for 12% of GHG emissions (CO2, CH4, N2O, HFC, SF6 and PFC) in the country, of which 90% are produced by road transport (DNP, 2020[63]). The transport sector produces 70% of criteria pollutants (PM10, PM2.5, SO2, NO2, O3 and CO). The ageing vehicle fleet drives the high emission levels produced by road transport, as 34% of vehicles in Colombia are more than 20 years old (DNP, 2020[63]). The high number of motorcycles has been another driver of carbon emissions, as almost all of them (99%) operate on gasoline.15 Traffic congestion also has detrimental economic impacts, due to productivity loss, increases in prices of goods driven by higher transportation costs and fuel waste.
Colombia has implemented various policies in order to boost clean mobility and reduce GHG emissions associated with the transport and mobility sector. These include: Law 1964 of 2019, which promotes the use of electric vehicles and zero emissions, in particular through a tax of only 1% for this type of vehicles; the National Strategy for Electric Mobility 2019, which defines the actions to accelerate the transition to electric mobility, with the goal of 600 000 electric vehicles registered by 2030; and the Resolution of the Vehicles Modernisation Programme (Programa de Modernización de Vehículos), which promotes the introduction of new technologies and the production of new vehicles which are zero- or low- emission (electric, hybrid or natural gas). Efforts to decarbonise transport have also been made at the local level. Bogotá, D.C. for example, has one of the largest fleets of electric or low-emission buses in the whole of the American continent (Harper, 2019[69]).
In the wake of the COVID-19 crisis and adding to existing proactive policies encouraging cleaner transport modes, several Colombian cities, like many other cities around the world, have promoted active mobility, especially through investments in bicycle infrastructure, as a means of reducing personal vehicle use and demand for public transport and improving local air quality. Bogotá, D.C. for example, announced very early in spring 2020 the provision of an additional 35 km of cycleways, adding to the 550 km of cycleways already secured by an ambitious policy since the 1970s. Medellín plans to expand bike lanes by almost 50% within 3 years, to reach 145 km, and more than double the number of interconnected public transport lines, including overland trains, trams and cable car lines by 2030. Furthermore, the city is working to provide 50 000 electric bikes that residents can rent at a low cost and it is committed to electrifying all public transport by the end of the decade
While air pollution remains high, Colombian cities fare relatively well in other environmental indicators
While air pollution has decreased significantly in major cities thanks to fuel quality improvement, traffic regulation and installation of urban mass rapid transit systems, urban air pollution in Colombian cities remains high due to,among other things, the use of obsolete diesel vehicles, poor overseeing of polluting industries, the growing use of private cars and motorcycles, indiscriminate logging of forest, biomass burning, and an incipient environmental and recycling culture, which poses health threats with increased risks of heart and respiratory diseases. All cities in Colombia still have levels of exposure to PM2.5 above the limit recommended by the World Health Organization (WHO) at 5 μ/m3 (WHO, 2021[70]). Compared with other OECD countries, air pollution is high in Colombian FUAs on average, with several cities experiencing levels of PM2.5 around 30 µ/m3 or more (Figure 1.39). In order to reduce air pollution in cities and in line with the Colombian Green Growth Policy and Roadmap for 2030, the National Development Plan (Plan Nacional de Desarrollo, DNP) 2018-2022 “Pact for Colombia, Pact for Equity” set a goal of reducing the particulate matter levels in the air and improve air quality in cities. In order to achieve this goal, the number of monitoring stations has increased from 22% to 35% of stations complying with the PM10 standard established by the WHO. Air pollutant levels and meteorological variables are recorded by the Air Quality Information System (SISAIRE), which allows a continuous collection and revision of air quality data collected by the environmental authorities.
The residential sector is the second-largest consumer of energy in Colombia, with 41 739 gigawatts hours (GWh) consumed in 2019. However, compared with other OECD countries, Colombia displays relatively low housing-related levels of GHG emissions per capita (Figure 1.40), for example, Chile consumed 50 763 GWh and Mexico 62 000 GWh in 2018.
In terms of waste generation, municipal waste generation per capita in Colombia is less than half the OECD average (Figure 1.41). However, most waste is landfilled due to the absence of waste processing plants in most of the municipalities, which can have detrimental effects on human health and the environment. Furthermore, although waste disposal capacity has increased and the number of dumpsites has been reduced, about 30% of landfills still do not comply with environmental standards and, in several large cities, they have reached capacity (OECD/ECLAC, 2014[71]), while amounts of disposed waste continue to increase leading to the use of transfer stations and temporary storage. Between 2010 and 2019, the amount of waste increased by 7.9% in Colombia and by almost 20% in Bogotá, D.C.
Figure 1.39. Levels of PM2.5 in μ/m3, population-weighted average of OECD FUAs, 2019
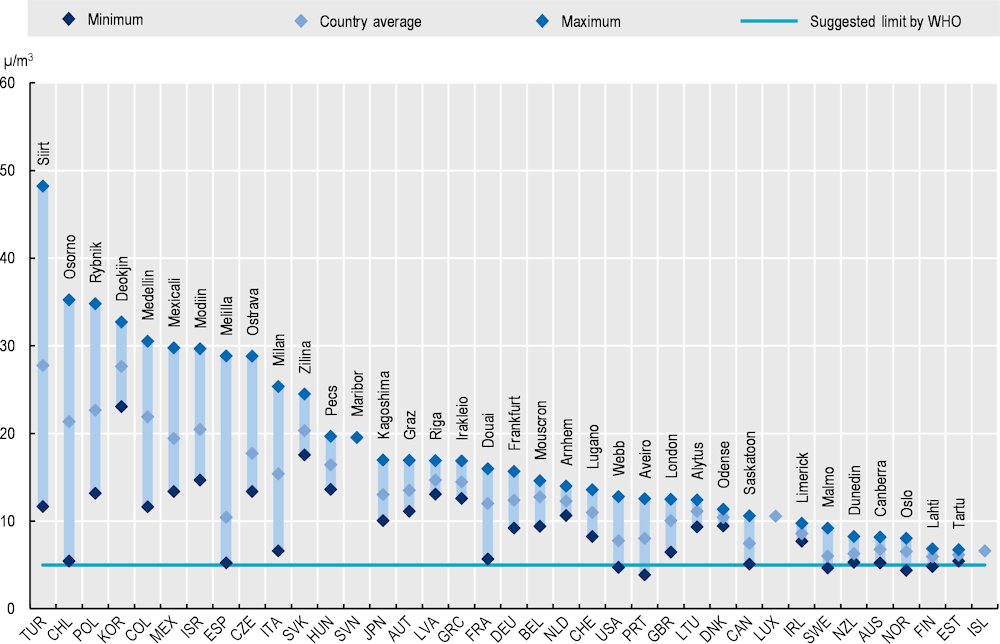
Note: The indicator of air pollution refers to the population-weighted average exposure to fine particulate matter that is less than 2.5 microns in diameter (PM2.5).
Source: OECD (2020[9]), OECD Regions and Cities at a Glance 2020, https://dx.doi.org/10.1787/959d5ba0-en.
Figure 1.40. Per capita emissions in the residential sector, OECD countries, 2018
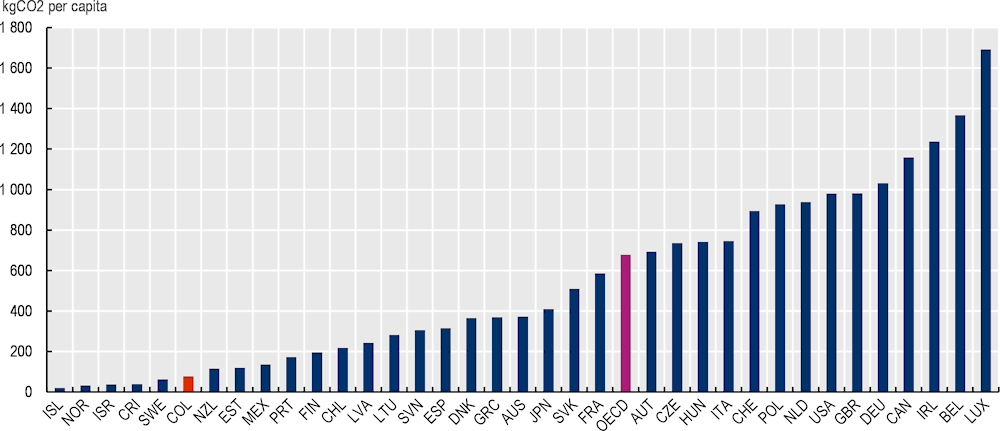
Source: IEA (n.d.[68]), IEA CO2 Emissions from Fuel Combustion Statistics, http://dx.doi.org/10.1787/co2-data-en.
Figure 1.41. Municipal waste generation per capita, 2019
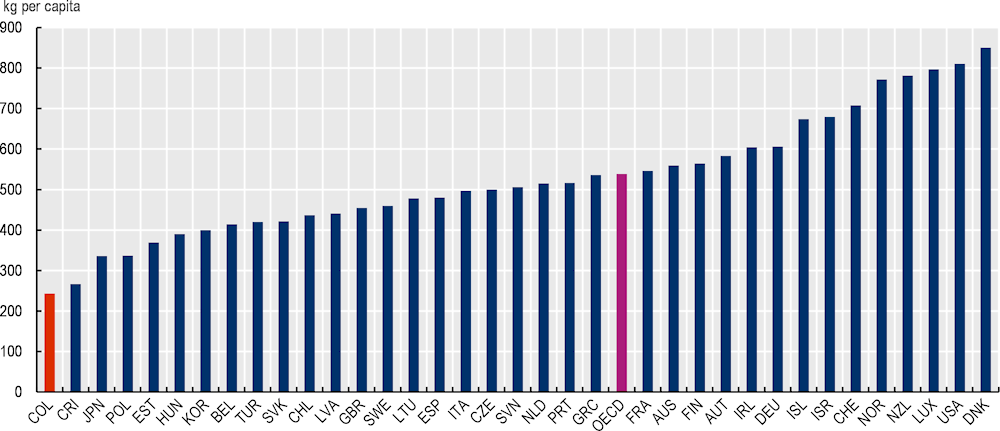
Note: Data are for 2019 except for Chile, Colombia, New Zealand and the United States for which data are for 2018, and for Iceland for which data are for 2017.
Source: OECD (n.d.[72]), Municipal Waste, Generation and Treatment (database), https://stats.oecd.org/index.aspx?DataSetCode=MUNW.
References
[38] Ahrend, R. et al. (2014), “What Makes Cities More Productive? Evidence on the Role of Urban Governance from Five OECD Countries”, OECD Regional Development Working Papers, No. 2014/5, OECD Publishing, Paris, https://dx.doi.org/10.1787/5jz432cf2d8p-en.
[62] Bocajero, J. (2020), “Congestion in Latin American cities: Innovative approaches for a critical issue”, Discussion Paper, ITF Roundtable 183, International Transport Forum/OECD, https://www.itf-oecd.org/sites/default/files/docs/congestion-latin-american-cities.pdf.
[6] Camargo, G. et al. (2020), “Exploring the dynamics of migration, armed conflict, urbanization, and anthropogenic change in Colombia”, PLoS ONE, Vol. 15/11, https://doi.org/10.1371/journal.pone.0242266.
[21] Castillo Varella, J. (2017), “Atlas de Expansión Urbana de Colombia”, Presentation, Departamento Nacional de Planeación, https://www.humanitarianresponse.info/es/operations/colombia/document/presentaci%C3%B3n-dnp-atlas-de-expansi%C3%B3n-urbana.
[33] DANE (2021), “Boletín Técnico Gran Encuesta Integrada de Hogares (GEIH) Febrero - abril 2021: Medición de empleo informal y seguridad social”, National Administrative Department of Statistics, Bogotá, https://www.dane.gov.co/files/investigaciones/boletines/ech/ech_informalidad/bol_geih_informalidad_feb21_abr21.pdf.
[54] DANE (2021), Censo de Habitantes de la Calle (Census of Homeless People), National Administrative Department of Statistics, Bogotá, https://www.dane.gov.co/files/investigaciones/boletines/censo-habitantes-calle/presentacion-CHC-rueda-de-prensa-2021.pdf.
[52] DANE (2021), National Quality of Life Survey, National Administrative Department of Statistics, Bogotá.
[56] DANE (2021), Pobreza Multidimensional en Colombia Año 2020, National Administrative Department of Statistics, Bogotá, https://www.dane.gov.co/files/investigaciones/condiciones_vida/pobreza/2020/boletin_tec_pobreza_multidimensional_20.pdf.
[26] DANE (2021), Principales indicatores del mercado laboral September 2021, National Administrative Department of Statistics, Bogotá.
[59] DANE (2020), Encuesta de Convivencia y Seguridad Ciudadana (ECSC) [Survey of Citizen Security and Coexistence], https://www.dane.gov.co/index.php/estadisticas-por-tema/seguridad-y-defensa/encuesta-de-convivencia-y-seguridad-ciudadana-ecsc.
[53] DANE (2020), Nota metodológica: Déficit Habitacional CNPV 2018, National Administrative Department of Statistics, Bogotá.
[49] DANE (2019), “Boletín Técnico: Encuesta Nacional de Calidad de Vida (ECV) 2018”, National Administrative Department of Statistics, Bogotá, https://www.dane.gov.co/files/investigaciones/condiciones_vida/calidad_vida/Boletin_Tecnico_ECV_2018.pdf.
[13] DANE (2018), Censo Nacional de Población y Vivienda - CNPV - 2018, National Administrative Department of Statistics, Bogotá, https://www.datos.gov.co/Estad-sticas-Nacionales/Censo-Nacional-de-Poblaci-n-y-Vivienda-CNPV-2018/qzc6-q9qw.
[8] DANE (n.d.), Conceptos básicos, National Administrative Department of Statistics, Bogotá.
[22] DANE (n.d.), DANE Geoportal, National Administrative Department of Statistics, Bogotá, https://dane.maps.arcgis.com/home/index.html.
[27] DANE (n.d.), Desempleo, National Administrative Department of Statistics, Bogotá, https://www.dane.gov.co/index.php/lista-de-resultados-de-busqueda?searchword=desempleo&searchphrase=all.
[39] DANE (n.d.), Directorio Estadístico de Empresas, National Administrative Department of Statistics, Bogotá, https://www.dane.gov.co/index.php/servicios-al-ciudadano/servicios-informacion/directorio-estadistico/directorio-estadistico-de-empresas.
[34] DANE (n.d.), GEIH - Empleo informal y seguridad social, National Administrative Department of Statistics, Bogotá, https://www.dane.gov.co/index.php/calendario/icalrepeat.detail/2020/07/13/4617/-/geih-empleo-informal-y-seguridad-social.
[24] DANE (n.d.), Gran Encuesta de Hogares - GEIH, National Administrative Department of Statistics, Bogotá, https://dane.maps.arcgis.com/home/index.html.
[58] DANE (n.d.), Homepage, http://www.dane.gov.co (accessed on 23 March 2022).
[3] DANE (n.d.), Proyecciones de Población, National Administrative Department of Statistics, Bogotá, https://www.dane.gov.co/index.php/estadisticas-por-tema/demografia-y-poblacion/proyecciones-de-poblacion.
[17] Dijkstra, L., H. Poelman and P. Veneri (2019), “The EU-OECD definition of a functional urban area”, OECD Regional Development Working Papers, No. 2019/11, OECD Publishing, Paris, https://dx.doi.org/10.1787/d58cb34d-en.
[63] DNP (2020), Politica Nacional de Movilidad Urbana y Regional, Consejo Nacional de Política Económica y Social, República de Colombia, https://colaboracion.dnp.gov.co/CDT/Conpes/Econ%C3%B3micos/3991.pdf.
[37] Duranton, G. and D. Puga (2004), “Micro-foundations of urban agglomeration economies”, in Henderson, J. and J. Thisse (eds.), Handbook of Regional and Urban Economics.
[4] European Commission (n.d.), Global Human Settlement Layer, https://joint-research-centre.ec.europa.eu/global-human-settlement-layer-ghsl_en.
[15] Gobierno de Colombia (2014), Política Nacional para Consolidar el Sistema de Ciudades en Colombia, CONPES 3819, Consejo Nacional de Política Económica y Social, República de Colombia, https://s3.pagegear.co/38/69/2017/conpes_3819_sistema_de_ciudades.pdf.
[11] Gobierno de Colombia (n.d.), Gran Encuesta Integrada de Hogares - GEIH, https://www.datos.gov.co/Estad-sticas-Nacionales/Gran-Encuesta-Integrada-de-Hogares-GEIH/mcpt-3dws.
[25] Guzman, L. and J. Bocarejo (2017), “Urban form and spatial urban equity in Bogota, Colombia”, Transportation Research Procedia, Vol. 25, https://doi.org/10.1016/j.trpro.2017.05.345.
[69] Harper, R. (2019), “Colombia to have the largest electric bus fleet in the Americas”, Intelligent Transport, https://www.intelligenttransport.com/transport-news/92430/colombia-largest-electric-bus-fleet-in-americas/.
[7] Ibáñez, A. and A. Moya (2006), “¿Cómo el desplazamiento forzado deteriora el bienestar de los hogares desplazados?: análisis y determinantes del bienestar en los municipios de recepción”, CEDE, https://www.researchgate.net/publication/4832643_COMO_EL_DESPLAZAMIENTO_FORZADO_DETERIORA_EL_BIENESTAR_DE_LOS_HOGARES_DESPLAZADOS_ANALISIS_Y_DETERMINANTES_DEL_BIENESTAR_EN_LOS_MUNICIPIOS_DE_RECEPCION.
[23] IDMC (2020), From Aid to Empowerment: Addressing Urban Displacement in Colombia’s Informal Settlements, Internal Displacement Monitoring Centre, https://reliefweb.int/sites/reliefweb.int/files/resources/Urban%20displacement%20columbia_EN_26-11.pdf.
[32] IMF (2020), Colombia: Selected Issues, International Monetary Fund, https://www.imf.org/en/Publications/CR/Issues/2020/04/16/Colombia-Selected-Issues-49332.
[64] INRIX (2021), INRIX 2020 Global Traffic Scorecard, https://inrix.com/scorecard/.
[67] ITF (2020), Road Safety Annual Report 2020, OECD Publishing, Paris, https://doi.org/10.1787/f3e48023-en.
[60] ITF/OECD (2019), Road Safety Annual Report 2019: Colombia, International Transport Forum, https://www.itf-oecd.org/sites/default/files/colombia-road-safety.pdf.
[47] Lombard, M., J. Hernandez-Garcia and A. Lopez Angulo (2021), “Informal rental housing in Colombia: An essential option for low-income households”, International Development Planning Review, Vol. 43/2, pp. 257-277, https://doi.org/10.3828/idpr.2020.6.
[12] Moreno Horta, I. and P. Rossiasco (2019), “How Venezuelan migration is changing urban expansion in Cucuta, Colombia”, World Bank Blogs, https://blogs.worldbank.org/latinamerica/how-venezuelan-migration-changing-urban-expansion-cucuta-colombia.
[51] MVCT (2020), Análisis del Capacidades y Entornos del Ministerio de Vivienda, Ciudad y Territorio, Ministerio de Vivienda, Ciudad y Territorio.
[43] OECD (2021), OECD Economic Outlook, Volume 2021 Issue 2: Preliminary version, OECD Publishing, Paris, https://dx.doi.org/10.1787/66c5ac2c-en.
[35] OECD (2021), OECD SME and Entrepreneurship Outlook 2021, OECD Publishing, Paris, https://dx.doi.org/10.1787/97a5bbfe-en.
[46] OECD (2020), Affordable Housing Database, OECD, Paris, http://oe.cd/ahd.
[28] OECD (2020), “Capacity for remote working can affect lockdown costs differently across places”, OECD Policy Responses to Coronavirus (COVID-19), OECD, Paris, https://www.oecd.org/coronavirus/policy-responses/capacity-for-remote-working-can-affect-lockdown-costs-differently-across-places-0e85740e/.
[18] OECD (2020), Country Compilation of Functional Urban Areas, OECD, Paris, https://www.oecd.org/cfe/regionaldevelopment/Appendix_all_fuas.pdf.
[31] OECD (2020), Education at a Glance 2020: OECD Indicators, OECD Publishing, Paris, https://dx.doi.org/10.1787/69096873-en.
[73] OECD (2020), Functional Urban Areas in Colombia, OECD, Paris, https://www.oecd.org/cfe/regionaldevelopment/Colombia.pdf.
[29] OECD (2020), Job Creation and Local Economic Development 2020: Rebuilding Better, OECD Publishing, Paris, https://dx.doi.org/10.1787/b02b2f39-en.
[9] OECD (2020), OECD Regions and Cities at a Glance 2020, OECD Publishing, Paris, https://dx.doi.org/10.1787/959d5ba0-en.
[30] OECD (2019), OECD Economic Surveys: Colombia 2019, OECD Publishing, Paris, https://dx.doi.org/10.1787/e4c64889-en.
[42] OECD (2015), Governing the City, OECD Publishing, Paris, https://dx.doi.org/10.1787/9789264226500-en.
[36] OECD (2015), The Metropolitan Century: Understanding Urbanisation and its Consequences, OECD Publishing, Paris, https://dx.doi.org/10.1787/9789264228733-en.
[14] OECD (2014), OECD Territorial Reviews: Colombia 2014, OECD Territorial Reviews, OECD Publishing, Paris, https://dx.doi.org/10.1787/9789264224551-en.
[44] OECD (n.d.), Analytical House Prices Indicators (database), OECD, Paris, https://stats.oecd.org/Index.aspx?DataSetCode=HOUSE_PRICES.
[55] OECD (n.d.), Broadband Portal, OECD, Paris, http://www.oecd.org/sti/broadband/oecdbroadbandportal.htm.
[68] OECD (n.d.), IEA CO2 Emissions from Fuel Combustion Statistics: Greenhouse Gas Emissions from Energy, OECD Publishing, Paris, https://dx.doi.org/10.1787/co2-data-en.
[72] OECD (n.d.), Municipal Waste, Generation and Treatment (database), OECD, Paris, https://stats.oecd.org/index.aspx?DataSetCode=MUNW.
[45] OECD (n.d.), OECD Better Life Index: Colombia, OECD, Paros, https://www.oecdbetterlifeindex.org/countries/colombia/.
[19] OECD.stat (n.d.), Historical Population (database), OECD, Paris, https://stats.oecd.org/Index.aspx?DataSetCode=HISTPOP.
[20] OECD.stat (n.d.), Metropolitan Areas (database), OECD, Paris, https://stats.oecd.org/Index.aspx?DataSetCode=CITIES.
[1] OECD/EC (2020), Cities in the World: A New Perspective on Urbanisation, OECD Urban Studies, OECD Publishing, Paris, https://dx.doi.org/10.1787/d0efcbda-en.
[71] OECD/ECLAC (2014), OECD Environmental Performance Reviews: Colombia 2014, OECD Environmental Performance Reviews, OECD Publishing, Paris, https://dx.doi.org/10.1787/9789264208292-en.
[10] OECD/UCLG (2016), Subnational Governments Around the World: Structure and Finance, https://www.uclg.org/sites/default/files/global_observatory_on_local_finance_0.pdf.
[2] Rueda, J. (1999), “El campo y la ciudad: Colombia, de país rural a país urbano”, https://www.banrepcultural.org/biblioteca-virtual/credencial-historia/numero-119/el-campo-y-la-ciudad-colombia-de-pais-rural-pais-urbano.
[61] RUNT (n.d.), Homepage, Registro Único Nacional de Tránsito, http://www.runt.com.co (accessed on 15 November 2021).
[41] Samad, T., N. Lozano-Gracia and A. Patman (eds.) (2012), Colombia Urbanization Review: Amplifying the Gains from the Urban Transition, World Bank, Washington, DC, https://doi.org/10.1596/978-0-8213-9522-6.
[16] Sanchez-Serra, D. (2016), “Functional Urban Areas in Colombia”, OECD Regional Development Working Papers, No. 2016/8, OECD Publishing, Paris, https://dx.doi.org/10.1787/5jln4pn1zqq5-en.
[5] Schultz, T. (1971), “Rural-urban migration in Colombia”, The Review of Economics and Statistics, Vol. 53/2, pp. 157-163, https://doi.org/10.2307/1925711.
[65] Secretaría Distrital de Movilidad (2019), “Encuesta de Movilidad 2019: Indicadores Preliminares”, https://www.movilidadbogota.gov.co/web/sites/default/files/Paginas/22-04-2020/20191216_presentacion_encuesta_v2.pdf.
[66] Suzuki, H., R. Cervero and K. Iuchi (2013), Transforming Cities with Transit: Transit and Land-Use Integration for Sustainable Urban Development. Urban development, World Bank, Washington, DC, https://openknowledge.worldbank.org/handle/10986/12233.
[48] Torres Ramírez, J. (2012), “Estudio sobre el mercado de arrendamiento de vivienda en Colombia - Informe final”, Banco Interamericano de Desarrollo/Inter-American Development Bank, https://publications.iadb.org/publications/spanish/document/Estudio-sobre-el-mercado-de-arrendamiento-de-vivienda-en-Colombia.pdf (accessed on 11 February 2022).
[40] Venables, A. (2007), “Evaluating urban transport Iimprovements: Cost-benefit analysis in the presence of agglomeration and income taxation”, Journal of Transport Economics and Policy, Vol. 41/2, pp. 173-188, https://www.jstor.org/stable/20054012.
[70] WHO (2021), WHO Global Air Quality Guidelines, World Health Organization, https://apps.who.int/iris/bitstream/handle/10665/345329/9789240034228-eng.pdf?sequence=1&isAllowed=y.
[50] World Bank (2019), Vivienda digna para todos, World Bank Group, Washington, DC, http://documents.worldbank.org/curated/en/535261564743579904/Vivienda-Digna-para-Todos.
[57] World Bank (2018), Migration from Venezuela to Colombia: Short- and Medium-Term Impact and Response Strategy, World Bank, Colombia, https://openknowledge.worldbank.org/handle/10986/30651.
Annex 1.A. Methodology to identify FUAs according to Colombia’s System of Cities and the EU/OECD
Definition of Colombian FUAs by Colombia’s System of Cities
To define FUAs, Colombia’s System of Cities takes into account four criteria:
The functional relationship between municipalities based on the analysis of workers’ daily commutes between two municipalities (Colombia’s System of Cities sets a 10% commute threshold between municipalities to define FUAs, i.e. are included in the FUA the municipalities in which more than 10% of their workforce travels daily to work in another municipality).
The population size (greater than 100 000 inhabitants).
The political-administrative function of municipalities (department capitals with fewer than 100 000 inhabitants).
The strategic importance of the municipalities in the regions (municipalities with fewer than 100 000 inhabitants that have a strategic function in terms of service provision at the subregional level).
Annex Figure 1.A.1. Colombia’s System of Cities
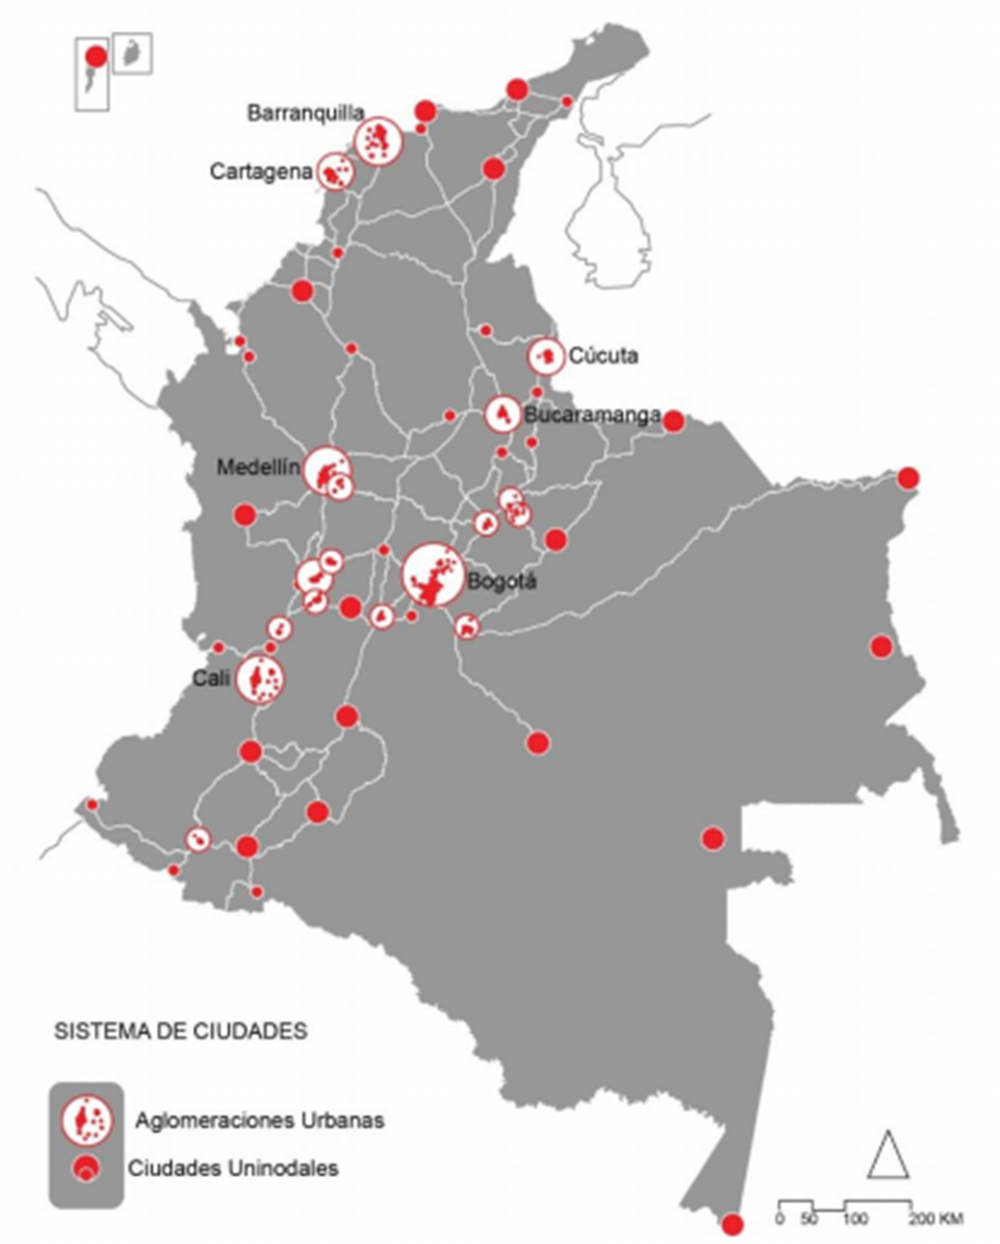
Source: Mission of the System of Cities (2012-2014); Gobierno de Colombia (2014[15]), Política Nacional para Consolidar el Sistema de Ciudades en Colombia, CONPES 3819, https://s3.pagegear.co/38/69/2017/conpes_3819_sistema_de_ciudades.pdf.
Colombia’s System of Cities identifies two types of urban forms. The first category includes functional cities which are a group of contiguous urban centres with shared characteristics, functional relationships in terms of commuting patterns, more than 100 000 inhabitants and are usually concentrated around a main city. The second form includes single-municipality functional cities whose functional area remains within the administrative limit of the municipality and are municipalities with regional relevance as service providers, including department capitals (Gobierno de Colombia, 2014[15]).
Following this methodology, Colombia’s System of Cities identifies 56 FUAs: 18 are considered functional cities (i.e. groups of municipalities), of which 14 revolve around capital cities and which include 113 municipalities, and 38 single-municipality functional cities (Gobierno de Colombia, 2014[15]).
Definition of Colombian FUAs by the EU/OECD
According to the EU/OECD methodology, an FUA consists of a densely inhabited city and surrounding area (commuting zone) whose labour market is highly integrated with the city, thereby encompassing the economic and functional extent of cities based on people’s daily movements.
Annex Figure 1.A.2. OECD FUAs in Colombia
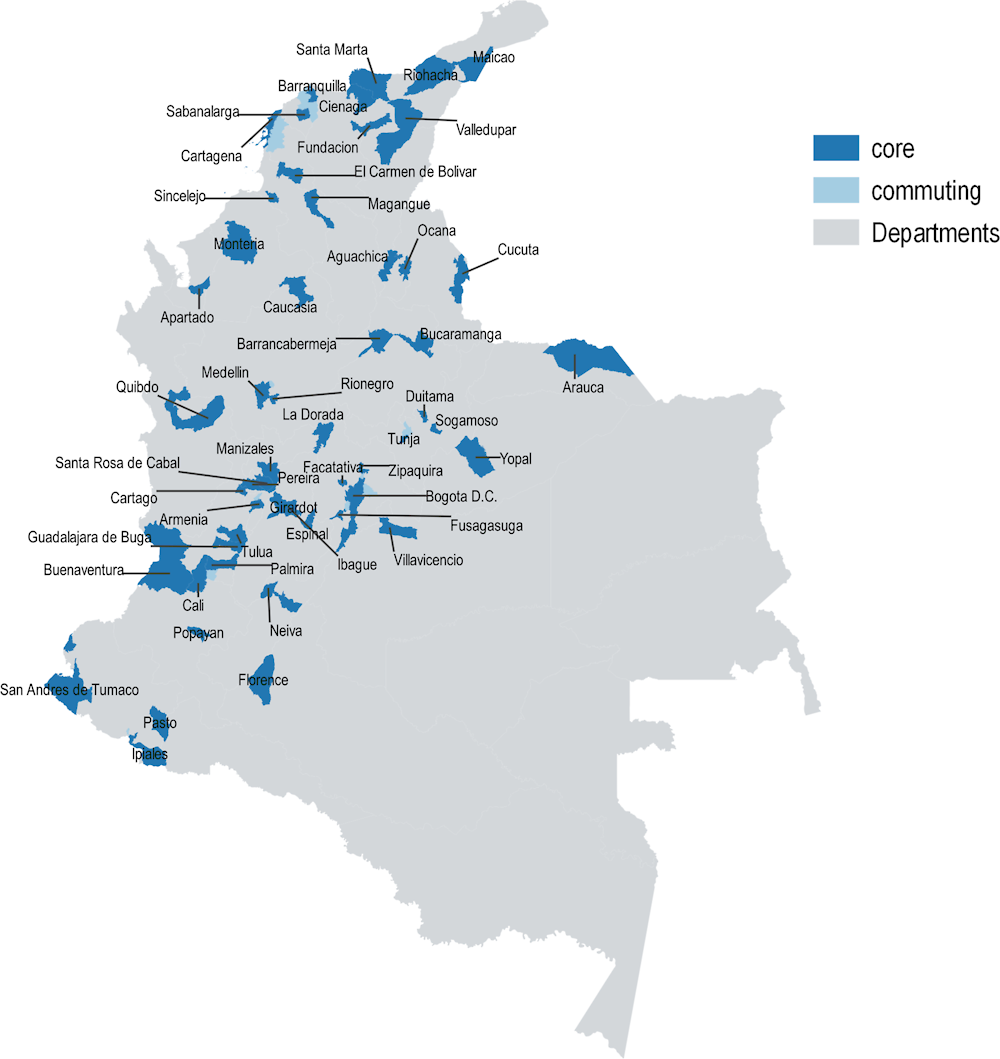
Source: OECD (2020[73]), Functional Urban Areas in Colombia, https://www.oecd.org/cfe/regionaldevelopment/Colombia.pdf.
The methodology consists of four main steps:
Identification of an urban centre, i.e. a set of high density (1 500 residents per km²) grid cells with a population of 50 000 inhabitants in the contiguous cells.
Identification of a city, i.e. one or more local units that have at least 50% of their residents inside an urban centre.
Identification of a commuting zone, i.e. a set of contiguous local units that have at least 15% of their employed residents working in the city.
Definition of the FUA as the combination of the city and its commuting zone (Dijkstra, Poelman and Veneri, 2019[17]).
The EU/OECD methodology identifies 53 FUAs in Colombia made up of 106 municipalities.
Notes
← 1. The World Bank defines upper middle-income economies as countries with a gross national income (GNI) per capita between USD 4 096 and USD 12 695 (https://datahelpdesk.worldbank.org/knowledgebase/articles/906519-world-bank-country-and-lending-groups).
← 2. The data is presented in terms of events because a victim could have suffered more than one forced displacement at a different time or place.
← 3. Information provided by the Colombian government’s Victims’ Unit (Unidad para las Víctimas) to the OECD. See also: https://www.unidadvictimas.gov.co/es/quienes-somos/mision-y-vision/184.
← 4. A commute threshold is the minimum share of workforce in a municipality or contiguous local units that travels daily to work in another municipality to be included in the FUA.
← 5. DANE–Proyecciones de población (Dirección de Censos y Demografía) and Marco Geoestadístico Nacional–MGN 2020 (Dirección de Información Geoestadística).
← 6. Consolidated illegal informal settlements refer to illegal human settlements whose buildings are permanent, built with stable materials, have installed public infrastructure, with paved roads and institutional buildings promoted by the Colombian State, while precarious illegal informal settlements refer to illegal human settlements which present incomplete development conditions and are in various states of consolidation.
← 7. The 23 departments’ capital cities and metropolitan areas are: Armenia, Barranquilla A.M., Bucaramanga A.M., Bogotá D.C., Cali A.M., Cartagena, Cúcuta A.M., Florencia, Ibagué, Manizales A.M., Medellín A.M., Montería, Neiva, Pereira A.M., Pasto, Popayán, Quibdó, Riohacha, Santa Marta, Sincelejo, Tunja, Valledupar and Villavicencio.
← 8. The definition adopted by DANE for the measurement of informal employment refers to the 15th International Conference of Labour Statisticians (ICLS) resolution of the International Labour Organization (ILO) of 1993 and the recommendations of the DELHI group (group of experts convened by the United Nations for the measurement of the informal economy). Informal employees are: private employees who work in establishments, businesses or companies that employ up to five people in all of their agencies and branches, including the employer and/or partner; unpaid family workers in companies with five workers or less; unpaid workers in companies or businesses of other households; domestic employees in companies with five workers or less; day workers or workers in companies with five workers or less; self-employed workers who work in establishments up to five people, except professional independent workers; employers or employers in companies with five workers or less; government workers or employees are excluded.
← 9. The definition of VIS relates to a maximum legal sale price of the housing units, established by Decree 4466 of 2007 at 135 minimum monthly wage (MMW, USD 261 in April 2021). This ceiling can be higher in urban agglomerations with more than 1 million inhabitants (150 MMW) and in renovation areas (175 MMW). Within VIS, the VIP (Vivienda de intéres prioritario) subcategory refer to social housing with a maximum sale price even lower than for VIS (less than 70 MMV in general and 90 MMW in large urban agglomerations with more than 1 million inhabitants).
← 10. Unliveable conditions are defined using the DANE methodology. It includes reviewing minimum habitability conditions such as infrastructure materials, cohabitation, independent kitchen areas and access to public services.
← 11. The five dimensions are: i) educational attainment (illiteracy and low educational attainment); ii) childhood and youth conditions (school absence, school delay, barriers to early childhood care services, child labour); iii) work (informal work and long-term unemployment); iv) health (without health insurance, barriers to access to health); and v) housing conditions and access to public services (no access to an improved water source, inadequate sewage disposal, unsuitable floor materials, unsuitable wall materials and critical overcrowding).
← 12. The Gini index measures the distance between the Lorenz curve and the hypothetical line of absolute equality. A Gini index of 0 represents perfect equality and 1 perfect inequality.
← 13. For further information, see the vehicles registry (Registro Unico Nacional de Tránsito, RUNT), https://www.runt.com.co/runt-en-cifras/.
← 14. For further information, see https://www.revistaautocrash.com/causas-accidentalidad-motocicletas-colombia/.

