Population ageing is leading to rising financing pressures in the pension, health care and long-term care systems. Official projections suggest that ageing-related spending could increase by 3.2% of GDP by 2070. Less optimistic assumptions about demographic developments and labour market outcomes could add several percentage points to pension spending. Moreover, the risk of old-age poverty is relatively high in the earnings-related pay-as-you-go pension system, and expected pension benefits are difficult to calculate. Measures to correct these issues could double the projected increase in public pension spending in the long run. In addition, the centralised health care system has relatively little use of price signals, contributing to reduced access and outcomes that are worse than elsewhere. Structural reform could improve efficiency, but securing a projected increase in life expectancy of 10 years, aligning it with the EU average, is likely to require additional public resources. This, together with the cost of new technologies and improving quality and coverage, could increase spending by as much as 50% by 2070. The fragmented long-term care system is putting a relatively large responsibility for such care on family members, implying that public spending in this area will increase, particularly as economic structural changes affects the geographical distribution of the population.
OECD Economic Surveys: Hungary 2019

Chapter 1. The challenges of sustaining Hungary’s pension and health systems
Introduction
The Hungarian population is ageing and shrinking, increasing pressures on ageing-related spending and the contribution base (European Commission, 2018a). In 2016, there were 2.5 million old-age pensioners, roughly one-quarter of the population (Ministry for National Economy, 2017). Total public expenditure on pensions was 9.7% of GDP in 2016, while public expenditure on health and long-term care was 5.6% of GDP (European Commission, 2017). Over the longer term, the number of old-age pensioners is set to rise while the overall population will shrink from 9.8 million to 8.9 million nearly doubling the old-age dependency ratio (European Commission, 2017). The resulting decline in the old‑age support ratio is particularly challenging for pay-as-you-go pension schemes such as Hungary’s as pension spending is financed by contributions of current workers (Fall and Bloch, 2014).
One of the main problems that the pension system will face is therefore that spending on pension benefits will increase faster than contributions. If no offsetting measures are taken, general government debt (Maastricht definition) could exceed 180% of GDP by 2070 (see Key Policy Insights). In addition, the design of the current system involves a high risk of old-age poverty, as well as large variations in pension benefits between workers with similar careers but retiring at different time. Moreover, it is difficult for people in the labour market to predict their future pension benefits. The health system, meanwhile, is based on central planning with little use of price signals, hampering its ability to adjust health-care supply to the demographic changes. An additional challenge is to enhance the sector’s low efficiency as life expectancy is presumed to increase by a decade to converge with the European average – a development that is likely to raise health spending towards European levels. The first part of this chapter will analyse the challenges related to the structure of the current pension system, the second part of the chapter will focus on health policy.
The public pay-as-you-go pension system runs a deficit
Well-functioning pension systems are both actuarially fair (people receive pensions in proportion to their contributions) and actuarially neutral (early or late retirement leads to decrements or increments to their pension benefits to correct for missing contributions or over-contributions) (Fall and Bloch, 2014) (Queisser and Whitehouse, 2006). To be actuarially fair, people should receive in retirement the same as what they paid in when working, together with the investment returns on the accumulated assets before retirement (Fall and Bloch, 2014).
The Hungarian pension system is a pay-as-you-go (PAYG) single pillar, earnings-related scheme with defined benefits (DB) (OECD, 2017a). It is not fully actuarially fair owing to the non-linearity of pension accruals and the valorisation of earnings, and there is a lack of actuarially neutral adjustment for early retirement rules for women who can retire without penalties. These are discussed below.
At least 15 years of work is required to receive some pension benefits, and 20 years are required for a full pension. There is no basic (universal) state pension. Those with fewer than 15 years’ accrual are not entitled to a pension, but can receive social assistance, worth around 8.3% of average gross earnings, or roughly 12%-19% of net earnings (with in-kind benefits worth around 25% of the value of benefits) (OECD, 2017a). Only Turkey, Mexico and Korea provide lower safety-nets within the OECD (OECD, 2015a).
There is a minimum monthly pension of HUF 28 500 (EUR 90) for workers with at least 20 years’ accrual. It is mainly relevant for low-wage income earners who lost income during the transition to a market economy in the early 1990s, and currently few pensioners rely on it (OECD, 2017a) (Ministry for National Economy, 2017). However, the cohorts born between 1960 and the 1980s, who were the most affected by the economic transition, will have had more difficulty earning a full pension, and as many as 4% of a cohort may have to rely on the minimum pension, or the social safety net (Augusztinovics et al., 2009).The amount of the minimum pension is 40% below of the poverty level (defined as half the median wage). It has been unchanged in nominal terms since 2008 and is used to benchmark other social benefits. Safety-net incomes ought to be indexed to prices to maintain purchasing power.
The PAYG system includes all workers, including the self-employed, and provides survivors' pensions. Nearly all other schemes or special regimes have been abolished or are being phased out (Ministry for National Economy, 2017). Workers and employers pay social security contributions of 10% and 19.5% of gross earnings, respectively (Ministry of the National Economy, 2018). In 2018, 79.5% of the total social contributions went to the Pension Insurance Fund while the rest was directed to the Health Insurance Fund (Ministry for National Economy, 2017). In addition, the 2018 Budget Act allocates additional subsidies of 0.2% of GDP, to cover pension payments.
A second pillar of a mandatory private defined contributions (DC) scheme to supplement the PAYG system was dissolved in 2010 and the funds transferred back to the state to repay public debt (OECD, 2012) (Freudenberg, Berki and Reiff, 2016). In doing so, an important funding source for future pensions was removed (Box 1.1). In the third pillar, various voluntary pension insurance and savings schemes have around 1.3 million members.
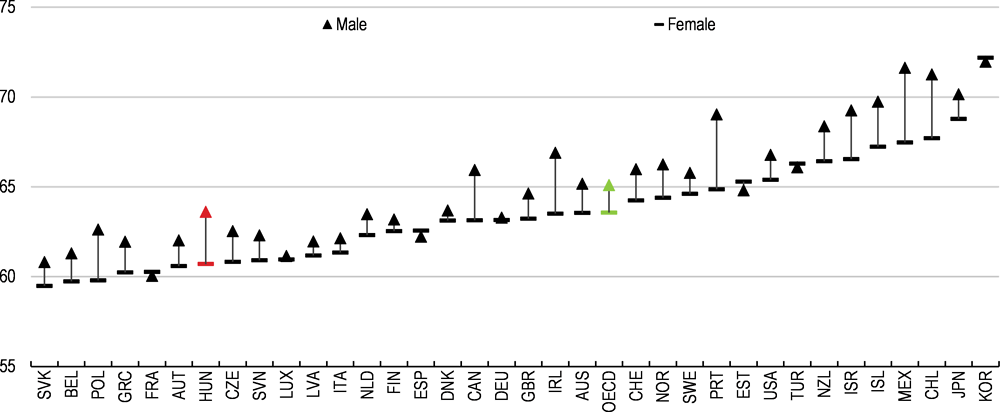
The statutory retirement age is gradually being increased to 65 years by 2022 for men and women (Box 1.1). It was 63.5 at the beginning of 2018. The retirement age is lower than in most other OECD countries, and will remain below the OECD average even after 2022 (European Commission, 2018b) (OECD, 2017a). The government has sought to increase the effective retirement age by raising the official pension age while abolishing most forms of early retirement (OECD, 2017a) (OECD, 2018a). Curbing early retirement combined with the increase in the statutory retirement age has increased the effective retirement age by just over one year to 62 years for men and women combined since 2012 (European Commission, 2018a). However, the effective retirement age remains well below the OECD average, especially for women (Figure 1.1).
In 2017, the pre-tax pension replacement rate (the ratio of initial pensions to last earnings) for Hungary was 58.7% (OECD, 2018b), above the OECD average of 52.9% (OECD, 2017a). Since January 2012, pension benefits have been indexed to prices, based on the projected consumer price index (CPI) in the annual budget. A retroactive upwards correction takes place by end-year in case the full-year CPI overshoots projections (OECD, 2017a).
A pension premium is paid to existing pensioners at end-year if annual GDP growth exceeds 3.5%, and provided the budget is evolving according to projections. The premium is calculated by subtracting 3.5 from the year’s GDP growth in percentage points and multiplying it with 25% of the monthly pension payment, with a ceiling of EUR 250. In 2017, the majority of pensioners received an additional pay-out of around EUR 37, but some only received the minimum of EUR 20. To ensure that pensioners benefit from periods of economic upswing, a less arbitrary solution would be a rules-based system, such as wage (or part-wage) indexation.
Figure 1.1. The effective retirement age remains below the OECD average, especially for women
Box 1.1. Recent pension reforms
The 2009 reform
The statutory retirement rage was raised from 62 years to 65 years, increasing by 0.5 years every year for cohorts born after 1952, to be fully implemented by 2022.
Indexation of pension benefits in retirement was switched in steps from a 50% price-50% wage index (so-called "Swiss indexation") to pure price indexation linked to the national CPI which was implemented from 2012 (Domonkos and Simonovits, 2016).
The 2010 reform (the "switchback reform")
The government reversed the three-pillar system introduced by the 1997 Pension Law:
• The second mandatory defined contributions pillar was de facto eliminated. Roughly 90% of the capital (around 11% of GDP) accumulated between 1998 and 2010 by the mandatory private pension funds was transferred into the general government budget, leaving a sizeable budget surplus in 2011 (OECD, 2012) (Freudenberg et al, 2016). All payments out from the pillar were suspended, and all previous mandatory payments (employer and employee contributions) were diverted into the PAYG scheme (Freudenberg, Berki and Reiff, 2016).
• From 2011, new labour market entrants are automatically enrolled in the PAYG system.
• Before the reversal more than 70% of the labour force were members of a labour market pension fund. After the reversal only 102 000 scheme members stayed in the defined‑contribution scheme; essentially young people and high-income earners. According to the current rules, remaining members accrue pensions in the first pillar, but they can only make additional payments to the second pillar on a voluntary basis, and there is no annuity upon retirement but a lump sum payment. Today some 57 000 members remain in the scheme (Casey, 2012) (Freudenberg, Berki and Reiff, 2016).
The 2011 reform: abolishing early retirement and 2011 income-tax reform
• From 2011, all forms of early retirement were abolished (with exception of women with 40 years' service, the “Women 40” scheme). Prior to 2011 more than 30% of pension beneficiaries were below the statutory retirement age, mainly owing to early retirement or disability (OECD, 2010). Disability pensions were separated from the old-age pension system and transformed into a special disability provision, as was rehabilitation.
• Special service pension benefits for the armed forces where abolished, with the exception of recipients having reached the age of 57 before December 2011 (OECD, 2018a).
• The special treatment of workers in arduous/hazardous work was eliminated. Replaced by a “benefit prior to retirement age”, where benefits are not means-tested, financed by taxes paid to the general budget. Some 2 000 people receive these benefits every year (OECD, 2018a).
• The flat-rate income tax reform of 2011 led to an increase of post-tax net earnings. It also simultaneously removed the tax-free bottom income threshold (Kosa, 2012). As a result, wage‑earners who retired post-2011 will have earned higher pensions for the same contribution rates than previous retirement cohorts. High-income groups have befitted disproportionately as low‑income groups no longer have a tax-free threshold and therefore have a lower take-home pay on which pension entitlements are calculated (Czeglédi et al., 2016).
Calculation of pension benefits
Pension entitlements are calculated from monthly average earnings net of income tax and social contributions. An accrual rate is attributed for each year worked. At retirement, the total accrual is converted into pension benefits by multiplying the accumulated accrual rate with average lifetime earnings. Earnings are adjusted annually by the previous year’s national average-wage increase (known as valorisation) to reflect rising economy-wide welfare during the service time (OECD, 2017a) (Czegledi et al., 2017) (Ministry for National Economy, 2017) (Freudenberg, Berki and Reiff, 2016) (OECD, 2018a). Above HUF 372 000 (EUR 1 200) a gradual reduction to earnings is applied for the benefit calculation (see footnote in Table 1.1), but there is no upper earnings ceiling for pension accrual (Ministry for National Economy, 2017). For an individual earning HUF 500 000, this means that the pensionable income is HUF 479 300 (Table 1.1).
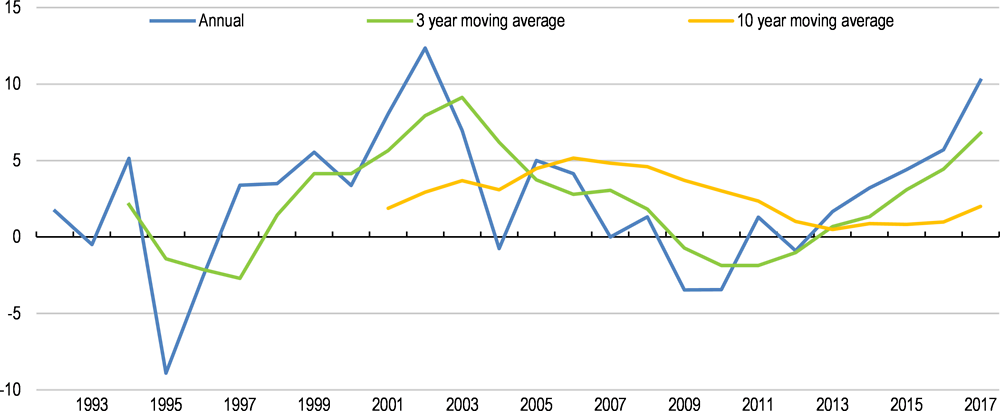
The large fluctuations in wage growth is translated into hard-to-predict variations in the monetary value of initial pension benefits as past wage developments are used to calculate the present-day value of earnings, whereas pension benefits received in retirement are indexed to prices, meaning that they do not follow wage developments. As a result, initial pension benefits vary for workers with similar wage careers but with different retirement years. Because real wages have risen by around 20% since 2016, someone who retires in 2018 will have a 20% higher initial pension than a 2016 retiree with a similar wage career. To increase predictability, authorities could benchmark against a moving average of real-wage developments, such as a ten-year moving average of wage growth, to take account of the business cycle, which would almost remove the fluctuations and ensure better predictability of future pension entitlements (Figure 1.2). To ensure transparency, the calculated average, whether using 10 years or another number, would need to be made public every year.
Table 1.1. Benefit calculations
% of average net earnings, unless otherwise stated1
|
|
Earnings-related |
Minimum pension |
Non-eligible for minimum <15 years’ service |
Early retirement (before 65 years) |
|---|---|---|---|---|
|
First 10 years of coverage |
33% |
No pension entitlement if < 15 years coverage, but an old-age allowance may be received (see next column). |
For a couple: allowance is 85% of minimum pension Single person < 75 years: 100% of minimum Singe person > 75 years: 135% |
nil |
|
11-25 years of coverage |
Add 2% per year worked |
After 20 years of service: HUF 28 500/month (unchanged since 2008) |
nil |
|
|
26-36 years of coverage |
Add 1% per year worked |
nil |
||
|
37-40 years of coverage |
Add 1.5% per year worked |
Available for women with at least 40 years' eligibility |
||
|
41 and above |
2% per year worked |
n/a |
||
|
Late retirement (working past statutory retirement age) |
0.5% per month worked after statutory retirement age |
n/a |
1. Earnings are valorised with economy-wide average earnings to the year preceding retirement. Pension benefits are adjusted to changes in the consumer price index. For higher levels of the accordingly calculated average valorised net wages (above a pre-set level – HUF 372,000 (around EUR 1,200) there is a progressive reduction to be applied. (Only 90% of the incomes between HUF 372,000 and 421,000 (around EUR 1,350), and 80% of the monthly incomes above 421,000 have to be taken into account). For instance, if the average monthly income is HUF 500,000, the pensionable average income is HUF 479,300. (372.000*100%+((421,000-372,000)*90%+(500,000-421,000)*80%).
Source: OECD (2017a), Pensions at a glance 2017: Country Profiles – Hungary; Freudenbert et al, "A Long-Term Evaluation of Recent Hungarian Pension Reforms", MNB working papers, 2016.
The accruals system is non-linear and rates vary with the length of the contribution period. The accrued rights are front-loaded the first 10 years, before gradually falling the next 26 years, where after they rise again until retirement (Figure 1.3). For workers earning the average salary throughout their career, the accruals system leads to a replacement rate (the ratio of initial pensions to last earnings) of 92% of the last salary after a career of 46 years.
The front-loading of accrued rights aims to reward workers with shorter careers, typically low-income groups. However, the non-linearity of the rates makes it difficult for individuals to fully assess the optimal time to retire (Fall and Bloch, 2014) (Blöndal and Scarpetta, 1999). A constant accruals rate of around 2% would enable workers to better calculate their accrued replacement rate, and is likely to keep budget expenditures unchanged while leading to similar pension outcomes for full-career workers. Across the OECD, only Hungary, Greece, Spain and Luxembourg have accrual rates that vary with service time. In addition, a Pension Monitor system would enable individuals to keep track of their expected pensions. A pension monitor enables employees to calculate their expected pension by entering details about salary, length of service and expected year of retirement; it may also offer additional services to help individuals manage their future pensions. For instance, in the United Kingdom, the Pensions Regulator hosts a website where employers, employees, pension insurers and pension providers can obtain advice, including about voluntary pension schemes (The Pensions Regulator, 2018).
Figure 1.2. Using a moving average for valorisation would smooth fluctuations
Year-on-year percentage change in real wages
Figure 1.3. Non-linear benefit accrual rates lead to less predictable pension outcomes
As a percentage of earnings1
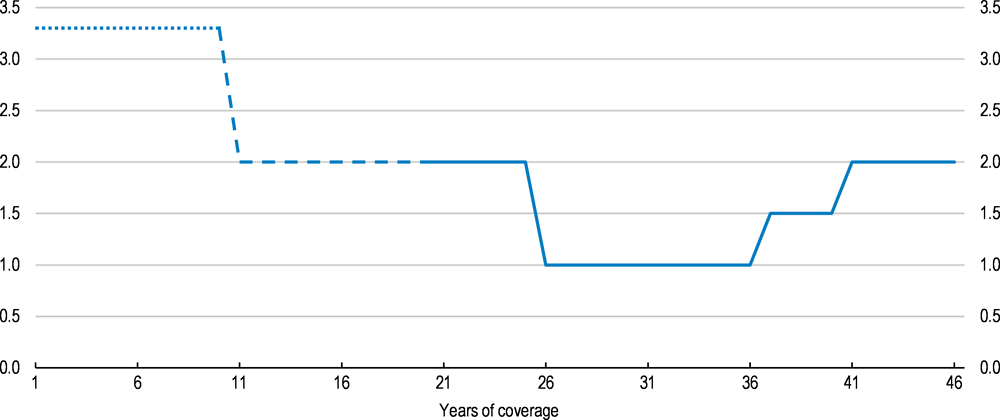
1. The earnings-related pension is calculated as 33% of average earnings for the first ten years of coverage. Each additional year of coverage adds 2% from year 11 to 25, 1% from year 26 to 36, 1.5% from year 37 to year 40 and 2% thereafter. 20 years of service is required for both the earnings-related pension and the minimum pension.
Source: OECD (2017), Pensions at a Glance 2017: Country Profiles - Hungary.
The increase in the accrual rates after 36 years aims to encourage workers to remain in the labour market. Moreover, there is a bonus pension increment of 0.5% for every month worked past the statutory retirement age without claiming the pension. After a year, the pension will therefore be increased by 6%, which is close to actuarial neutrality (OECD, 2017a) (Queisser and Whitehouse, 2006). This kind of pension bonus system is used elsewhere in the OECD (OECD, 2017a). However, public sector employees are not allowed to work beyond the statutory retirement age, for no clearly stated reasons. The rules should be applied evenly in the public and private sector although ending mandatory retirement altogether is not without controversy (OECD, 2017a). Employers in particular often argue that their businesses could not run as efficiently without it. Mandatory retirement is also a convenient mechanism for parting with unproductive workers. Ultimately, though, there is no reason why someone who still performs well be forcibly retired just because of age (OECD, 2017a). There are no data available on the number of people who defer pensions after retirement age (OECD, 2018a).
Other policy instruments are needed to flank the pension system in order to raise the effective retirement age, which is one of the fundamental requirement to ensure the long-term sustainability of the PAYG system, along with increasing the retirement age (Fall and Bloch, 2014). Increasing the employment rate of the above-55 also underpins the long-term projections in the EU’s Ageing Report, discussed below (Figure 1.4) (European Commission, 2017). The employment rate of workers aged 55-64 in Hungary is 52.7%, below the OECD average of 60.8%, although it rose by a third between 2011 and 2018 (OECD, 2018c).
Figure 1.4. Pensioners generally do not work after 65
In thousand persons, 20121
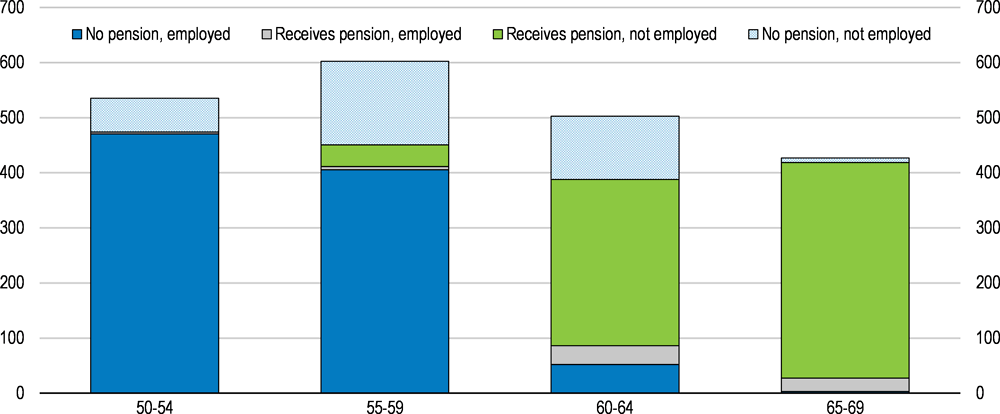
Note: Data refer to those persons who live in private households and who are either a) working at the time of the survey or b) not working at time of the survey but who did work after the age of 50.
Source: Eurostat (2018), "Transition from work to retirement", Eurostat Database.
Policies should focus on encouraging older workers to remain in the labour market until the pensionable age, and providing incentives to keep working beyond the pensionable age by deploying measures that promote the employment of older people, such as upgrading skills, providing appropriate help in finding jobs if unemployed, and encouraging employers to provide better suited working conditions and working-time arrangements (OECD , 2006), (OECD, 2016a) (OECD, 2018a). A recent survey shows that one-fifth of Hungarian pensioners would be willing to take a job provided employers offered flexible working conditions. More than half of those willing to work would take a part-time job, one quarter would work flexible hours, 10% would telework and only 10 % would take a full-time job (GKI, 2018). Current tax-incentives for employers who hire the long-term unemployed, women and older people could also be extended to the over-65s, especially in the SME sector (Zoltán, 2014) (OECD, 2016b) (Ministry of the National Economy, 2018) (Svraka, Szabó and Hudecz, 2014). From 2019, old-age pensioners who work will no longer pay social contribution taxes, only the personal income tax of 15%.
Other measures, such as phased retirement, with a partial withdrawal of pensions, might be beneficial for older workers as a way to smooth income and consumption. Some countries allow phased retirement, such as France (Box 1.2), but this is currently not possible in Hungary (OECD, 2016a) (OECD, 2018a). Past the statutory retirement age, it should also be possible to better combine pensions and work income. This is uncommon in the private sector, and in the public sector pension payments are suspended for people who continue to work past retirement age (OECD, 2017a).
Box 1.2. Flexible retirement schemes
An increasing number of workers surveyed in the EU would prefer to combine work and partial pension than to fully retire (Eurofound, 2016). Eleven countries currently allow this within the OECD: Austria, Belgium, Canada, the Czech Republic, Finland, France, Germany, Greece, Japan, Norway and the United States. If people make pension contributions for work while receiving an early-retirement benefit, pensions are either recalculated each year to reflect these new contributions, or once the pension is eventually claimed.
Limitations and eligibility criteria for combining work and receiving early pension vary widely across countries. In France, for instance, there are two different schemes allowing to combine work and retirement:
Progressive retirement (Retraite progressive), pre-retirement: Wage and pension can be combined starting from the legal age of retirement (62 for the generation born in 1955) or the age of 60 for those who have contributed at least 150 quarters. The insured reduces the number of working hours (40% to 80% of effective work) and receives the corresponding share of wage combined with a share of old-age pension. The insured keeps contributing and pensions are recalculated to reflect these new contributions.
Accumulating work and pension (Cumul emploi-retraite), post-retirement: Someone who has retired can work and combine wage and pension without limit if the full-rate retirement conditions are fulfilled (legal retirement age + number of years of contribution; or legal age without penalties). Wage and pension can be combined up to a certain limit if the insured does not meet those conditions. In either case, working retirees do not earn additional pension entitlements.
The French programme, introduced in 2003 and reformed in 2009 to improve access, has been successful. In 2016, 478 000 people, 3.4% of French pensioners, were working whilst receiving some pension benefits. It has also helped boost the employment rate of those aged 60-64 which nearly doubled to 29.2% between 2007 and 2017.
Source: (OECD, 2013) (OECD, 2017a) (Musiedlak and Senghor, 2017) (INSEE, 2018).
Most forms of early retirement have been abolished
Early retirement for men, regardless of occupation, is no longer possible. Retiring because of disability is now subject to strict assessment, and benefits are no longer classified as pension (OECD, 2017a) (OECD, 2018a). However, early retirement remains possible for women with at least 40 years’ of eligibility, including periods in paid work or in receipt of maternity benefits, known as Women 40 (OECD, 2017a) (OECD, 2018a). The scheme has been popular, with early data indicating that as many as 80% of entitled women have chosen to retire (Freudenberg, Berki and Reiff, 2016). The system is not actuarially fair, particularly as women live longer than men (Queisser and Whitehouse, 2006).
The retirement age should be the same for men and women, with the possibility of taking early retirement with pension decrements, provided the system remains actuarially neutral (OECD, 2017a). Indeed, closing down the option of retiring early might involve an excessive degree of compulsion (Blöndal and Scarpetta, 1999), although a minimum retirement age needs to be established to avoid misuse of the system. The actuarially neutral decrement would subtract around 6% of pension entitlements for each year prior to the statutory retirement age; keeping the current increments of 6% for retirees who keep working, including in the public sector.
Truncated careers reduce pension entitlements
The design of the Hungarian pension system means that those with reduced lifetime earnings, such as the unemployed, late entrants into the labour market and, to a lesser extent, women who take maternity leaves, have smaller pensions (Fall and Bloch, 2014) (OECD, 2017b). (Czeglédi et al., 2016) (Domonkos and Simonovits, 2016). The unemployed accrue pension rights from the unemployment benefits, but the unemployment benefit period is limited to 90 days, the shortest in the European Union (European Commission Staff Working Document, 2018) (Kosa, 2012). Thereafter, the unemployed may receive the so-called job-seeker aid if they are less than five years away from retirement, but it does not accrue pension rights (OECD, 2017a). Younger unemployed may receive means-tested benefits, but they do not accrue pension rights.
The negative impact of career breaks on pension entitlements is particularly strong in Hungary because of no other offsetting measures (OECD, 2017a) (OECD, 2017b). In a recent OECD-wide simulation of interrupted careers (late labour market entry and periods of unemployment lasting ten years), Hungary has the lowest pension outcome for individuals with career interruptions who face a shortfall of roughly 32% in pension benefits compared to the pay-out with a full career (Figure 1.5) (OECD, 2017b).
Figure 1.5. Workers with career interruptions have low pensions in Hungary1
Gross pension entitlements as a percentage of full-career entitlements, mandatory pensions only2
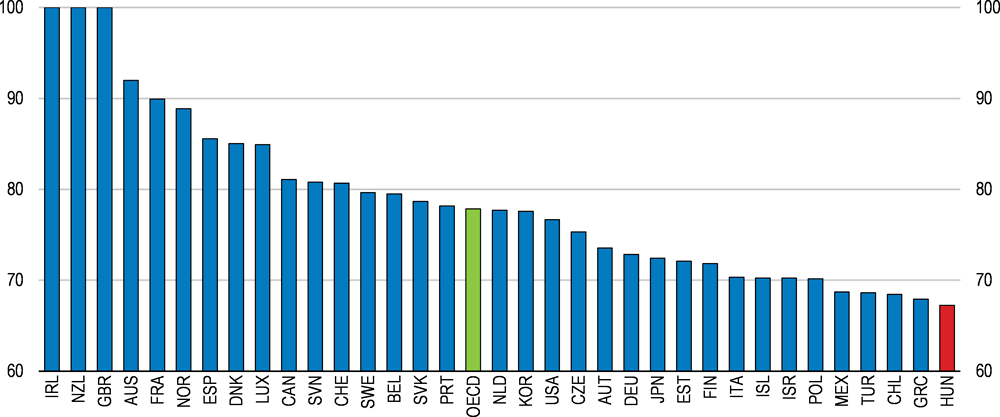
1. Pension entitlements are calculated for male average earners who enter the labour market at 25 years old (rather than the standard 20) and spend ten years unemployed between the ages of 35 and 45. What they would receive is measured against the OECD baseline pension, corresponding to a full career from the age of 20.
2. In Luxembourg and Slovenia labour-market latecomers with career gaps must work 5 years more than workers with unbroken careers to qualify for a full pension. The same figure is 4 years for France and 2 years for Germany and Spain.
Source: OECD (2017), Preventing Ageing Unequally, OECD Publishing, Paris.
Working women also face career interruptions if they have children. The gender gap in pensions has been comparatively low as women had similar participation rates as men prior to transition away from Communism (Figure 1.6). At present, the labour market participation rate (15-64 years) is 63.5% for women and 77% for men (European Commission, 2017). On average, men’s benefits are around 15% higher than that of women (including widows’ survivor pensions), and women face a higher risk of old-age poverty (European Commission, 2017) (Freudenberg, Berki and Reiff, 2016) (OECD, 2017a) (OECD, 2017c). Some of this may be caused by long maternity leaves, which can last up to three years per child (OECD, 2016b). Pension entitlements are accrued from maternity benefits, which in the third year falls to EUR 90 a month (OECD, 2017a).
Although women are allowed to work while receiving maternity benefits after six months, the lack of adequate childcare facilities means that many choose to stay at home (OECD, 2016b). This leads to lower accrued pension benefits over time (Ministry of the National Economy, 2018) (OECD, 2017c). However, new family tax allowance rules in place since January 2018 increase post-tax earnings of women after maternity, leading to better pension outcomes relative to men with the same initial wage career, provided the tax-benefit is used by the woman (for a couple, either spouse may use the deduction). To avoid eroding the tax base and to remain more actuarially fair, family allowances should be wholly cash-based.
Figure 1.6. Gender gap in pensions is relatively low
In per cent, 65+ year-olds, 2014 or latest available1
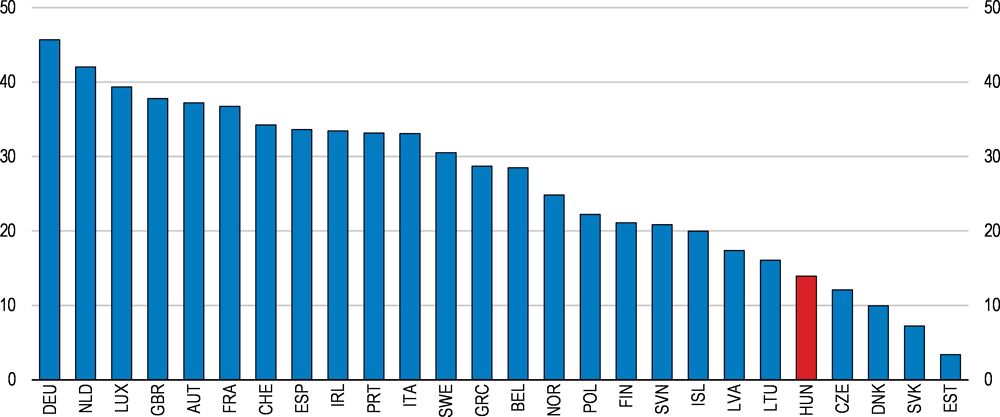
1. 2013 for Austria, Denmark, Greece, Finland, Hungary, Iceland, Latvia, the Netherlands, Norway, Slovenia and Spain. The gender gap in pensions is defined as: (1 - (women's average pension/men's average pension)) *100). 'Pensions' include public pensions, private pensions, survivor's benefits and disability benefits. The gender gap in pensions is calculated for people aged 65 and older.
Source: OECD (2017), The Pursuit of Gender Equality: An Uphill Battle, OECD Publishing, Paris.
Despite the family allowance, long maternity absences combined with the Women 40 scheme that also shortens the contributory career may eventually lead to a widening of the gender gap in pensions unless corrective action is taken. Measures should be taken to shorten the maternity leave to durations seen in other European countries (around 12 months), while taking steps to improve the work-life balance for women, such as offering adequate childcare pre-kindergarten (OECD, 2016b) (OECD, 2017c).
The earnings related pension system implies that truncated careers and low wages lead to relatively low pensions. OECD calculations show that the accrued pension, as a share of average incomes, for low-income earners and those with career interruptions are very low. For both groups, pensions are below 50% of average earnings by the time they reach retirement (Figure 1.7). A single mother with two children earning the minimum wage will benefit from the new income tax allowance, but even so her accrued pension will still be low compared to average earnings. An additional concern is that in retirement these low‑income earners rapidly fall into old-age poverty (see below). On the other hand, the system implies that those with a wage career may earn pensions well in excess of average wages by the time they retire.
Figure 1.7. Theoretical accrued monthly pension benefits
As a percentage of average monthly net salary1
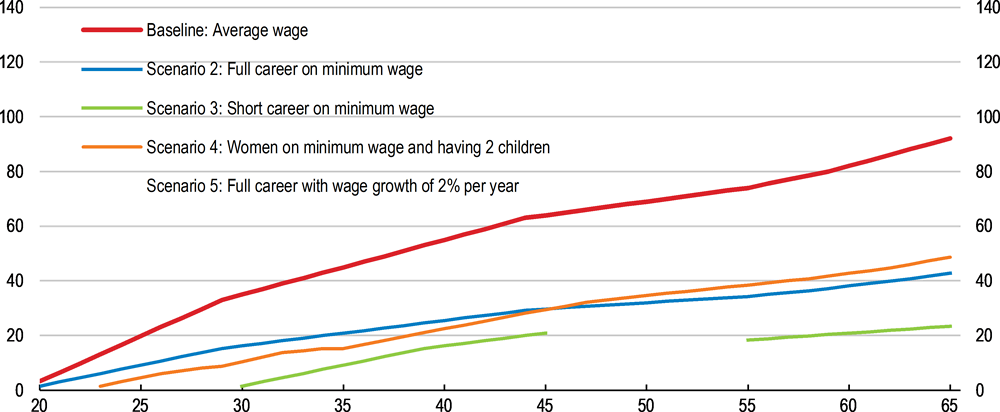
1. Average net monthly earnings of full-time employees was HUF 197 516 in 2017. The baseline scenario assumes average wage for a career of 46 years from age 20. Scenario 2 assumes minimum wage for a career of 46 years. Scenario 3 assumes earning the minimum wage for a short career of 27 years, with a late entry to the labour market and ten years spent in unemployment. Scenario 4 assumes women having 2 children (with 3 years absence from the labour market after each birth) and earning the minimum wage for a career of 37 years. Scenario 5 assumes a full career with wage growth of 2% per year for 43 years, starting from average wage level, with later entry into the labour market, reflecting time spent in education.
Source: OECD calculations based on data from Hungarian Central Statistical Office.
Old-age poverty is a concern
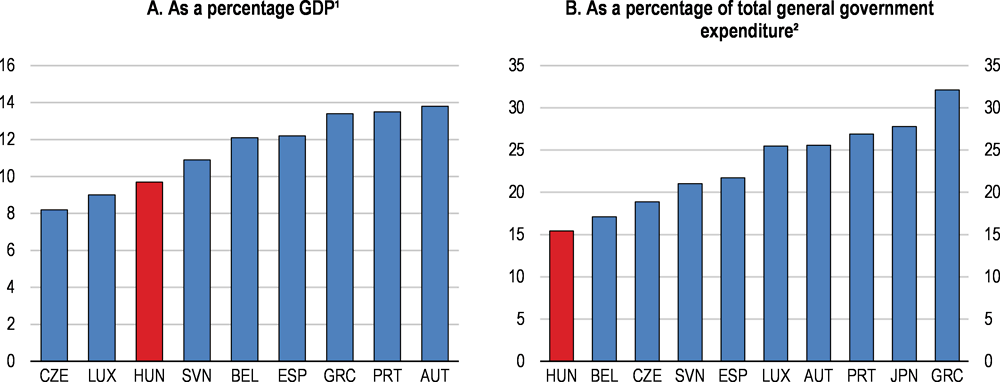
Currently, roughly 20% of pensioners receive pension benefits that are below the relative poverty threshold of HUF 77 500 a month (EUR 240; defined as half of the median wage). Even with additional in-kind benefits, 16.8% of the over-65s live in poverty or social exclusion (Hungarian Central Statistical Office, 2016). This is above the OECD average of 12.6% of all individuals over 65 who live in relative income poverty (Figure 1.8, Panels A and B) (Ministry of the National Economy, 2018) (OECD, 2015a). It results from several factors: many current pensioners retired with career interruptions caused by to the economic transition in the 1990s and subsequent economic crises, leading to low pension entitlements. In addition, workers with late labour market entry due to university studies or difficulty in finding a first job, and workers with career breaks accumulate lower pensions (OECD, 2017d). As a result, public expenditure on pensions is relatively low in comparison with countries with similar systems (Figure 1.9, Panels A and B). The average pension is HUF 129 637 (EUR 400). Approximately 66 000 old-age pensioners are not entitled to a pension. Moreover, 6 958 pensioners received social benefits because their income fell below the required minima in 2016. Low-income pensioners also have shorter life expectancies (Czeglédi et al., 2016).
Figure 1.8. The majority of pensioners receive pensions below average net wages
January 20181
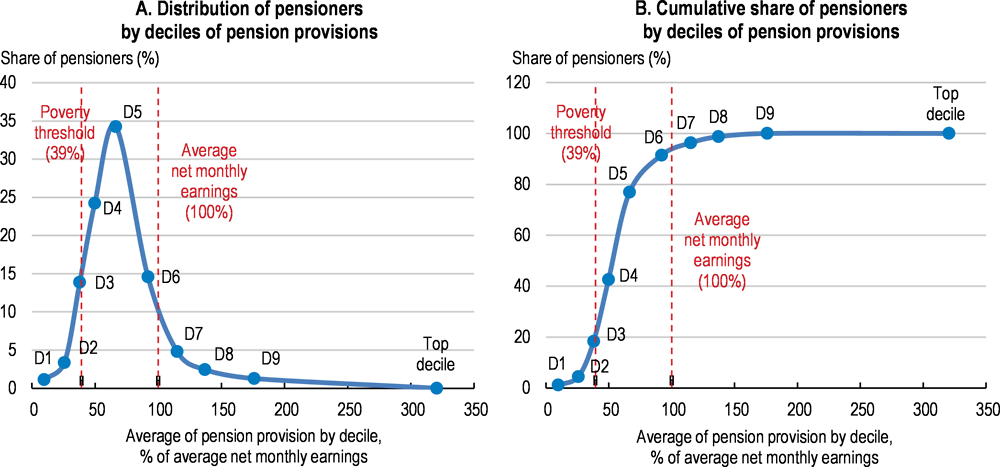
1. Average net monthly earnings of full-time employees was HUF 197 516 in 2017. Panel A shows the distribution which indicates that just over 60% of all pensioners receive pensions that are below average net monthly earnings, with the largest share receiving around 75% of average earnings. Panel B sums the deciles.
Source: OECD calculations.
Figure 1.9. Public spending on pensions is relatively low
2016
1. The depicted countries all have mainly or solely a public defined benefit pension system.
2. Excludes early retirement benefits.
Source: European Commission (2018) 2018 Aging Report; OECD (2018), OECD National Accounts Statistics (database).
The current pension design replicates wage inequalities
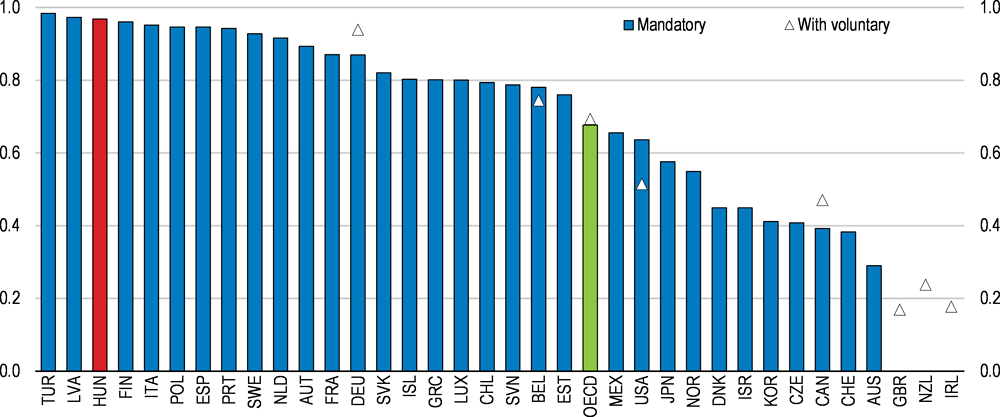
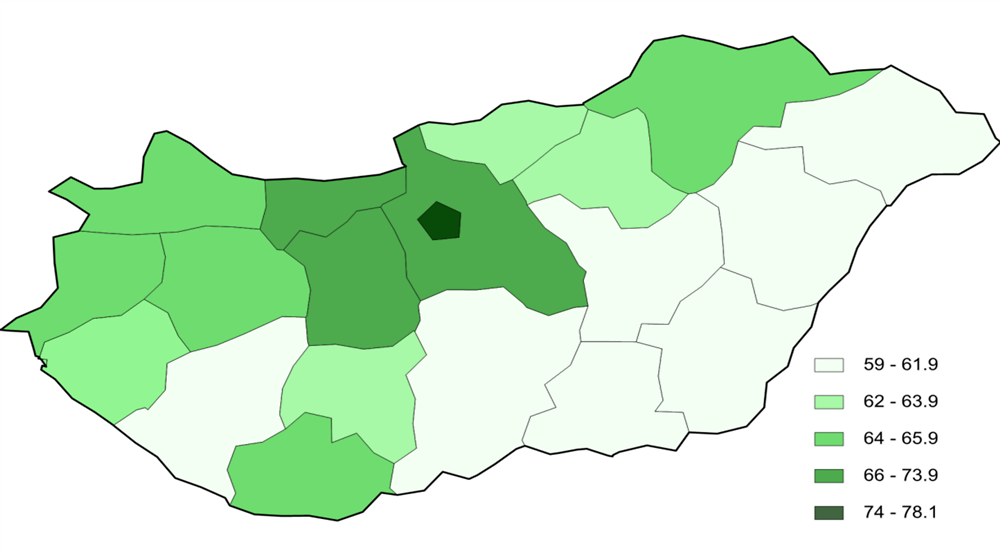
Because there is no universal or basic state pension, contrary to most public pension systems in the European Union, the pass-through of wage inequality in Hungary is higher than on average in the OECD (OECD, 2017b) (European Commission, 2018b). The average relative position of new pensioners in the overall pension income distribution is thus maintained after retirement. More than 85% of an increase in wage inequality is passed through into pensions, because of the low social safety net and absence of basic state pension (Figure 1.10) (European Commission, 2018b) (OECD, 2017b). This also translates into regional disparities in pension incomes, reflecting lifetime incomes (Figure 1.11) (see also Chapter 2).
Figure 1.10. Wage inequality leads to pension inequality
Percentage point change in the Gini index of pensions for a 1 percentage point increase in the Gini index of wages, full career case1
1. Data refer to gross (i.e. pre-tax) wages and pension benefits.
Source: OECD (2017), Preventing Ageing Unequally, OECD Publishing, Paris.
Price indexation contributes to old-age poverty
Other factors contributing to old-age poverty include the price-indexation rule which entails that the value of benefits will decline relative to wages over time (OECD, 2015a). The problem materialises quite fast owing to the low initial pensions for many wage earners. For instance, pensioners retiring at 65 after earning the minimum wage all their life will have an initial pension of less than 50% of average wages, and will fall into relative poverty before the age of 70, while a working mother with two children will fall into poverty ten years into retirement (Figure 1.12). To stay out of relative poverty, a worker needs to have had a full career without interruptions, and with wages close to the national average, in order to have accumulated a sufficiently large initial pension by the time they reach the statutory retirement age.
Figure 1.11. Regional distribution of pensions reflects regional income disparities
Average of full pension provision by county, as a percentage of net monthly earnings, January 20181
1. Average net monthly earnings of full-time employees was HUF 197 516 in 2017.
Source: Ministry of Human Capacities.
Figure 1.12. Low-wage earners fall into poverty within 5-10 years of retiring
As a percentage of average monthly net salary¹
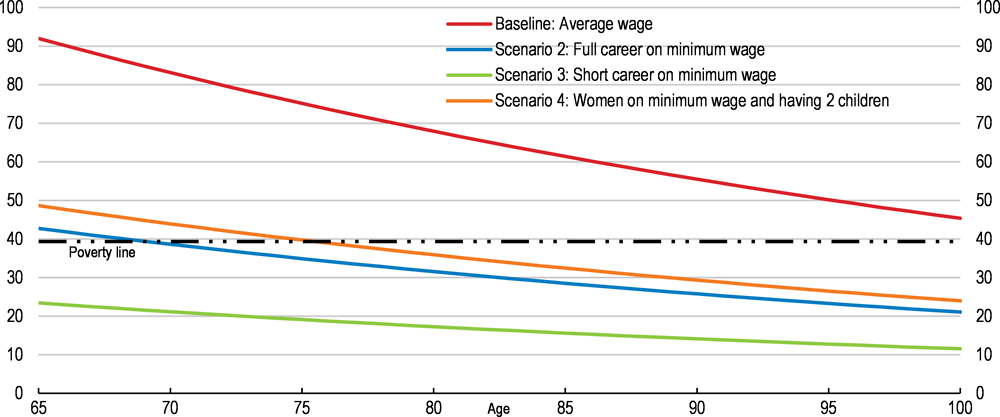
1. Average net monthly earnings of full-time employees was HUF 197 516 in 2017. The baseline scenario assumes average wage for a career of 46 years from age 20. Scenario 2 assumes minimum wage for a career of 46 years. Scenario 3 assumes minimum wage for a short career of 27 years. Scenario 4 assumes women having 2 children (with 3 years absence from the labour market after each birth) and earning minimum wage for a career of 37 years.
Source: OECD calculations based on data from Hungarian Central Statistical Office.
Old-age poverty can be mitigated with a basic state pension
To alleviate old-age poverty and mitigate the pass-through effects from the earnings-related system, a basic state pension could be implemented for everyone who reaches retirement age. This would also include current recipients of the social safety-net benefits, as is the case for instance in the Nordic countries (OECD, 2015a). Countries with a basic state pension have fewer poor old-age pensioners (OECD, 2017d).
To assess the potential cost of a basic pension, OECD analysed three scenarios:
Extending the current minimum pension of HUF 28 500 to all current pensioners, regardless of accrued entitlements. The cost is negligible (at 0.01% of GDP), affecting roughly 18 500 people.
Doubling the minimum pension amount to HUF 57 000 for all current recipients who receive below this amount. This would cost 0.04% of GDP, affecting 67 300 people.
Providing a basic pension equivalent to the current relative poverty level of HUF 77 500, helping 218 500 people and costing around 0.15% of GDP, compared to total public expenditure on pensions which stands at 9.7% of GDP (European Commission, 2018c).
A basic pension could potentially be financed through a ceiling on pension benefits. For example, based on data on the distribution of current pension benefits, a ceiling on today’s pensions equivalent to 150% of average economy-wide net earnings (roughly EUR 910) would fully fund proposal (2), a basic state pension of HUF 57 000. However, the same ceiling would only fund one-third of the cost of a higher state pension set at the relative poverty line. Currently 19 OECD countries impose a cap on pension benefits, with an average ceiling at 184% of average economy-wide earnings (OECD, 2015a). Voluntary pension schemes allow for topping up pensions (see last section). A cap on the highest pensions could be matched by a cap on contributions for actuarial fairness, as is the case in several OECD countries such as Slovakia or Canada for instance (OECD, 2017a), but the present calculations do not include this aspect.
Offering a state pension may adversely affect the labour market by eroding incentives to work and contribute, given how long it would take to accrue the same amount of pension from working. In the current system, to earn equivalent pension entitlements as in proposal (2) (HUF 57 000), a worker on the minimum wage would have to work for 25 years. Nonetheless, the mandatory pension scheme would still allow them to accrue at least one‑third more in benefits by working a full career under current rules. To be fully poverty‑alleviating, the basic state pension may be additional to the normal pension accrual, in which case the labour market distortions would be less important while the fiscal costs would be considerably higher.
Demographic trends will put pressure on public spending on pensions
The population is ageing and shrinking
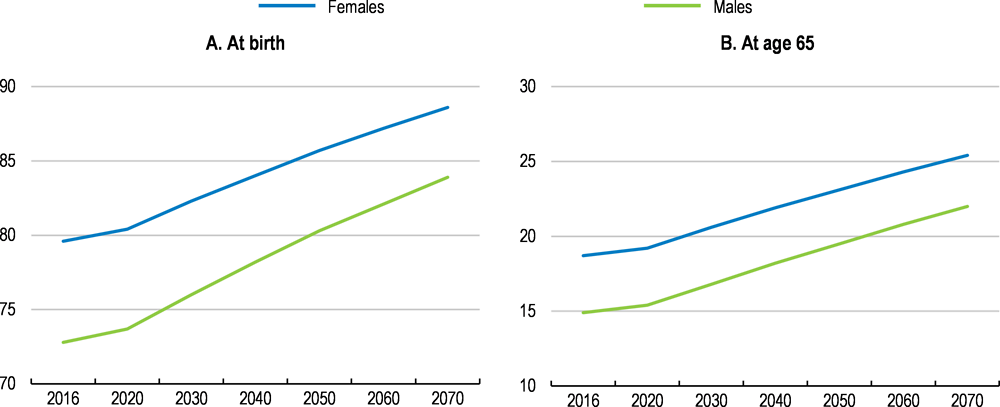
Demographic developments will put pressure on the PAYG system. The population is ageing and shrinking, eroding the contribution base, while life expectancy is presumed to increase by 10 years by 2070 (Table 1.2) (European Commission, 2018b). There are two waves of ageing with the first large post-war generation currently entering retirement and another wave starting after 2030, leading to a doubling of the old-age dependency ratio to 52% over the next 50 years, partly caused by a drop in the working-age population of 11.1% (Figure 1.13, Panel A and Panel B) (Figure 1.14) (European Commission, 2018b).
Table 1.2. Main underlying assumptions for the long-term pension projections
|
|
2016 |
2030 |
2050 |
2070 |
|---|---|---|---|---|
|
Demographic projections |
||||
|
Population (million) |
9.8 |
9.7 |
9.3 |
8.9 |
|
Prime age population (25-54) as % of total |
41.9 |
38.8 |
34.1 |
34.0 |
|
Elderly population (65 and over) as % of total |
18.5 |
22.2 |
28.2 |
29.1 |
|
Old-age dependency ratio (20-64)1 |
29.8 |
38.2 |
53.7 |
57.3 |
|
Macroeconomic assumptions |
||||
|
Potential GDP (growth rate) |
1.9 |
2.1 |
1.5 |
1.3 |
|
Employment (growth rate) |
1.7 |
-0.2 |
-0.5 |
-0.2 |
|
TFP (growth rate) |
0.7 |
1.5 |
1.3 |
1.0 |
|
Labour force assumptions |
||||
|
Labour force (20-64) (thousands) |
4 587 |
4 677 |
4 053 |
3 760 |
|
Participation rate females (20-64) |
68.0 |
78.5 |
78.5 |
78.6 |
|
Average effective exit age (total)2 |
61.7 |
65.1 |
65.1 |
65.1 |
|
Employment rate (20-64) |
71.6 |
79.3 |
79.3 |
79.4 |
1. Old-age dependency ratio=Population aged 65 and over as % of the population aged 15-64 or 20-64.
2. Based on EC calculations of the average probability of labour force entry and exit observed. The table reports the value for 2017.
Source: European Commission (2017), The 2018 Ageing Report, Underlying Assumptions and Projection Methodologies, Institutional Paper 065, November 2017.
Figure 1.13. Life expectancy is rising, including for pensioners
In years
Source: European Commission (2018), "The 2018 Ageing Report - Economic & Budgetary Projections for the 28 EU Member States (2016-2070)", Directorate-General for Economic and Financial Affairs, Institutional Paper 079, May, Luxembourg.
Ageing-related spending is estimated by the EU commission to decrease by 1.3 percentage points of GDP until 2030, and then to increase by 2.8 percentage points of GDP between 2030 and 2070 (Table 1.3) (European Commission, 2018b). The initial decline in pension spending hinges on a somewhat optimistic assumption that the effective and statutory retirement ages will become fully aligned by 2025 (Figure 1.15). If this fails to materialise, ageing-related cost‑increases may be even higher. Other factors which may increase spending would include changing the indexation of benefits to mitigate old-age poverty, provided this is implemented, and the cost of the Women 40 scheme. Pension contributions, meanwhile, are projected to fall over time, leading to a deterioration in the balance between projected spending on pensions and projected contributions of 2.7% of GDP by 2070 (Table 1.3).
Figure 1.14. The active population will be shrinking, while the share of pensioners will increase
As a percentage of total population by gender1
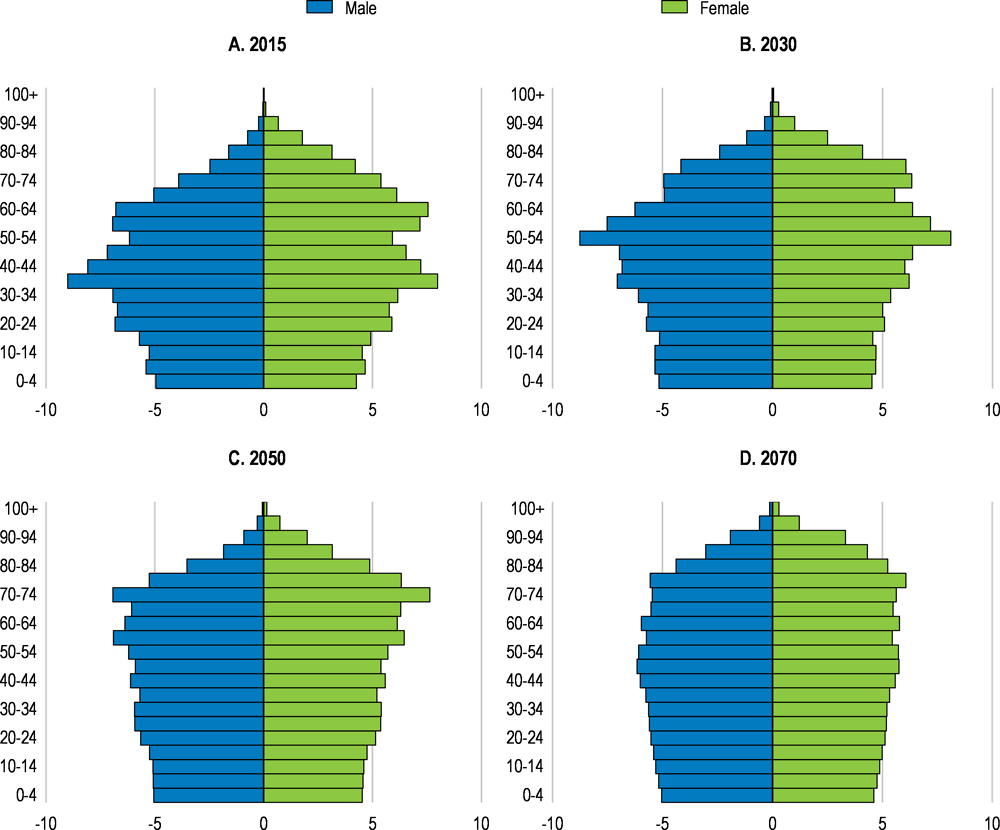
1. Data refer to baseline projections.
Source: Eurostat (2017), "Population on 1st January by age, sex and type of projection", Eurostat Database.
Table 1.3. Main policy scenarios and projections
% of GDP unless otherwise indicated.
|
|
Avg ch 16-70 |
2016 |
2020 |
2025 |
2030 |
2035 |
2040 |
2045 |
2050 |
2055 |
2060 |
2065 |
2070 |
|---|---|---|---|---|---|---|---|---|---|---|---|---|---|
|
Potential Real GDP (growth rate) |
1.6 |
1.9 |
1.9 |
2.4 |
2.1 |
1.6 |
1.2 |
1.3 |
1.5 |
1.3 |
1.3 |
1.4 |
1.3 |
|
Average effective exit age (Total) |
3.3 |
61.7 |
62.8 |
65.1 |
65.1 |
65.1 |
65.1 |
65.1 |
65.1 |
65.1 |
65.1 |
65.1 |
65.1 |
|
Average effective exit age (Women) |
3.8 |
61.0 |
62.4 |
64.8 |
64.8 |
64.8 |
64.8 |
64.8 |
64.8 |
64.8 |
64.8 |
64.8 |
64.8 |
|
|
|
|
|
|
|
|
|
|
|
|
|
|
|
|
Public pensions, gross as % of GDP |
1.5 |
9.7 |
9.0 |
8.7 |
8.4 |
8.6 |
9.4 |
10.3 |
10.6 |
10.8 |
11.1 |
11.2 |
11.2 |
|
Public pensions, contributions as % of GDP |
-1.0 |
9.4 |
8.3 |
8.5 |
8.5 |
8.5 |
8.5 |
8.5 |
8.4 |
8.4 |
8.4 |
8.4 |
8.5 |
|
Gross replacement rate at retirement % (Old-age earnings-related pensions) |
3.7 |
45.5 |
46.1 |
46.0 |
47.6 |
48.3 |
49.3 |
48.4 |
48.9 |
48.7 |
48.6 |
49.2 |
49.2 |
|
Benefit ratio |
-7.7 |
40.4 |
37.1 |
34.8 |
32.8 |
31.8 |
32.0 |
32.6 |
32.3 |
32.0 |
32.0 |
32.3 |
32.7 |
|
Average contributory period, years (new pensions, earnings-related) |
4.7 |
32.8 |
34.5 |
35.0 |
37.2 |
37.6 |
37.8 |
37.1 |
37.4 |
37.4 |
37.6 |
37.9 |
37.5 |
|
Scenarios that differ from the baseline (evolution of public pensions, gross as % of GDP)
|
|||||||||||||
|
High life expectancy (+2 years) unchanged retirement age |
2.1 |
9.7 |
9.0 |
8.7 |
8.5 |
8.7 |
9.6 |
10.6 |
10.9 |
11.2 |
11.6 |
11.7 |
11.8 |
|
Lower fertility (-20%) |
3.4 |
9.7 |
9.0 |
8.7 |
8.4 |
8.6 |
9.5 |
10.6 |
11.1 |
11.6 |
12.2 |
12.7 |
13.1 |
|
Higher TFP growth (+0.4 p.p.) |
0.6 |
9.7 |
9.0 |
8.7 |
8.4 |
8.5 |
9.1 |
9.9 |
10.0 |
10.1 |
10.3 |
10.3 |
10.3 |
|
Lower TFP growth (-0.4 p.p.) |
2.6 |
9.7 |
9.0 |
8.7 |
8.4 |
8.7 |
9.7 |
10.8 |
11.3 |
11.7 |
12.1 |
12.3 |
12.3 |
|
Policy scenario linking retirement age to increases in life expectancy |
-0.1 |
9.7 |
9.0 |
8.7 |
8.2 |
8.4 |
8.7 |
9.4 |
9.8 |
9.7 |
9.7 |
9.6 |
9.6 |
Source: European Union, Ageing Report 2018, cross-country tables, AWG data base.
Figure 1.15. The old-age dependency ratio is rising and will peak in 20601
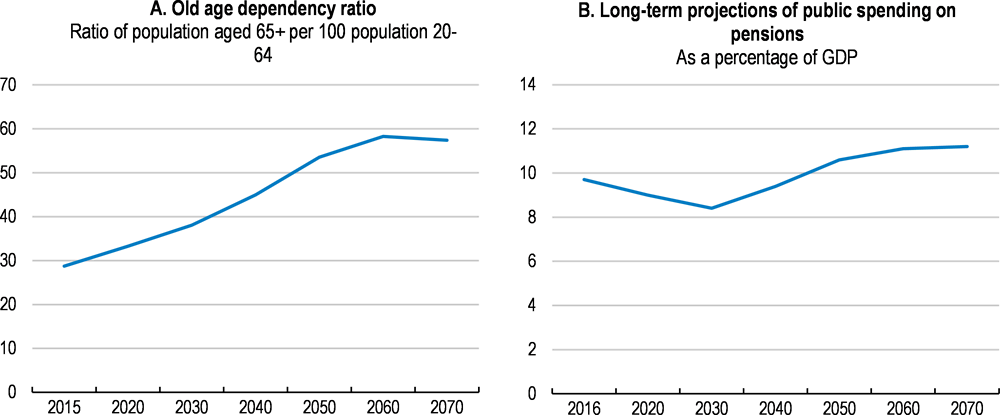
1. Data are based on the technical assumptions by the EU AWG, i.e. convergence towards the EU mean.
Source: Eurostat (2017), "Population on 1st January by age, sex and type of projection", Eurostat Database; and Ministry for National Economy (2018), "Magyarország konvergencia programja 2018-2022".
Benefit ratios will keep falling, increasing the risk of poverty
Benefit ratios (pension benefits as a share of wages) are projected to decrease by 7.7 percentage points to 32.7% (Table 1.4), because of the spread between wage growth and consumer price inflation, although the drop is less steep than in Poland or in Slovakia. Falling benefit ratios increase the risk of older pensioners lacking sufficient incomes relative to wage earners, which will be exacerbated in periods of higher wage growth (Simonovits, 2014). Moreover, the EU’s Ageing Report’s main underlying assumption is income convergence towards the European mean. However, increased productivity growth, which is a pre-requisite for income convergence, would in fact widen the wedge between replacement rates and benefit ratios (European Commission, 2017).
Table 1.4. Benefit ratios and replacement rates in Europe
Public pensions: earnings-related
|
Benefit ratios |
Replacement rates |
|||
|---|---|---|---|---|
|
2016 |
2070 |
2016 |
2070 |
|
|
Czech Republic |
39.9 |
37.6 |
43.1 |
41.1 |
|
Hungary |
40.5 |
32.7 |
45.5 |
49.2 |
|
Poland |
52.3 |
21.6 |
61.4 |
23.0 |
|
Slovenia |
34.1 |
33.3 |
34.7 |
35.7 |
|
Slovakia |
44.8 |
33.5 |
49.0 |
50.2 |
|
EU27³ |
45.2 |
33.2 |
46.3 |
38.1 |
|
EA³ |
48.5 |
35.8 |
49.9 |
41.2 |
1. The ‘Benefit ratio’ is the average benefit of pensions as a share of the economy-wide average wage.
2. Baseline scenario. The ‘Replacement rate’ is calculated as the average first pension as a share of the average wage at retirement; to allow comparisons, the figure reported here includes only earnings-related public pensions.
3. EU, EEA: Unweighted average, EU 27 excludes the United Kingdom.
Source: European Commission (2018), The Ageing Report 2018, Economic and budgetary projections for the 27 EU Member States (2016-2070), 6/2018, Brussels.
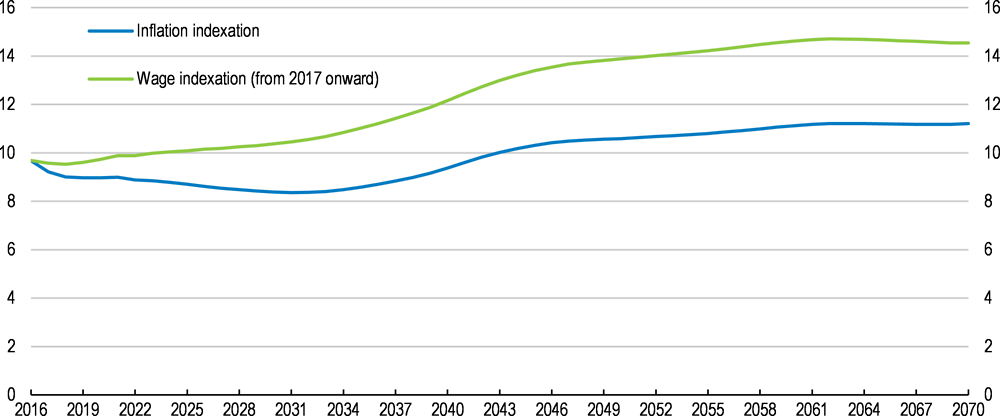
A number of OECD countries maintain benefit ratios by linking pensions to wage-growth, or to a weighted index between wages and prices, rather than to CPI. OECD calculations indicate that full wage-indexation would add 3 percentage points of GDP to public pension spending to the projected increase in the Ageing Report (Figure 1.16) (European Commission, 2018b) (Ministry of the National Economy, 2018). To reduce the budgetary cost, the indexation could use an even share of price and wage developments which would slow the erosion of the benefit ratio, but would nonetheless increase public spending on pensions.
Figure 1.16. Difference in cost between indexing pension benefits to wages and to inflation
Public pension expenditure, as a percentage of GDP
Source: OECD calculations based on European Commission (2018), "The 2018 Ageing Report - Economic & Budgetary Projections for the 28 EU Member States (2016-2070)", Directorate-General for Economic and Financial Affairs, Institutional Paper 079, Luxembourg.
The Women 40 scheme will widen the financing gap
The Women 40 scheme will further increase pressure on the PAYG scheme. The longer retirement period for women and the absence of any pension deduction increase expenditures without a concomitant reduction in benefits (Freudenberg, Berki and Reiff, 2016). Moreover, the average age of female retirees is still below that of males, while the assumptions in the EU Ageing Report are based on a projected exit age of 65.1 for both men and women (Table 1.4) (European Commission, 2017). However, if 80% of women continue to retire after 40 years of working, the amount of social contributions could be reduced by around 0.6% of GDP, according to OECD calculations, widening the funding gap more than currently assumed. As such, the Women 40 scheme should be abolished in favour of having the same retirement age for men and women, boosting the contribution base and improve actuarial fairness.
Table 1.5. The effective retirement age is going up, but remains lower for women
Average age at awarding of the benefit.
|
Old-age pension |
Women with 40 years’ service |
|||
|---|---|---|---|---|
|
Year of retirement |
male |
female |
female |
|
|
2012 |
62.7 |
59.2 |
57.8 |
|
|
2013 |
62.3 |
59.6 |
58.0 |
|
|
2014 |
62.9 |
59.6 |
58.3 |
|
|
2015 |
62.8 |
60.0 |
58.7 |
|
|
2016 |
63.1 |
61.0 |
59.0 |
|
Source: Central Administration of National Pension Insurance: Statistical yearbook 2015, 2014 and Statistical pocketbook 2016.
Financing the spending increases
Altogether, the pension funding gap may be higher than currently assumed by almost 4% of GDP, if measures to mitigate poverty and the effect of the Women 40 are included. Other deviations from the baseline will also increase spending above current projections, including lower fertility, or lower growth than currently assumed (Table 1.6). Within the existing pension system, three parameters can be activated to finance some of the projected increases in pension spending without any other offsetting measures: increasing the pension age; lowering pension benefits through a lowering of accrual rights, or through pre-funding in the form of a buffer fund.
Table 1.6. Risks to projected public pension expenditure
Increases in public pension expenditure above baseline scenario in 2070, % of GDP, unless stated otherwise
|
Changes to the baseline scenario |
Avg change 16-701 |
20702 |
|---|---|---|
|
Higher life expectancy than projected (+2 years), unchanged retirement age |
2. |
10.6 |
|
Lower fertility by -20% |
3.4 |
1.9 |
|
Lower TFP growth (-0.4 p.p.) |
2.6 |
1 |
|
Indexing pension benefits to inflation |
4.5 |
3.0 |
|
Women 40 (reduction in contributions) |
- |
0.6-0.8 |
1. Total estimated change in public expenditure from 2016 to 2070, in % of GDP. 2. Increase in public expenditure above the baseline.
Source: European Union, Ageing Report 2018.
Raising the statutory pension age by linking it to life expectancy once the current pension reform (which raises the retirement age to 65 by 2022) has been completed, would keep spending broadly constant as a share of GDP over time, compared with the baseline scenario, but would still leave a funding gap (Table 1.5) (European Commission, 2017). An additional effect of longer work lives would be to increase contributions. For example, OECD calculations find that raising the number of contributory years by five years would increase total contributions by 1.1% of GDP, sufficient to cover the remaining funding gap (Table 1.17).
Funding the increase in projected spending can also be achieved by lowering replacement rates. To cover the financing gap, the average replacement rate would have to be lowered (through reductions in accrual rights) by some 8 percentage points. However, this would further exacerbate the risk of old-age poverty.
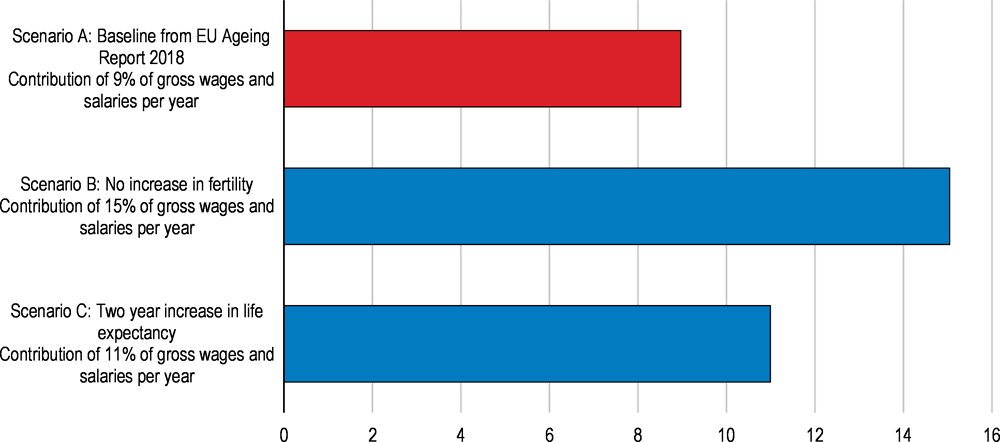
Pre-funding of pensions is also an option. OECD calculations based on the assumptions of having to plug a funding gap of 2.7% of GDP by 2070 (from the EU Ageing Report projections) show that the creation of a pension savings or “buffer” fund with a mandatory contribution rate of 9% of wages and salaries would fully cover the projected gap between pension spending and contributions by 2070. This would raise the current contribution rate by 30%, more or less matching reductions in the social security contributions since 2016 (Figure 1.17 and 1.18, baseline scenario). More optimistic demographic assumptions, such as a gradual two-year increase in life expectancy, leads to a higher contribution rate if there is no adjustment in the pension system’s parameters, as people remain in retirement for longer. On the other hand, if the expected increase in fertility fails to materialise then pre-funding could require an almost doubling of the contribution rate to make up for a smaller contribution base (Figure 1.17, Panels B and C).
Figure 1.17. Pre-funding future pension spending requires higher contributions
Calculations showing required savings to meet projected pension spending needs in 2070
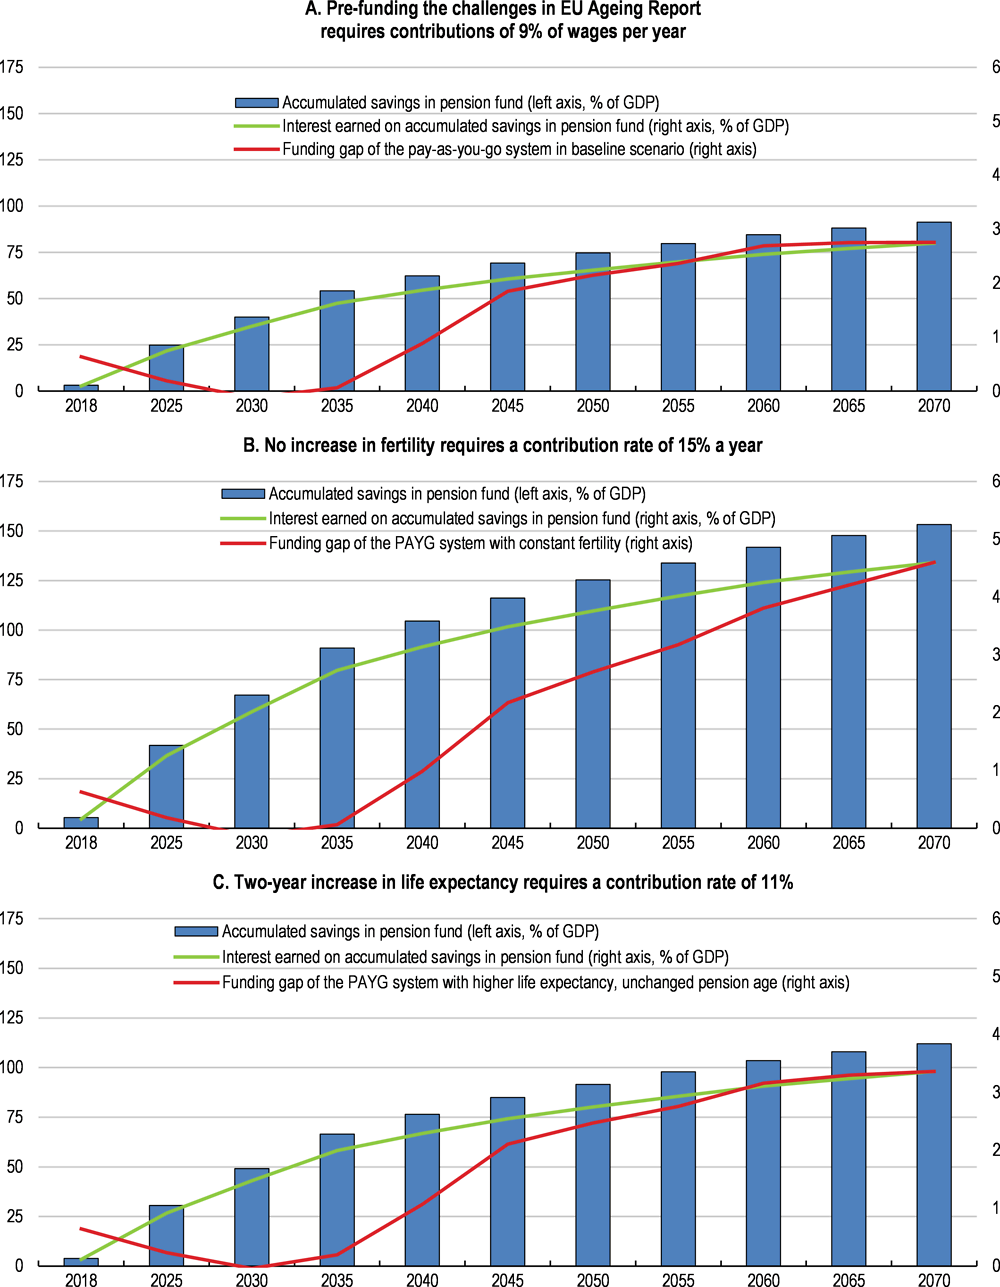
Note: The figure shows a model calculating how much would need to be saved into a savings-fund to be able to pre-fund the gap between contributions and pension spending by 2070. The model aims to demonstrate the required magnitude of contributions in order for the interest earned on the accumulated savings to be sufficient to pay the cost of future pensions. Scenarios are taken from the EU Ageing Report 2018. The calculations are based on the following assumptions: contributions into the savings fund start in 2018; the accumulated savings are multiplied with the interest rate of 3.5% every year; an annual pay-out to pensioners of 3% of the accumulated savings is applied from 2035 onwards. The funding gap refers to the projected shortfall in pension contributions relative to pension spending in 2070 in the PAYG system, as per EU Ageing Report Projections.
Source: OECD calculations based on European Commission (2018), "The 2018 Ageing Report - Economic & Budgetary Projections for the 28 EU Member States (2016-2070)", Directorate-General for Economic and Financial Affairs, Institutional Paper 079, Luxembourg.
Figure 1.18. Potential pension contributions to a pre-funded buffer fund match recent reductions
As a percentage of gross wages and salaries¹
Source: OECD calculations based on from European Commission (2018), "The 2018 Ageing Report - Economic & Budgetary Projections for the 28 EU Member States (2016-2070)", Directorate-General for Economic and Financial Affairs, Institutional Paper 079, Luxembourg.
With full mandatory enrolment, the first option with additional contributions of 9% of gross wages, would effectively slightly more than reverse the recent reductions in social security contributions (European Commission, 2018a) (Ministry of the National Economy, 2018). Opting instead for auto-enrolment typically sees 60-80% coverage, based on the experience in countries such as the UK. Creating a pension buffer fund to pre-fund future pension liabilities will benefit future retirees, but at the expense of current workers who will pay more tax. Creating a pension fund would finance new entitlements and ensure that the PAYG system remains sustainable in the long term. However, a pension buffer fund cannot finance past entitlements. Moreover, it would erode wage competitiveness by raising current contributions.
Voluntary savings can boost pension benefits
Overall pension benefit adequacy can be supported by an effective voluntary or mandatory private savings scheme to increase old-age income. For instance, Australia, Denmark, Iceland and Norway have highly targeted programmes, using mandatory private pension provisions to top up public pensions, while Belgium, Canada, Germany, Ireland, New Zealand, the United Kingdom and the United States have the best pension coverage provided by voluntary schemes (OECD, 2017a).
The third pillar of voluntary pension savings has a comparatively low take-up. Assets in all retirement vehicles represent 5.9% of GDP, and 4.3% of GDP for the state-backed pension fund, the lowest share in the OECD (OECD, 2018d). At present, the third pillar system provides three options for savings: a state-backed voluntary pension fund; a pre-pension savings scheme entirely invested in securities; or pension insurance (portfolio investment, which pays out an annuity upon retirement, typically indexed to life expectancy). In total, some 1.7 million Hungarians have some form of voluntary pension savings, with the state-backed voluntary scheme taking the lion’s share with 1.1 million accounts in 2017.
The schemes used to be attractive as the employer’s contributions to their employees’ voluntary savings were tax exempt. Since 2009, ever-changing rules have made the schemes less attractive, and at present, the total tax burden on contributions is 40.71%, which is payable by the employer. This has substantially reduced employers’ contributions.
All three schemes qualify for tax-benefits for employees, equivalent to a 20% refund of income tax paid into the pension account up to a limit. The tax refund ceiling is HUF 130,000/year (EUR 420) for those retiring before 2020, otherwise it is HUF 100 000 for individual retirement accounts; HUF 150 000 for voluntary private pension funds and HUF 130 000 for pension insurance schemes (OECD, 2015b). Individuals may combine several accounts but the total tax refund cannot exceed HUF 280 000 a year. There does not seem to be any meaningful reason for the various rates, and the tax incentives should be aligned and equalised for all schemes. Subsidies should be limited, with voluntary pensions being instead subject to the standard taxation of savings instruments (OECD, 2014a).
To be a useful complement to PAYG pensions, two main issues need to be addressed: low financial literacy and enrolment. Unless enrolment is automatic (with the possibility of opting out), as in the United Kingdom for instance, the take-up of voluntary pension schemes tends to be low. Due to higher savings capacity and financial literacy among advantaged socio-economic groups, voluntary pension coverage is heavily biased in favour of workers with high earnings (OECD, 2017b). Voluntary pensions might therefore magnify the tax exemptions for the better-off, and as a result tend to increase old-age inequality. When coverage is low as in Hungary, then in the special case of low-income earners incentives such as targeted matching contributions or a flat introductory bonus contribution should be used to encourage their participation of low-income earners within well-designed auto-enrolment schemes (OECD, 2014a) (OECD, 2017b).
Flat-rate subsidies and matching contributions have been used in for example Italy, New Zealand, the United Kingdom and Turkey. Incentives could also target financial assistance towards lower income individuals (OECD, 2016a) (OECD, 2017b). Irrespective of targeting, such measures often carry substantial fiscal costs, and should always be only temporary. However, the scale of the pension challenges means that policy action across many different policy measures is required and that policy actions are needed as early as possible.
Table 1.7. Fiscal cost and funding of key recommendations on pensions
|
Recommendations with potential fiscal impact |
Impacts on fiscal balance |
|---|---|
|
Link the retirement age to life expectancy |
Pension spending is projected to increase by 2.7%. Linking the statutory retirement age to gains in life expectancy after 2022 would fully cover the projected long-term increase. An increase of 5 contributory years would add 1.1pp of GDP in pension contributions. |
|
Combat old-age poverty by introducing a basic state pension at HUF 57000 (twice the current minimum pension). |
+0.04% of GDP. Expense would be fully covered by capping maximum pensions at 150% of average wages. |
Source: OECD.
Box 1.3. Main recommendations on pensions
Key recommendations are bolded
Ensuring sustainability of the pension system
Complete the ongoing increase of the statutory retirement age to 65 by 2022. Thereafter link it to gains in life expectancy.
Abolish the Women 40 scheme.
Taking steps to alleviate old-age poverty
Introduce a basic state pension to guarantee a minimum income for all pensioners.
Improving the design of the current system
Impose a single flat accruals rate of around 2%.
Implement flexible retirement, with a symmetrical system of actuarially neutral pension increments and decrements of around 6% a year, including for public employees.
Provide incentives for participation in third pillar voluntary pension funds through targeted temporary matching contributions or a flat introductory bonus contribution.
The health sector is facing multiple challenges
Hungary’s health-care sector is facing multiple challenges, including the generally poor health status of the population, unequal access to health services (particularly in rural areas) and rising health needs from an ageing population, including more treatment for chronic conditions. Moreover, health-care costs are rising and will continue doing so as new and expensive technologies is introduced. Ageing will also increase demand for long-term care (LTC). So far, health-care reforms have been modest. There has been limited restructuring of the hospital sector despite the ongoing urbanisation process (Chapter 2). Moreover, only recently have measures been taken to address a shortage of health care professionals, reflecting the emigration of health care workers. Earlier decentralisation reforms have subsequently been reversed (Box 1.4). More generally, the public health care system has been underfunded and is therefore characterised by persistent hospital debts and an increase in the market share of private health care providers. Total health care expenditure has stagnated since the mid-2000s while public spending on health care has fallen relative to GDP (Figure 1.19).
Box 1.4. The organisation and governance of the health care sector
The widening gap in health status between Hungary and Western European countries by the early 1990s led the first government after the transition to begin reform of the health care system. The ownership and administration of service providers, such as hospitals, were devolved from the central to local governments. The financing was based on a single insurance model (Gaál, 2004). However, the combination of strong focus on cost-containment since the mid-1990s and a lack of coherent long-term strategy have hampered further reforms.
Due to unfavourable macroeconomic condition and ever increasing pharmaceutical spending, the focus of health policy shifted towards cost-containment in the mid-1990s (Gaál, 2004). Health care spending has been unstable ever since with short spending sprees and extended periods of cost-containment and budget cuts (Gaál et al., 2011). The economic crisis in the second half of 2000s reinforced the austerity measures in the health sector.
In the second half of the 2000s, the role of the private sector was increased to enhance the efficiency and funding of the health care system. However, reform initiatives to introduce managed competition of multiple health insurers as well as outsource the provision of health services to private companies failed due to political and public objection (Gaál et al., 2011).
In recent years, the direction of health policies turned towards re-centralisation. To address chronic inefficiencies and regional inequities in health care provision, the central government’s role in terms of governance has been strengthened since 2012. Currently, policy formulation, rule enforcement and all financial and budgetary decisions are controlled by the central government (OECD/European Observatory on Health Systems and Policies, 2017). Health care is administered by the State Secretariat for Healthcare within the Ministry of Human Capacities. The leading health care agency within the Ministry is the National Healthcare Services Centre (NHSC), which is an umbrella organisation of other (formerly independent) agencies and it is responsible for hospital planning and care coordination, among others (OECD/European Observatory on Health Systems and Policies, 2017).
The ownership structure of the health care system has also been centralised. The provision of inpatient and outpatient specialised care and the ownership of hospitals have been transferred back to central government (OECD/European Observatory on Health Systems and Policies, 2017). After having lost its self-governance status in 1998, the National Health Insurance Fund Administration (NHIFA) was dissolved into the Ministry of Human Capacities altogether in early 2017 (OECD/European Observatory on Health Systems and Policies, 2017). As a result, the NHIFA lost its autonomy and only kept its administrative functions, while its traditional role of hospital supervision became the responsibility of NHSC. The financing structure of the health care system has changed considerably since the mid-2000s. The decrease in employers’ health insurance contribution to the Health Insurance Fund (HIF) has been accompanied by an increase in budgetary contributions. Since 2012, employers’ contributions have been replaced with a non-earmarked social contribution tax. The current model is a hybrid between a financing structure where insurance rights are acquired through social security contributions and a general taxation based model where all citizens are entitled to health care that is financed from the budget.
Figure 1.19. Health care spending has been relatively low
As a percentage of GDP, 2017
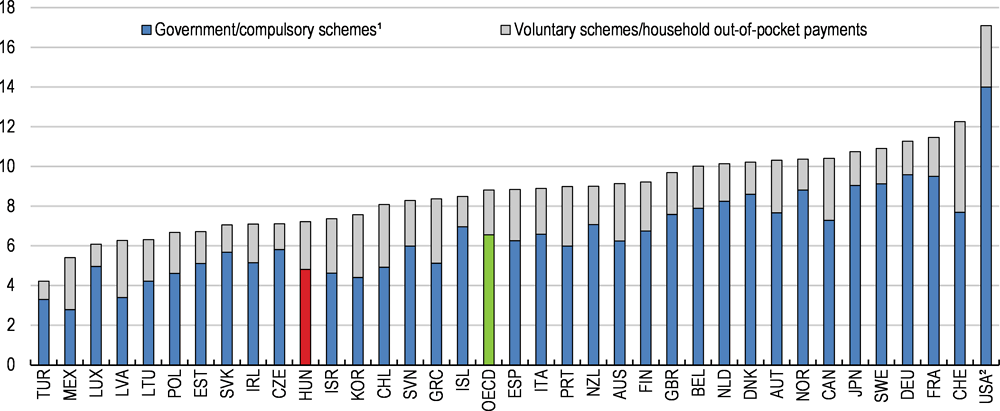
1. Public health spending refers to health spending by government schemes and compulsory health insurance. In the case of Germany, the Netherlands and Switzerland, spending by private health insurers for compulsory insurance is also included in public health spending. The OECD average is an unweighted average of all 36 member countries.
2. Data for USA are for 2016.
Source: OECD (2018), "Health Expenditure and Financing", OECD Health Statistics (database).
Health outcomes are characterised by low health status and large disparities
Notable strengths of the health-care system include near universal health-care coverage and high vaccination rates for communicable diseases. Nonetheless, health outcomes are unsatisfactory. The share of avoidable deaths in the light of current medical knowledge and technology among the population below 75 at 41% is almost 10% above the European Union (EU) average. Indeed, according to the latest poll by Ipsos among 28 countries surveyed Hungarians are by far the most worried about the state of the health care system with 71% of the adult population responding that health care is the most worrying topic (Ipsos, 2018).
The level of health spending partly explains this poor situation; indeed, according to some estimates, if health expenditure were increased to the Austrian level (from 8% to 10% of GDP), then male mortality is estimated to fall by about 13% (Lackó, 2015). However, inefficient care provision is also an important driver of unsatisfactory health outcomes.
Life expectancy at birth is the fourth lowest among OECD countries (Figure 1.20, Panel A). Similarly, remaining life expectancy at age 65 is internationally low despite recent improvements (Figure 1.20, Panel B). This reflects one of the highest mortality rates in the OECD, which is mainly driven by death from diseases of the circulatory system and cancer. Furthermore, disparities in life expectancy is larger than elsewhere with 30-year old male tertiary-education graduates expected to live 11 years longer than similarly-aged males with below-upper secondary education – a gap that is 4 years higher than on average among OECD countries. In addition, regional differences in health outcomes have been increasing since the mid-1990s, leading to a 3-year gap in life expectancy at birth between the richest region, Central Hungary, and the relatively poor Northern Hungary (Orosz and Kollányi, 2016; Uzzoli, 2016) (ÁEEK, 2016).
Figure 1.20. Health status of the population is poor in international comparison
In years1
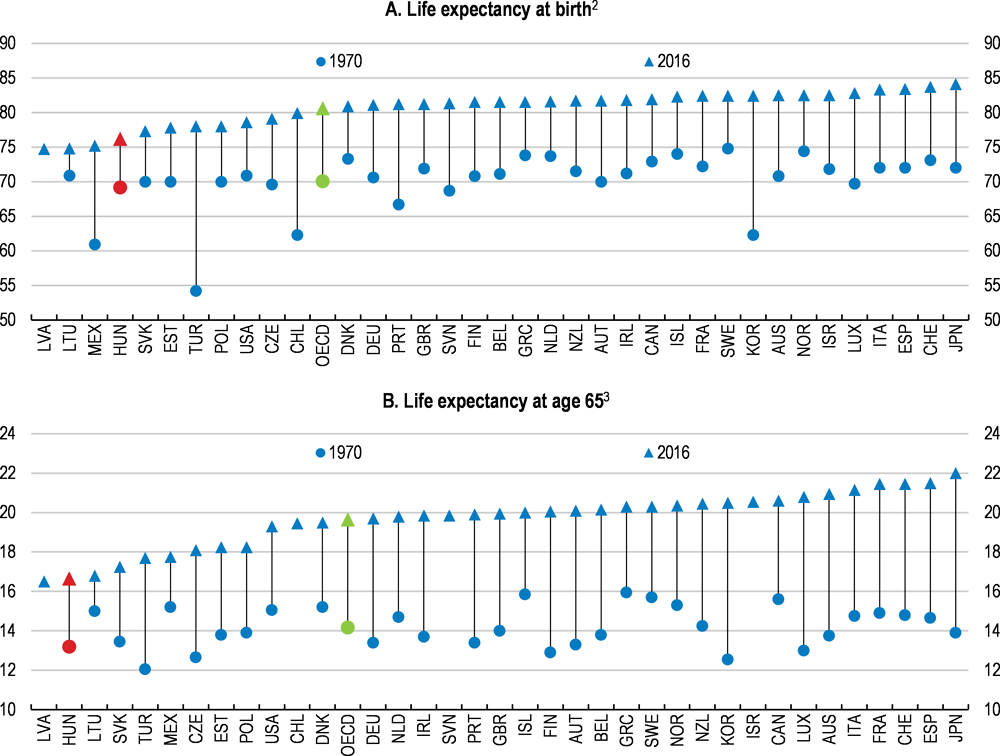
1. The OECD aggregate is calculated as an unweighted average of the data shown.
2. 2015 instead of 2016 for Canada, Chile and France. 1971 instead of 1970 for Canada, Israel, Italy and Luxembourg.
3. 2015 instead of 2016 for Canada, Chile and France. 1971 instead of 1970 for Canada, Finland, Italy and Luxembourg. Life expectancy at age 65 is calculated as the unweighted average of the life expectancy at age 65 of women and men.
Source: OECD (2018), "Health Status", OECD Health Statistics (database).
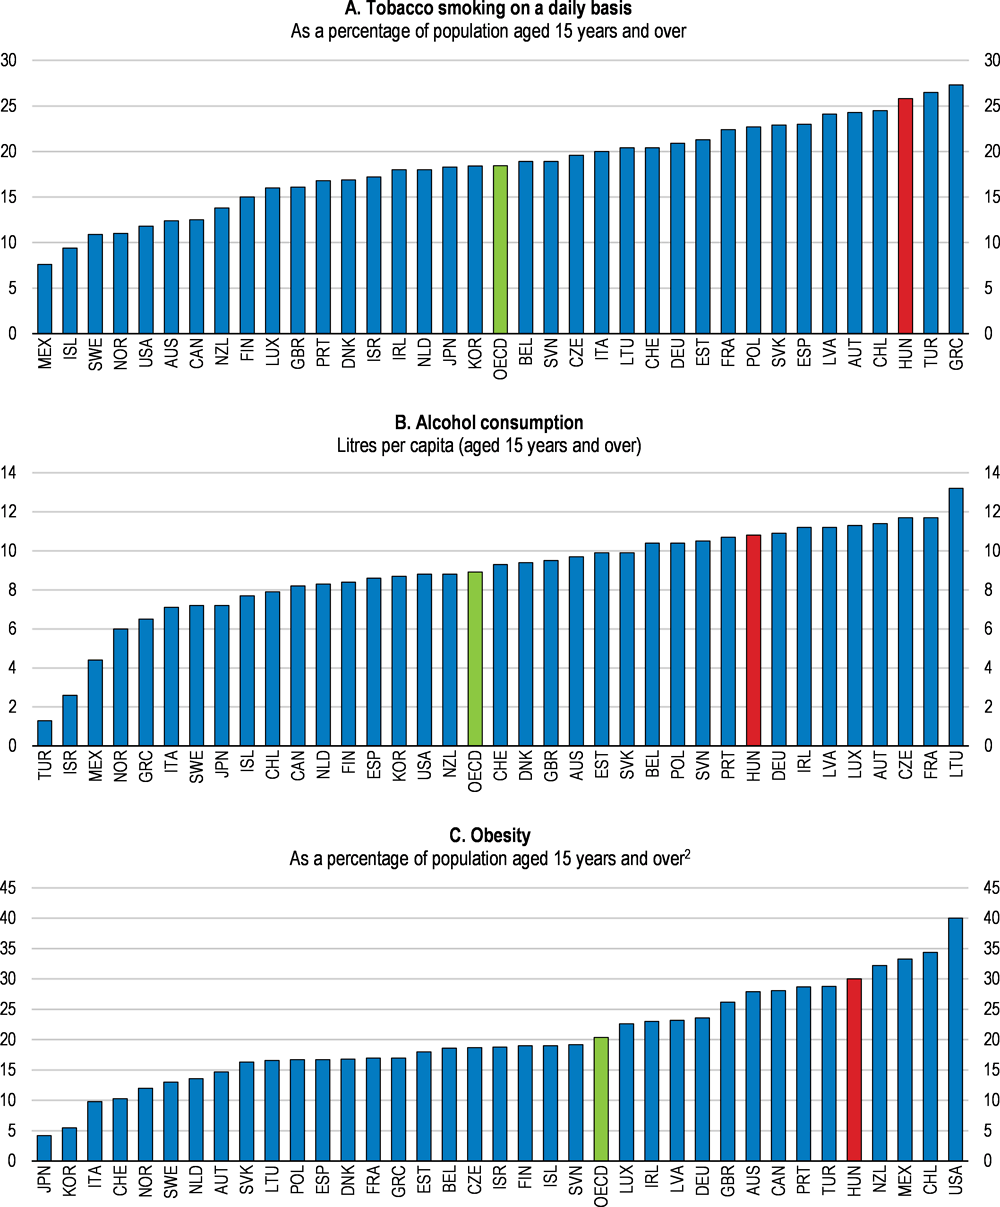
Lifestyle factors have a greater negative impact on life expectancy than elsewhere in the OECD. Almost 40% of overall life years lost due to diseases and disabilities is linked to unhealthy lifestyles (OECD/European Observatory on Health Systems and Policies, 2017). This is the fourth highest share in the EU. Hungarians are among the heaviest smokers in the OECD and alcohol consumption is nearly a quarter higher than the OECD average (Figure 1.21, Panels A and B). In addition, the 30% obesity rate is one of the highest among OECD countries (Figure 1.21, Panel C). Unhealthy lifestyles are partly a reflection of little focus on preventive care. Spending per capita on preventive care, including public health promotion programmes, has fallen by nearly 40% in real terms since the mid-2000s. In the past, ambitious public health programmes have often been watered down at the implementation phase (OECD/European Observatory on Health Systems and Policies, 2017).
Figure 1.21. Lifestyle related health risks are high
2017 or nearest year available1
1. Data for tobacco smoking and obesity for Hungary refer to 2014. Data for alcohol consumption for Hungary refer to 2015. The OECD aggregate is calculated as an unweighted average of the data shown.
2. Self-reported data for Austria, the Czech Republic, Denmark, Finland, Greece, Iceland, Italy, Lithuania, the Netherlands, Norway, Poland, the Slovak Republic, Slovenia, Spain, Sweden and Switzerland. Measured estimates derived from health examinations are generally higher and more reliable than estimates derived from population-based health interview surveys.
Source: OECD (2018), "Non-Medical Determinants of Health", OECD Health Statistics.
The resources invested in health care are not used efficiently
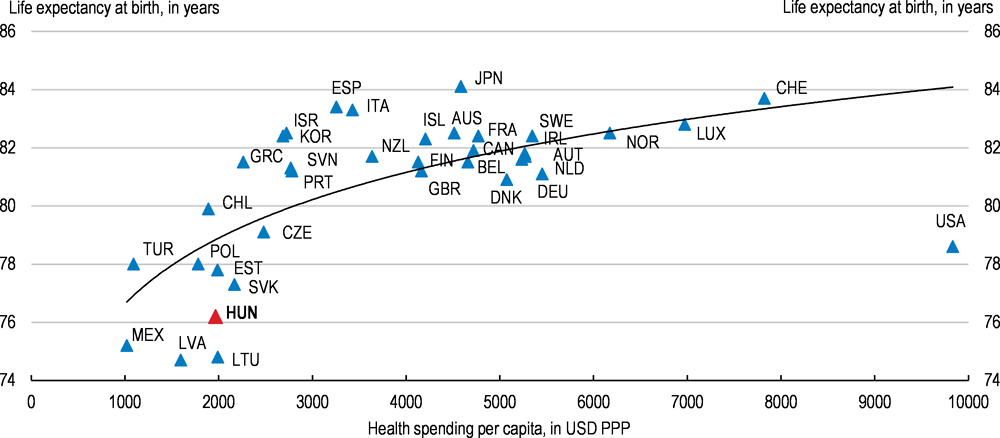
If the efficiency of resource utilisation was raised to the level observed in other OECD countries with similar health spending per capita, life expectancy could be raised by around 3 years (Figure 1.22). Moreover, if spending efficiency was aligned to the most efficient health care system in the OECD, it is estimated that amenable mortality could be reduced by more than 60%, boosting life expectancy by 5 years (Medeiros and Schwierz, 2015; Dutu and Sicari, 2016). The health care system is also underperforming relative to countries with similar health policies and institutions (Joumard, André and Nicq, 2010).
Figure 1.22. Better resource utilisation could boost life expectancy significantly
2016 or nearest year available1
1. 2015 for life expectancy at birth for Canada, Chile and France. PPP: purchasing power parity.
Source: OECD (2018), "Health Expenditure and Financing", OECD Health Statistics (database), July; and OECD (2018), "Health Status", OECD Health Statistics (database).
Reorganising health care provision would improve efficiency
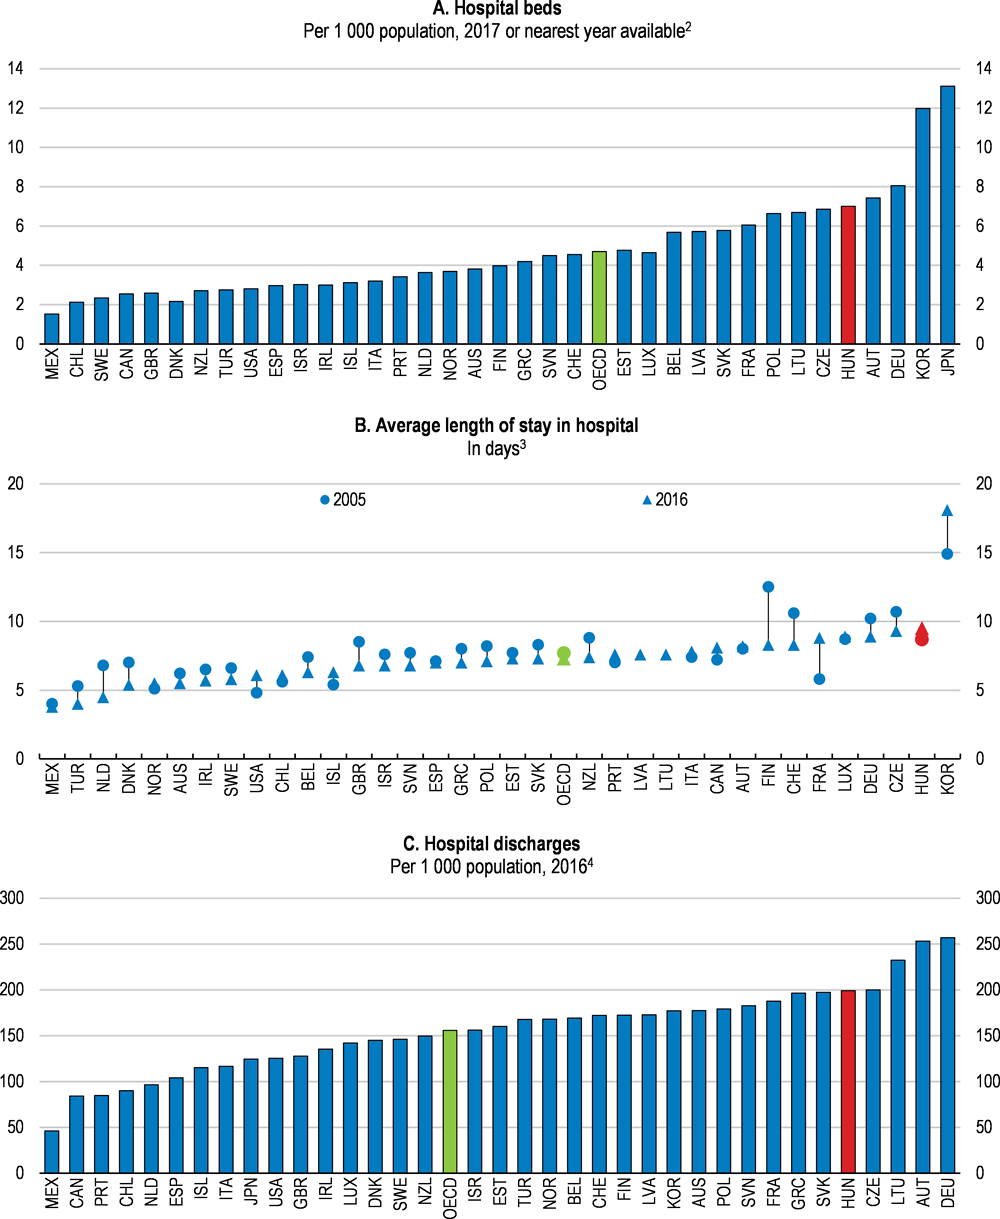
Health-care provision remains highly hospital-centred, despite a 30% decrease in the number of acute care hospital beds since 2000 (OECD/European Observatory on Health Systems and Policies, 2017). However, the reduction in acute care beds has been mainly achieved by transforming acute care units into chronic care departments. Indeed, closing under-performing hospitals has proven to be politically difficult (Gaál et al., 2011). Since 2006, only a few hospitals have been closed down while some have been transformed into long-term care institutions (Krenyácz, Kiss and Révész, 2017). As a result, the number of hospital beds remains above the OECD average and the average length of hospital stay has increased to 9.5 days (Figure 1.23, Panels A and B). High hospital-discharge rates (a measure of overall hospital activities through the number of patients who leave a hospital after staying at least one night) also indicate an overuse of hospital-based inpatient care (Figure 1.23, Panel C).
Figure 1.23. Health care provision is highly hospital-centred1
1. The OECD aggregate is calculated as an unweighted average of the data shown.
2. 2016 for Hungary.
3. 2015 for Australia, New Zealand, Norway and Portugal. 2014 for the United States. 2012 for Greece.
4. 2015 for Australia, New Zealand, Norway and Portugal. 2014 for Japan. 2012 for Greece. 2010 for the United States.
Source: OECD (2018), "Health Care Resources", OECD Health Statistics (database); and OECD (2018), "Health Care Utilisation", OECD Health Statistics (database).
The hospital sector should be restructured, like in other OECD countries, by having fewer but better equipped hospitals that focus on complex cases, requiring high levels of specialised and technical care, and leave all other services to less resource intensive care settings (OECD, 2017d). Some progress in this direction is planned with the implementation of the Healthy Budapest Programme over the coming years. More generally, closing under-performing hospitals would release financial resources that could be invested in replacing obsolete medical equipment. Indeed, the number of high technology medical equipment, such as magnetic resonance imaging (MRI) units and computed tomography (CT) scanners, per capita is one of the lowest among OECD countries.
This would have to be combined with enhancing outpatient care including day care to generate efficiency gains by shortening the length of hospital stay and reducing waiting times (OECD, 2017e). Lengthy hospital stays are not only inefficient in terms of costs, but also pose health risks through hospital-acquired infections. Currently, the use of one-day surgery is still underutilised. For example, the 54% share of cataract surgeries carried out on a same-day basis is well below the OECD average of 87% (OECD, 2017d; OECD, 2017e). Overall, outpatient care, including day care, accounts for only 20% of all hospital expenditure, nearly 50% less than the OECD average (OECD, 2017e). It is promising that the budget cap on reimbursing same-day surgery has been abolished and the level of reimbursement for one-day interventions has been set 10% above the amount refunded in an inpatient care setting. As a result, the number of ambulatory surgeries increased by around two and a half times between 2010 and 2017.
Stronger price signals could reduce inefficiencies in the hospital sector
There are few economic incentives in place for the efficient provision of hospital services. The systems of payments per services provided (fee-for-service) in outpatient care and on per-diem basis in chronic care encourage the increase of service provision, but account for a relatively small share of activities as measured by expenditure (OECD, 2016c).
The payment per case based on diagnosis-related groups (DRGs), which increases efficiency by encouraging health service providers to reduce their productions costs per case – i.e. a performance-based financing mechanism – was already introduced in inpatient acute care in 1993 (Gaál, 2004). However, the DRG system has not been regularly updated and it does not account for amortisation costs. As a result DRG tariffs do not reflect the true costs of health services, reducing markedly their usefulness. Therefore, strengthening price signals in the system requires DRG tariffs to be updated on a regular basis. Moreover, to fully exploit the potential of the DRG system, hospitals need to be able to adjust their supply of health services continuously. This requires enhancing their responsibilities and decision making, including their investment needs, which are currently centralised. Furthermore, reinstating the National Health Insurance Fund Administration’s autonomy and its traditional role of enforcing efficiency in hospitals should be also considered.
The government introduced an additional volume-based measure in 2004 with the system of limiting output volumes to put downward pressure on hospital spending (Endrei et al., 2014). However, limiting output volumes is a blunt tool with adverse side effects. Hospitals do not have incentives to improve efficiency once they reach the predetermined budget ceiling, since they do not benefit from further reduction of production costs. Furthermore, care co-ordination is distorted as hospitals that already reached their output volume limit tend to send patients to other institutions. This mostly results in smaller institutes referring patients to university medical schools and national institutes (Gaál et al., 2011; Endrei et al., 2014). Thus, the system of limiting output volumes should be gradually phased out.
In the presence of weak price signals, costs are contained by applying general budgets for each hospital. However, the government routinely absorbs hospital debts, partly because budgets are set at artificially low levels to ensure cost-containment, which turns the global budgets into soft budget constraints. Particularly in the absence of performance-related pay for hospital managers, giving them few incentives for improving efficiency and reducing wasteful spending. Instead, hospital managers tend to focus on monitoring liquidity and lobbying for bailout while the control of other aspects of care delivery, such as quality, is often neglected (Krenyácz, 2017). Moreover, there is evidence that budget constraints got softer after the ownership of hospitals was transferred to the central government (Krenyácz, Kiss and Révész, 2017). Once price signals are strengthened and hospitals’ financial resources are more stable, hospital management should be more accountable for keeping budget constraints and other measures of care quality. Introducing performance-related bonuses as part of hospital managers’ salaries could provide the right incentives for hospital managers. Increased accountability should lead to more autonomy with respect to investment decisions.
The gatekeeper role of primary care needs to be strengthened
The restructuring of care delivery has been limited by a lack of investment in other modes of service provision. Effective primary care, which is mainly provided by general practitioners (GPs), is indispensable to improve the quality and efficiency of health care provision, particularly as first point of contact and as gatekeepers, referring patients to best appropriate treatment, and in providing patient guidance (OECD, 2017e). However, the rate of unnecessary hospital admissions is one of the highest among OECD countries, which indicates that GPs are not effective in their gatekeeper role (OECD, 2017e). This reflects a lack of proper incentives as GPs’ remuneration is mainly based on global budgets and on the number of registered patients (capitation) (OECD/European Observatory on Health Systems and Policies, 2017). Thus, they have the incentive to reduce the number of services provided for each patient by referring patients to hospitals or other specialist care settings (OECD, 2016c). Moreover, the pay-for-performance (P4P) financing that aims at incentivising GPs to provide better care quality constitutes only 3%-4% of their income. Increasing the share of P4P payments would enhance GPs’ gatekeeper role, particularly if such payments include quality and efficiency targets (OECD, 2016c).
The efficiency of primary care could be improved by promoting group practices for GPs to exploit economies of scale and scope. When primary care is organised in group practices, care co-ordination can be improved and they facilitate investment in human and infrastructure capital that is necessary to implement new and more efficient care models (OECD/EU, 2016). However, solo practice remains predominant. The impact assessment of a five-year pilot programme of establishing group practices in disadvantaged rural areas has been promising with improved health in the target population, which enjoyed better access to health services, and increased cost effectiveness (Swiss-Hungarian Cooperation Programme, 2017). According to the assessment, the country-wide implementation of the programme, including the wages of a full-time public health expert and physiotherapist as well as a half-time dietician and health psychologist per group practice, would cost around 25% of the annual sub-budget of primary care (HUF 37 billion). However, considering the positive evaluation the authorities should consider a more general roll-out of programmes to support group practices. This would also support the government’s policy of strengthening the role of primary care.
Primary care has an important role in improving efficiency through better care co-ordination, particularly in terms of patient guidance. Poor organisation of the care process leads to wasteful use of resources through an increase in inpatient care, more specialist consultations and longer hospital stays (OECD, 2017d). Since GPs are the main entry point to the health care system, they are best placed to be responsible for care co-ordination (OECD, 2017d). Recent efforts to enhance information infrastructure and the exchange of health data between different providers are encouraging as the implementation of eHealth is expected to support care coordination (OECD/European Observatory on Health Systems and Policies, 2017). However, the capacities of GPs to co-ordinate care remains underdeveloped (OECD/European Observatory on Health Systems and Policies, 2017). GPs’ should have more competencies in referring patients to certain examination. Improving and standardising patient pathways for chronic diseases would also support care co-ordination (OECD/European Observatory on Health Systems and Policies, 2017).
The effectiveness of preventive care has to be improved to address lifestyle risks
In recent years, public health promotion policies is becoming more important with the launch of a comprehensive set of public health promotion measures that includes a tax on selected manufactured foods with high sugar, salt or caffeine content, regulation on restricting trans-fatty acid intake, the introduction of daily physical exercise in schools and healthier school canteens. In addition, national cancer screening programmes are mostly in place, although screening rates remain relatively low, especially among disadvantaged groups (OECD/European Observatory on Health Systems and Policies, 2017). Moreover, the comprehensive monitoring and evaluation of these screening programmes is lacking.
Due to high mortality from preventable causes, increasing investment in health promotion and disease prevention measures would be cost-efficient. Moreover, there is potential for introducing preventive measures that would increase revenues. For instance, an increase in relatively low taxes on alcohol and tobacco products could be considered. In particular, the use of taxes to raise alcohol prices in the cheaper segment of the market, together with regulating alcohol promotion, is effective in tackling harmful drinking (Sassi, 2015). The recent increase in the excise duty rates on tobacco products as well as the further increases envisaged for 2019 are welcome. Hungary’s tax on unhealthy foods has been successful in reducing consumption as well as generating extra revenues (OECD, 2016d).
A shortage of health workers hampers access to health services
Overall almost 5 500 doctors (around 15% of all active physicians) left the country to work abroad between 2010 and 2016. The rate of emigration of other health care professionals, including nurses, has remained at around 600 persons per year since 2013 (ENKK, 2016). To stem the emigration of doctors, their net wages have been increased by more than 60% since 2010, which has contributed to a 50% fall in the number of doctors who requested to have their diplomas recognised abroad (Figure 1.24, Panel A). Nonetheless, the average salary of doctors remains low in international comparison (Figure 1.24, Panel B). Wages of other health care workers, such as nurses, have also been raised since 2016. However, their earning is low compared to neighbouring countries and also relative to the national average wage (Figure 1.24). This has been complemented with scholarship programmes targeting young medical graduates, bolstering the number of medical and nursing graduates in the last few years.
Figure 1.24. Remuneration of health workers has been increasing, but remains relatively low
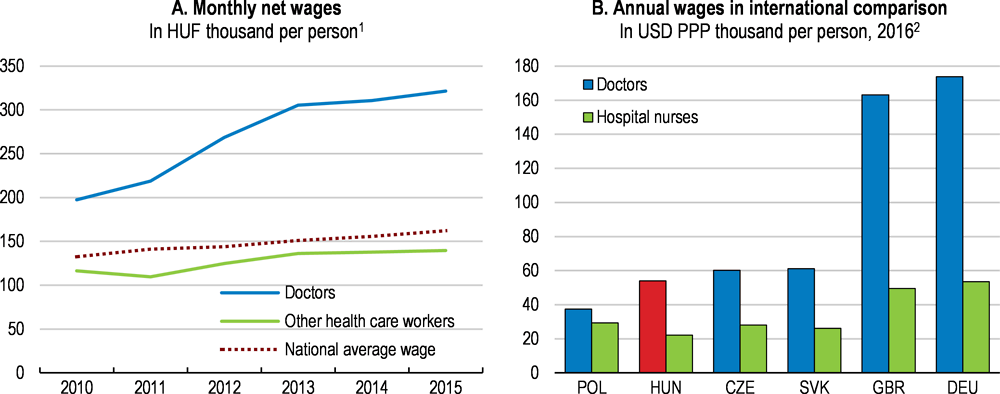
1. In nominal terms. Other health care workers include nurses among others.
2. Data for doctors refer to remuneration of specialists. Data for hospital nurses for Germany refer to 2014. PPP: purchasing power parity.
Source: ENKK (2016), "Beszámoló az Egészségügyi Ágazati Humánerőforrás 2015. Évi Helyzetéről", Health Registration and Training Centre (ENKK, Egészségügyi Nyilvántartási és Képzési Központ); and OECD (2018), "Health Care Resources", OECD Health Statistics (database).
These measures, however, have been insufficient to stem the effects of emigration of health workers and the ageing of the health-care workforce, pointing to continued shortages. Between 2000 and 2015 the share of doctors aged over 55 years increased from around 25% to 37%. The ageing problem is most severe among GPs with one-third of them already above the retirement age (Ministry of Human Capacities, 2014). Moreover, shortages are concentrated in rural areas. There are almost twice as many doctors per inhabitant in Central Hungary as in Northern Hungary. Similarly, the more than twofold difference in doctor density between urban and rural areas is 50% higher than the average gap observed among OECD countries. Despite government efforts to address regional disparities in access to primary care and to fill vacant GP positions, the number of permanently unfilled GP practices is concentrated in poorer counties (Figure 1.25).
Remuneration levels need to be raised further to retain and attract health professionals. Salary increases of other health care workers, such as nurses, should be prioritised. In late 2018, the government announced steps in this direction. The shortage of doctors could also be improved by optimising the use of human resources in the health sector. Doctors allocate substantial part of their time on administrative tasks and basic health examination that could be delegated to mid-level health care providers, such as nurse practitioners or pharmacists. The scope of practice for non-physicians, have already been expanded in about half of OECD countries (Ono, Schoenstein and Buchan, 2014; OECD, 2017d). As a step in the right direction, the Advanced Practice Nurse (APN) tertiary education programme was launched in 2017 with the aim of facilitating the delegation of certain tasks to nurses. Addressing geographical disparities through the wage system could be done in the form of financial incentives, such as income guarantees or bonus payments, for doctors practising in an underserved area (Ono, Schoenstein and Buchan, 2014).
Figure 1.25. The shortages of health workers is especially severe in poor rural areas
Number of permanently unfilled GP practices per 100 000 people, 1st of April 20181
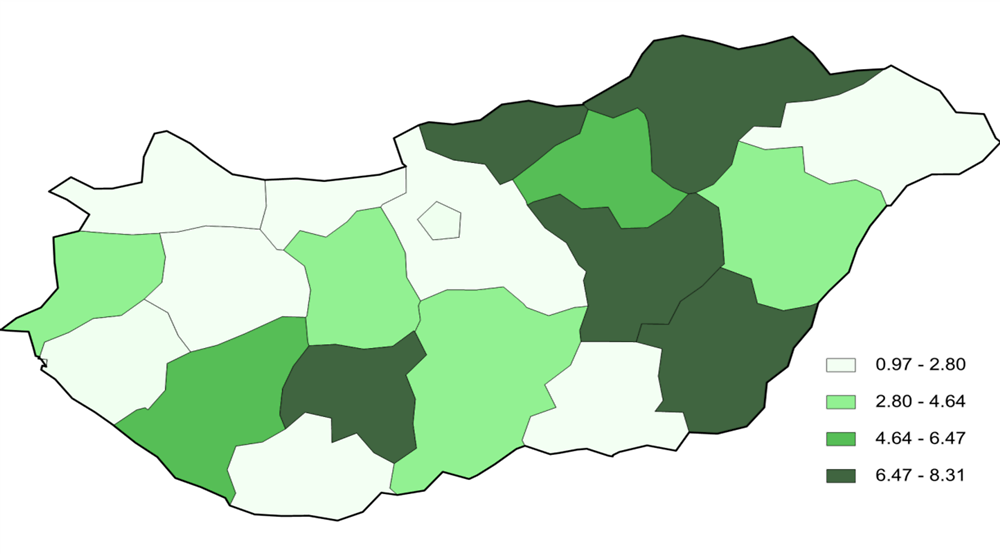
1. Data refer to total unfilled GP practices including practices for children only, adults only and also mixed practices.
Source: Állami Egészségügyi Ellátó Központ (ÁEEK), Alapellátási Osztály, http://www.oali.hu/
High out-of-pocket payments create a barrier to health care access for low-income earners
High pharmaceutical co-payments and informal payments as well as the increasing reliance on private health-service providers lead to high out-of-pocket payments, One-third of overall health spending is financed directly by households (Figure 1.26, Panel A). Moreover, out-of-pocket health spending as a share of final household consumption is the fourth highest among OECD countries (Figure 1.26, Panel B). This creates a relatively high barrier to health-care access for low-income earners. In 2014, almost 22% of the population with low educational attainment reported that they had to forgo medical care for financial reasons, which was three times higher than for tertiary educated. In 2014, 7.5% of households faced catastrophic out-of-pocket payments, defined as out-of-pocket medical spending exceeding 40% of total household expenditure (OECD/European Observatory on Health Systems and Policies, 2017). This share increases to more than 25% for low-income households (OECD/European Observatory on Health Systems and Policies, 2017).
Almost half of total out-of-pocket payments is linked to pharmaceutical spending, the fifth-highest among OECD countries, although since 2011 increased price competition and use of generics has reduced overall pharmaceutical spending as a share of total health expenditure. The 40% share of generics in sales value of pharmaceuticals was above the EU average in 2015 (EFPIA, 2017). However, the recent decrease in overall pharmaceutical spending has been achieved by reducing only public spending while households’ private expenditure on medicines remained constant.
The reduction in reimbursement for pharmaceuticals from the HIF has increased out-of-pocket payments (ÁEEK, 2016). Continued efforts to exploit the use of generics and improvements in public procurement practices for pharmaceutical products could help contain overall spending on pharmaceuticals (OECD/European Observatory on Health Systems and Policies, 2017). An additional private cost is informal payments for gaining priority access and free choice of specialists – a deeply rooted practice – which are estimated to make up at least 2% of total health expenditure (OECD/European Observatory on Health Systems and Policies, 2017). Such payments reduce access to health services for low-income earners. Sufficient salary increases of health workers are necessary to reduce the role of informal payments.
Figure 1.26. Out-of-pocket medical spending is high
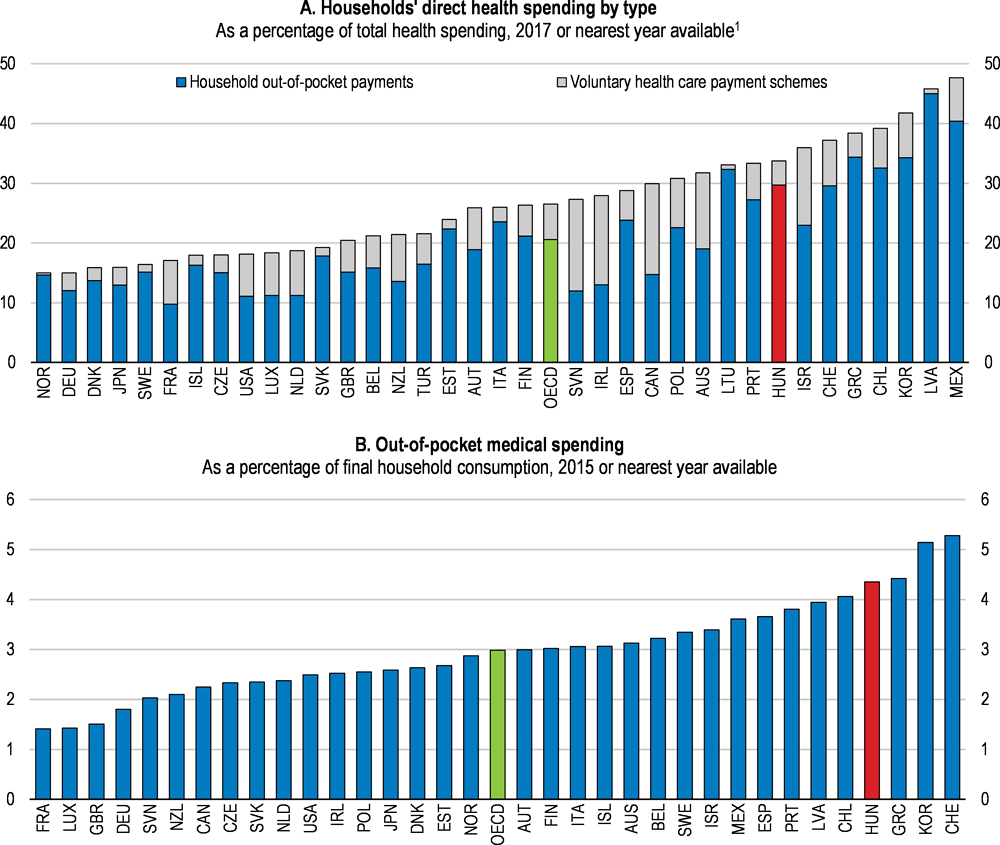
1. 2016 for Hungary. The OECD aggregate is calculated as an unweighted average of the data shown.
Source: OECD (2018), "Health Expenditure and Financing", OECD Health Statistics (database); and OECD (2017), Health at a Glance 2017: OECD Indicators, OECD Publishing, Paris.
The health benefit package funded by the Health Insurance Fund (HIF) is relatively broad and in principle ensures equal access to health care regardless of socio-economic background. However, the strain on public health care means that people who can afford it either turn to private service providers for faster service, greater convenience and choice of specialists, or else acquire better public services through informal payments. These out-of-pocket payments are often spent on services that are in principle covered by the HIF. The publicly funded health benefit package should be updated and clearly defined in order to limit informal out-of-pocket payments. This would also increase revenues for public health care providers.
Self-reliance in terms of health-care costs is an important feature of the current system. Almost half of total expenditure on outpatient care is financed by out-of-pocket payments leading to a private health market that is worth around 1% of GDP (Ministry of Human Capacities, 2014). Nevertheless, the share of voluntary health insurance in total private spending is only around 10% (Figure 1.26, Panel A). As opposed to out-of-pocket payments, voluntary health insurance has the advantage of managing financial risks related to ill health. Establishing a voluntary health insurance market, which would supplement the publicly funded health benefit package, would not only improve the situation of those patients who could afford such a health insurance, but it could also generate extra resources for the public provision of all essential and cost-effective care.
Long-term care is faced with the challenge of population ageing
Demand for long-term care (LTC) will increase with an ageing population. Although elderly people are not the only target group, demand for LTC is highly age-related (Colombo et al., 2011). According to the indicator for disability-free life expectancy at the age of 65, only six and a half of the remaining years are spent in good health as compared with an EU average of 10 years (Figure 1.27, Panel A). Because of relatively bad health status at old age, high share of older people need assistance due to health-related limitations in daily activities (Figure 1.27, Panel B).
Figure 1.27. Relatively high share of old-age people need assistance due to health problems
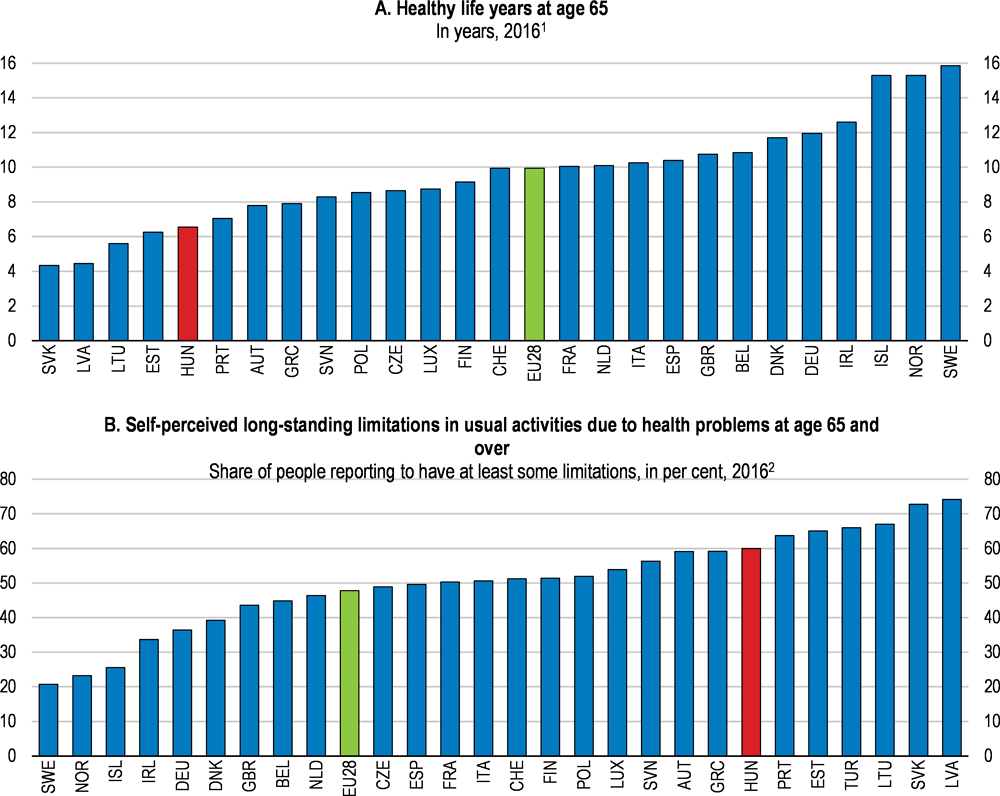
1. 2015 for Iceland. Healthy life years are defined as the number of years spent free of activity limitation and they are calculated as the unweighted average of healthy life years at age 65 of women and men.
2. 2015 for Iceland and Turkey.
Source: Eurostat (2018), "Healthy life years", Eurostat Database; and Eurostat (2018), "Functional and activity limitations", Eurostat Database.
The organisation of long-term care for the elderly is fragmented
LTC services are administrated in both the health care system and the social care system with separate and distinct legislation, financing mechanisms, institutional networks and minimal cooperation (Czibere and Gál, 2010). The LTC services provided by the health care system focus on improving health conditions, and include institutionalised care in hospitals’ nursing departments and home-based nursing care. The LTC services provided by the social care system are tailored to provide elderly people with assistance in daily activities and include home–based domestic care (including emergency alarm system and meal provision services), institution-based day care, temporary care homes and residential care homes (Czibere and Gál, 2010; Hajdú and Lajkó, 2018). Residential care homes are LTC institutions, which provide accommodation and long-term care and are managed by the social care system. Since 2012 institutionalised LTC (both within the health and social care systems) has been managed by the central government, while the administration of home-based care has remained at the local level (European Commissiont, 2016).
In terms of eligibility rules, access to long-term health care services is linked to health insurance rights and doctors’ assessment. The eligibility criteria for home-based domestic care and residential care homes are based on a complex assessment process. Care needs are assessed based on several physical abilities, social circumstances and financial background (Czibere and Gál, 2010). People who need between 2 and 4 hours of care per day are eligible for home-based domestic care while those with needs of more than 4 hours of care per day are eligible for residential care homes (Czibere and Gál, 2010).
The dual nature of the LTC system with parallel financing of overlapping functions reduces efficiency (Czibere and Gál, 2010). Recognising the need for more integrated LTC services, the government plans to establish a new type of institution called professional care centre, where health and social care services are combined, effectively creating a third LTC type of institution. However, additional measures are needed to improve the integration of LTC services to create a unified approach. Therefore, the governance of health and social LTC services within the Ministry of Human Capacities should be more aligned with stronger coordination between the two areas. Moreover, the separation of institutionalised and home-based care in terms of the responsibilities of different levels of government could be reconsidered.
Low capacities of long-term care lead to a burden on informal care
Despite the increasing demand for LTC services, public expenditure on LTC remains low in international comparison (Figure 1.28, Panel A). As a result, less than 40% of the population who are potentially dependent on LTC have access to formal care (Figure 1.28, Panel B). Another indication of low LTC capacities is that the number of formal LTC workers relative to the population aged over 65 years is only 2%, one of the lowest ratios among OECD countries and which is mainly driven by relatively low wages. This has let the bulk of elderly care to be provided informally by unpaid family members and informal carers (Széman, 2015). The government wants to increase the role of the family in providing care for the elderly. The 2011 Constitution even makes this a family obligation. On the other hand, the number of family carers receiving the nursing allowance (between EUR 90 and 160 per month depending on the condition of the patient) has been decreasing (Széman, 2015).
Figure 1.28. Low capacities of long-term care leads to unmet demand for elderly care
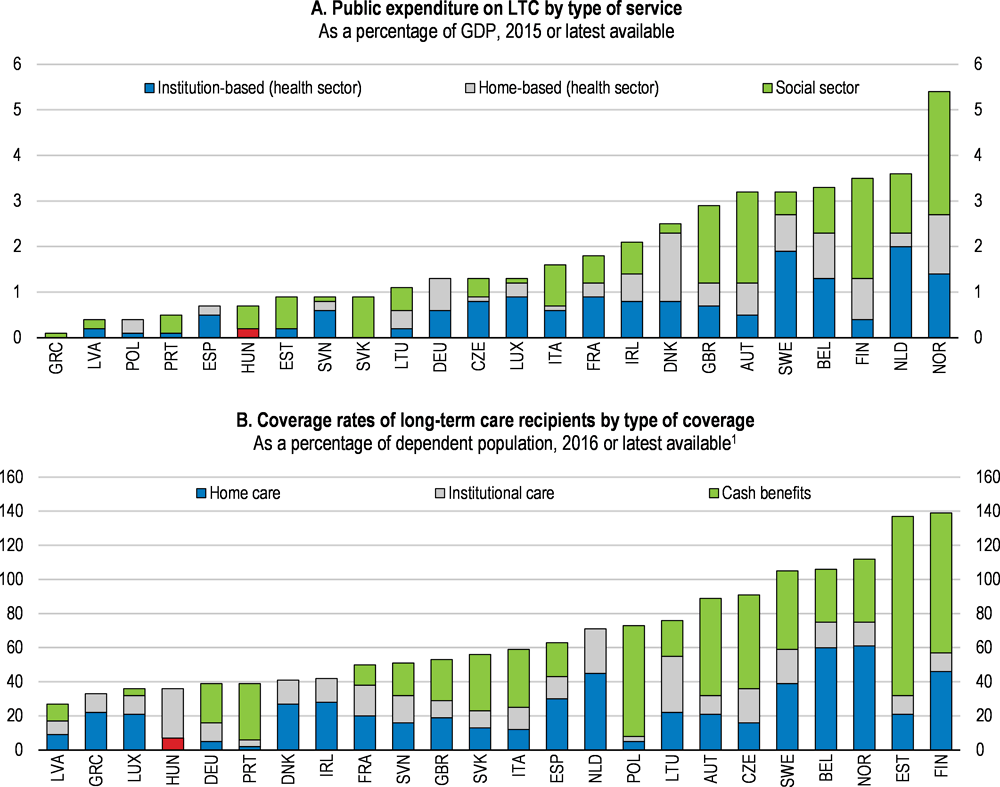
1. Coverage rate is estimated as a ratio between long-term care recipients and potentially dependent population. Potentially dependent population is calculated based on 2011-2015 average of EU-SILC data on "self-perceived longstanding limitation in activities because of health problems [for at least the last 6 months]". Coverage rate may be above 100%, as some recipients may receive cash benefits and in-kind benefits at the same time. It should be noted that the coverage for institutional care for Luxembourg is likely to be underestimated due to incomplete data. LTC: long-term care.
Source: European Commission (2018), "The 2018 Ageing Report - Economic & Budgetary Projections for the 28 EU Member States (2016-2070)", Directorate-General for Economic and Financial Affairs, Institutional Paper 079, Luxembourg.
Boosting home-based care would lead to efficiency gains
Home-based care is more efficient than institutionalised care in most cases where LTC needs are not severe and it boosts recipients’ satisfaction and quality of life (Colombo et al., 2011). However, access to home-based care is limited. Home-based nursing care, which can be ordered by a GP, is available for a maximum of 56 visits per year. Moreover, profit-based private service providers are the main providers of home-based nursing care as the supply from the public health-care system is restricted by the shortage of health workers. The capacities are even more limited in rural areas, leading to regional disparities in access to home-based nursing care. Access to home-based domestic care has been worsening since the end of the 2000s due to stricter eligibility criteria and decreasing financing (Széman, 2015). Capacities of home-based domestic care vary a lot depending on the financial resources of local authorities. Hence, an increase in public funding of in-kind home-based care is necessary to boost access.
The lack of home-based care capacities increases the care burden on families and LTC institutions leading to inefficiencies. Paying for home-based care provided by specialised carers is more efficient than relying on family and friends whose opportunity cost is not covered. The take-up of home-based nursing care could be increased if the nursing allowance, which is only paid to family carers, was replaced with an income-tested cash benefit scheme, allowing eligible LTC recipients to choose their home-based care provider freely. A cash benefit scheme could also be applied to home-based domestic care. In the latter, user fees are already means-tested, taking into account both income and real estate assets of the recipient and are capped at 20% of personal income (Czibere and Gál, 2010). Moreover, it would be also important to increase the number of formal LTC workers through more competitive wages, clear career path and better recruitment methods (Colombo et al., 2011).
The capacities and efficiency of residential care homes need to be improved
The number of LTC beds in hospitals is relatively high compared with the number of places in residential care homes in other countries, pointing to low capacities of residential LTC facilities that are operated by social care (OECD, 2017e). As a result, elderly people who are eligible for residential care homes but do not need special health care services often end up in hospitals' resource intensive nursing departments due to the lack of places in residential LTC institutions. This leads to inefficient service provision and worse outcomes for LTC recipients. User fees in residential care homes are capped at 80% of the recipient's income. However, separate information on hotel and care costs are not available, hindering the calculation of user fees that could be used for monitoring providers’ efficiency. The capacities and efficiency of residential LTC institutions could be enhanced through increasing public funds for in-kind home-based LTC or by introducing a voucher system to enable LTC recipients to choose among competing residential care homes. It would be also worthwhile to explore the potential for private LTC insurance as a supplementary financing tool to enable people to face large and uncertain LTC costs (Muir, 2017).
Higher public spending on health is needed to achieve better outcomes
Looking ahead, the share of elderly (over 65) in the population will increase from 17% to almost 30% by 2070. This will increase the demand for health and long-term care, which is going to put upward pressure on public spending. According to the EU Ageing Report Hungary’s life expectancy will increase by 10 years by 2070, while public health and LTC spending are projected to increase only by 0.8% and 0.4% of GDP, respectively (Figure 1.29, Panels A and B).
The projections are surrounded by large uncertainties. For example, taking into account the costs associated with improving the quality and coverage of health care as well as the cost of taking up new medical technologies, public health spending could increase by almost 2% of GDP by 2070 (Figure 1.29, Panel A). Moreover, a 10-year increase in life expectancy is likely to require more resources. Currently, average EU public health expenditures are 6.8% of GDP – well above the projected 5.7% of GDP for Hungary in 2070. Moreover, the implementation of efficiency improving measures, such as restructuring the hospital sector or strengthening primary and preventive care, would require additional resources at least in the short-term.
Figure 1.29. EU Ageing Report: Long-term projections of public health and long-term care expenditures
As a percentage of GDP
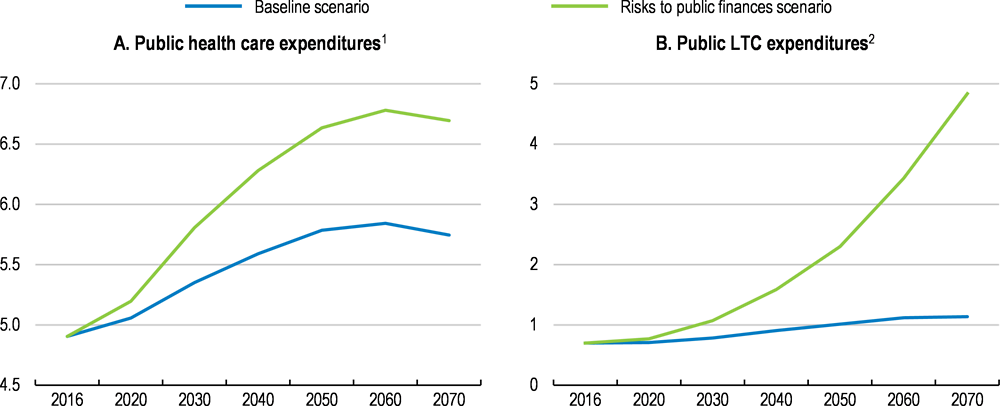
1. In the "Baseline scenario" health care expenditures are driven by the assumption that half of the future gains in life expectancy are spent in good health and trends in health spending slightly exceeds the growth rate of national income (i.e. income elasticity of health care spending is converging linearly from 1.1 in 2016 to unity in 2070). In the "Risks to public finances scenario" (called "Average risk scenario" in the EU Ageing Report) half of the future gains in life expectancy are spent in good health but the cost impact of improving the quality and coverage of health care as well as the cost of development of medical technologies which have stimulated expenditure growth in recent decades are taken into account.
2. In the "Baseline scenario" it is assumed that half of the projected gains in life expectancy are spent without disability (i.e. demanding care). In the "Risks to public finances scenario" (called "Average risk scenario" in the EU Ageing Report) half of the future gains in life expectancy are spent with no care-demanding disability and upwards convergence to the EU average of the relative cost profiles and coverage of publicly financed formal long-term care provision is assumed.
Source: European Commission (2018), "The 2018 Ageing Report - Economic & Budgetary Projections for the 28 EU Member States (2016-2070)", Directorate-General for Economic and Financial Affairs, Institutional Paper 079, Luxembourg.
The limited projected increase in LTC spending (reaching 1.1% of GDP) reflects partly the increase in years spent in good health, but will nonetheless still be 60% less than the EU average in 2070. However, if costs and coverage of publicly financed formal long-term care provision converge to the EU average, then public spending could reach almost 5% of GDP by 2070 according to the EU Ageing Report (Figure 1.29, Panel B). Boosting formal LTC capacities seems unavoidable as changing social preferences, evolving family models and urbanisation are likely to lead to a decrease in the supply of family carers.
Box 1.5. Recommendations to improve health-care provision and long-term care
Key recommendations are bolded.
Improving the efficiency of health care provision
Reduce hospital strays by enhancing outpatient care and concentrate inpatient care in fewer, better equipped and more specialised hospitals.
Strengthen price signals in health care provision by regularly updating the DRG tariffs.
Phase out the use of output volume limits.
Increase hospitals’ autonomy by enhancing the role of hospital managers through performance-related bonuses and greater autonomy in investment decisions.
Strengthen the gatekeeper and coordinator roles GPs by increasing the share of pay-for-performance financing.
Promote group practices among general practitioners.
Increase taxes on alcohol and tobacco products.
Reducing disparities in access to health services
Continue to raise remuneration levels in order to retain and attract health professionals.
Update and clearly define the publicly funded health benefit package as part of an approach to limiting informal out-of-pocket payments.
Establish a voluntary health insurance market that can supplement the publicly funded health benefit package.
Enhancing the capacities and efficiency of long-term care
Integrate the various long-term care systems with the governance of health and social LTC services within the Ministry of Human Capacities more aligned and coordinated.
Improve access to home and institution-based care by introducing cash benefits and vouchers in home-based care and residential care homes, respectively.
Increase public funds to in-kind home-based care.
Bibliography
ÁEEK (2016), Hungarian Health System Scan 2014-2015.
ÁEEK (2016), Magyar Egészségügyi Rendszer Teljesítményértékelési Jelentése 2013-15 [The Performance Assessment of the Hungarian Health System 2013-15].
Becker, U. (ed.) (2018), Long Term Care in Hungary, Springer, Cham., https://doi.org/10.1007/978-3-319-70081-6.
Blöndal, S. and S. Scarpetta (1999), “The Retirement Decision in OECD Countries”, OECD Economics Department Working Papers No. 202.
Casey, B. (2012), “The implications of the economic crisis for pensions and pension policy in Europe”, Global Social Policy, Vol. 12/3, pp. 246-265, http://dx.doi.org/10.1177/146818112455633.
Colombo, F. et al. (2011), Help Wanted?: Providing and Paying for Long-Term Care, OECD Health Policy Studies, OECD Publishing, Paris, http://dx.doi.org/10.1787/9789264097759-en.
Czegledi, T. et al. (2017), “What has been wrong with the retirement rules in Hungary?”, Acta Oeconomica, Vol. 67/3, pp. 359-387, http://dx.doi.org/10.1556/032.2017.67.3.4.
Czeglédi, T. et al. (2016), “Retirement rules in Hungary: gainers and losers”, Institute of Economics, Discussion Papers, Vol. MT-DP - 2016/31.
Czibere, K. and R. Gál (2010), The long-term care system for the elderly in Hungary, http://www.ancienlongtermcare.eu/sites/default/files/ENEPRI%20RR%20No%2079%20Hungary.pdf.
Domonkos, S. and Simonovits, A. (2017): Pension Reforms in EU11 Countries: An Evaluation of Post-socialist Pension Policies, International Social Security Review, 70, pp. 109–128
Dutu, R. and P. Sicari (2016), “Public Spending Efficiency in the OECD: Benchmarking Health Care, Education and General Administration”, OECD Economics Department Working Papers, No. 1278, OECD Publishing, Paris, http://dx.doi.org/10.1787/5jm3st732jnq-en.
EFPIA (2017), The Pharmaceutical Industry in Figures – Key Data 2017.
Endrei, D. et al. (2014), “The effect of performance-volume limit on the DRG basedacute care hospital financing in Hungary”, Health Policy, Vol. 2014/115, pp. 152–156.
ENKK (2016), Beszámoló az Egészségügyi Ágazati Humánerőforrás 2015. Évi Helyzetéről.
Eurofound (2016), Extending Working Lives Through Flexible Retirement Schemes: Partial Retirement, Publications Office of the European Union.
European Commission (2018a), Assessment of the 2018 Convergence Programme for Hungary.
European Commission (2018b), The 2018 Ageing Report.
European Commission (2018c), The 2018 Pension Adequacy Report: current and future income adequacy in old age in the EU, Publications Office of the European Union.
European Commission (2017), The 2018 Ageing Report: Underlying Assumptions and Projection Methodologies, Institutional Paper 065, Publications Office of the European Union, http://dx.doi.org/10.2765/286359.
European Commission Staff Working Document (2018), Assessment of progress on structural reforms, prevention and correction of macroeconomic imbalances, and results in hte in-deth reviews under Regulation (EU) No1177/2011.
European Commissiont (2016), Hungary Health Care & Long-Term Care Systems.
Fall, F. and D. Bloch (2014), “Overcoming Vulnerabilities of Pension Systems”, OECD Economics Department Working Papers No. 1133, http://dx.doi.org/10.1787.5jz1591prxth-en.
Freudenberg, C., T. Berki and A. Reiff (2016), “A Long-Term Evaluation of Recent Hungarian Pension Reforms”, MNB Working Papers 2.
Gaál, P. (2004), Health Care Systems in Transition: Hungary, WHO Regional Office for Europe on behalf of the European Observatory on Health Systems and Policies.
Gaál, P. et al. (2011), “Hungary: Health System Review”, Health Systems in Transition, Vol. 13/5, pp. 1-266.
GKI, V. (2018), Visegrad group, http://www.visegradgroup.eu/news/one-fifth-of-hungarian?iid=1001 (accessed on 13 September 2018).
Hungarian Central Statistical Office (2016), Indicators of poverty or social exclusion by reference year (2010–), https://www.ksh.hu/docs/eng/xstadat/xstadat_annual/i_zaa007.html (accessed on 27 September 2018).
INSEE (2018), L'emploi des séniors en hausse entre 2007 et 2017, https://www.insee.fr/fr/statistiques/3582878 (accessed on 12 September 2018).
Ipsos (2018), What Worries the World?.
Joumard, I., C. André and C. Nicq (2010), “Health Care Systems: Efficiency and Institutions”, OECD Economics Department Working Papers, No. 769, OECD Publishing, Paris, http://dx.doi.org/10.1787/5kmfp51f5f9t-en.
Kosa, E. (2012), “Moving away from the European Social Model in Hungary”, PolicyWorld, Vol. Summer 2012, pp. 18-19, http://www.social-policy.org.uk.
Krenyácz, É. (2017), Use of controlling system in Hungarian health care institutions: paradox of rise and fall, http://phd.lib.uni-corvinus.hu/985/.
Krenyácz, É., N. Kiss and É. Révész (2017), Re-centralisation of the hospital sector in Hungary: Analysis of reasons and tools.
Lackó, M. (2015), Some Explanation of Disparities of Mortality Rates of Working Age Population in Eastern, Central and Western Europe.
Medeiros, J. and C. Schwierz (2015), European economy - Efficiency estimates of health care systems.
Ministry for National Economy (2017), Country Fiche on Pension Hungary.
Ministry of Human Capacities (2014), Healthy Hungary 2014-2020.
Ministry of the National Economy (2018), Convergence Programme of Hungary 2018-2022, April 2018.
Muir, T. (2017), “Measuring social protection for long-term care”, OECD Health Working Papers, No. 93, OECD Publishing, Paris, http://dx.doi.org/10.1787/a411500a-en.
Direction de la Recherche, D. (ed.) (2017), Cumul emploi-retraite : deux personnes sur trois travaillent à temps partiel, DREES.
OECD (2018a), Key policies to promote longer working lives in Hungary, Country note 2007 to 2017.
OECD (2018b), OECD Pensions at a Glance Database, https://stats.oecd.org/Index.aspx?DataSetCode=PAG# (accessed on 23 August 2018).
OECD (2018c), Ageing and Employment Policies, http://www.oecd.org/employment/ageingandemploymentpolicies.htm.
OECD (2018d), Pension Funds in Figures, https://www.oecd.org/daf/fin/private-pensions/Pension-Funds-in-Figures-2018.pdf.
OECD (2017a), “Country Profile Hungary ”, in Pensions at a Glance 2017, OECD Publishing, https://www.oecd.org/els/public-pensions/PAG2017-country-profile-Hungary.pdf.
OECD (2017b), Preventing Ageing Unequally, OECD Publishing, Paris, http://dx.doi.org/10.1787/9789264279087-en.
OECD (2017c), The Pursuit of Gender Equality: An Uphill Battle, OECD Publishing, Paris, http://dx.doi.org/10.1787/9789264281318-en.
OECD (2017d), Tackling Wasteful Spending on Health, OECD Publishing, Paris, http://dx.doi.org/10.1787/9789264266414-en.
OECD (2017e), Health at a Glance 2017: OECD Indicators, OECD Publishing, Paris, http://dx.doi.org/10.1787/health_glance-2017-en.
OECD (2016a), OECD Pensions Outlook 2016, OECD Publishing, http://dx.doi.org/10.1787/pens-outlook-2016-en
OECD (2016b), “Economic Survey Hungary 2016”, in OECD Economic Surveys: Hungary 2016, OECD Publishing, Paris.
OECD (2016c), Better Ways to Pay for Health Care, OECD Health Policy Studies, OECD Publishing, Paris, http://dx.doi.org/10.1787/9789264258211-en.
OECD (2016d), Unhealthy Lifestyles Call for Further Tightening of Public Health Policies, http://www.oecd.org/policy-briefs/hungary-unhealthy-lifestyles-public-health-policies_EN.pdf.
OECD (2015a), Pensions at a Glance 2015: OECD and G20 indicators, OECD Publishing, Paris, http://dx.doi.org/10.1787/pension_glance-2015-en.
OECD (2015b), The tax treatment of funded private pension plans: OECD and EU country profiles 2015.
OECD (2014), OECD Pensions Outlook 2014, OECD Publishing.
OECD (2013), OECD Economic Surveys: France 2013, OECD Publishing, Paris, http://dx.doi.org/10.1787/eco_surveys-fra-2013-en.
OECD (2012), OECD Economic Surveys: Hungary 2012, OECD Publishing, Paris, http://dx.doi.org/10.1787/9789264127272-en.
OECD (2010), OECD Economic Surveys: Hungary 2010, OECD Publishing.
OECD (2006), OECD Employment Outlook 2006.
OECD/EU (2016), Health at a Glance: Europe 2016: State of Health in the EU Cycle, OECD Publishing, Paris, http://dx.doi.org/10.1787/9789264265592-en.
OECD/European Observatory on Health Systems and Policies (2017), Hungary: Country Health Profile 2017, State of Health in the EU, http://dx.doi.org/10.1787/9789264283411.
Ono, T., M. Schoenstein and J. Buchan (2014), “Geographic Imbalances in Doctor Supply and Policy Responses”, OECD Health Working Papers, No. 69, OECD Publishing, Paris, http://dx.doi.org/10.1787/5jz5sq5ls1wl-en.
Orosz, É. and Z. Kollányi (2016), Egészségi állapot, egészség-egyenlőtlenségek nemzetközi összehasonlításban [Health status and health inequalities in international comparison], in TÁRKI Társadalmi Riport 2016, Budapest., TÁRKI.
Queisser, M. and E. Whitehouse (2006), “Neutral or Fair?: Actuarial Concepts and Pension-System Design”, OECD Social, Employment and Migration Working Papers, No. 40, OECD Publishing, Paris, http://dx.doi.org/10.1787/351382456457.
Sassi, F. (2015), tackliong Harmful Alcohol Use: Economics and Public Heatlh Policy, OECD Publishing, https://doi.org/10.1787/9789264181069-en.
Simonovits, A. (2014), “Design Errors in Public Pension Systems: The Case of Hungary”, Institute of Economics, Discussion Papers, Vol. MT-DP - 2014/14.
Svraka, A., I. Szabó and V. Hudecz (2014), “Employment stimulating tax incentives in the Hungarian labour market”, Public Finance Quarterly, Vol. 2013/4, pp. 386-402, https://asz.hu/en/public-finance-quarterly/employment-stimulating-tax-incentives-in-the-hungarian-labour-market.
Swiss-Hungarian Cooperation Programme (2017), Public Health Focused Model Programme for Organising Primary Care Services Backed by a Virtual Care Service Centre.
Széman, Z. (2015), “Transition of Long-Term Care in Hungary”, European Journal of Mental Health, Vol. 2015/10, pp. 245–255..
The Pensions Regulator (2018), The Pensions Regulator, http://www.thepensionsregulator.gov.uk/ (accessed on 15 October 2018).
Uzzoli, A. (2016), Health inequalities regarding territorial differences in Hungary by discussing life expectancy.
Zoltán, S. (2014), “The Situation of the SME Sector in Hungary”, Management, Enterprise and Benchmarking – In the 21ST Century, https://kgk.uni-obuda.hu/sites/default/files/06_Szira.pdf.
