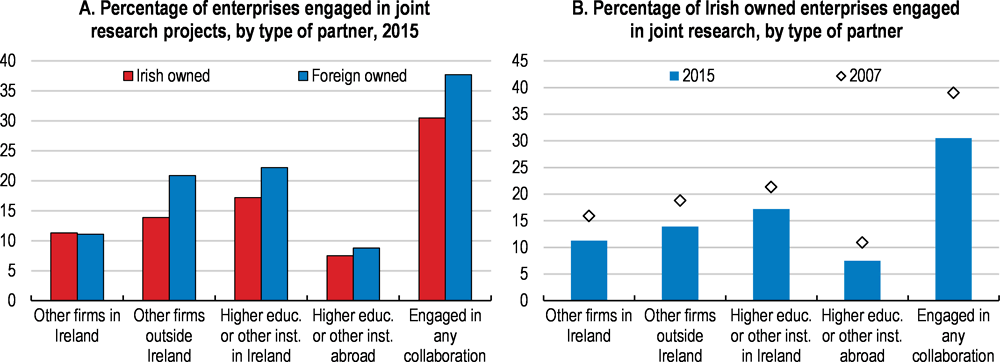
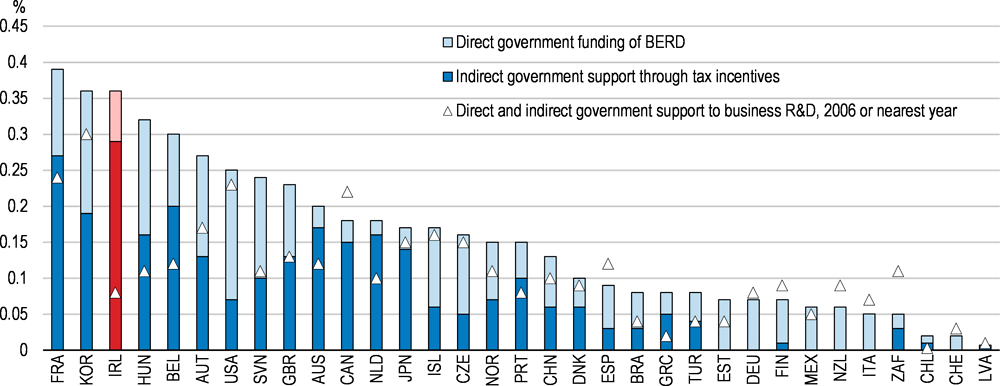
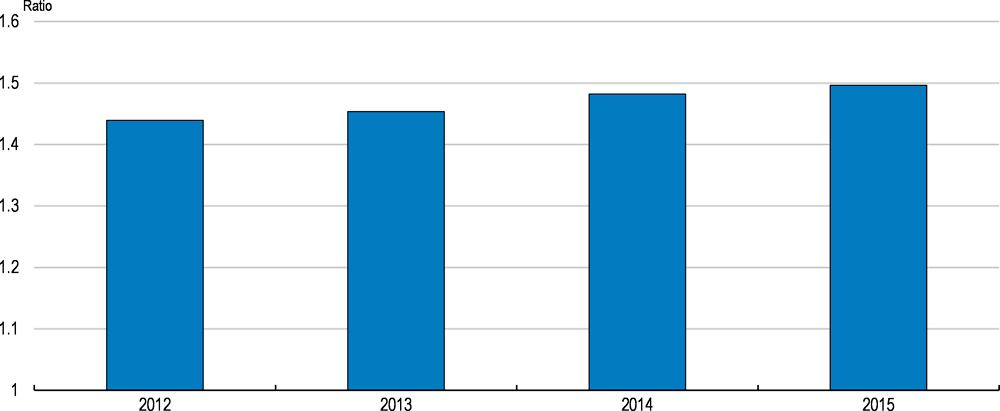
The Irish economy has experienced a decline in productivity growth over the past decade. This has mostly reflected the poor performance of local firms, with the large productivity gap between foreign-owned and local enterprises having widened. Given the mobility of foreign-owned firms, achieving sustainable productivity growth requires addressing productivity stagnation in the local business sector. Government policy should ensure high-potential businesses can enter markets and expand unimpeded, and that the most productive firms thrive in the market. To achieve this, some aspects of the regulatory environment for businesses need to be reformed and the quality of Irish infrastructure improved. Access to finance for high-performing firms must be broadened as well, through restoring credit supply in the banking sector, developing equity finance and improving public financial support. It needs to be assured that government policy is also calibrated to encourage productivity-enhancing knowledge spillovers from frontier firms. Trade linkages and research collaboration between foreign-owned and local firms can be better promoted. However, the ability for local firms to absorb new knowledge relies on their investment in knowledge based capital and managerial skills. These can be promoted by greater direct government funding of business R&D, supporting labour mobility across firms, and worker participation in lifelong learning activities.
OECD Economic Surveys: Ireland 2018

Chapter 1. Reforms for sustainable productivity growth
Abstract
The Irish economy has been among the most successful across the OECD, with living standards rapidly catching up to those of the highest income countries. The cornerstone of its growth model has been to attract highly-productive multinational enterprises. The growth model, however, faces a challenge, as productivity has stagnated among Irish local firms and there has been a widening divergence in productivity performance between multinational enterprises and local firms since the mid-2000s. The presence of multinational enterprises presents an opportunity but also a challenge. Currently, the diffusion of knowledge and technology to local firms is weak and in some instances local firms are crowded-out by multinational enterprises. International competition to attract multinational enterprises is also strong, suggesting that the long-term sustainability of the economy could be dependent on the performance of local businesses.
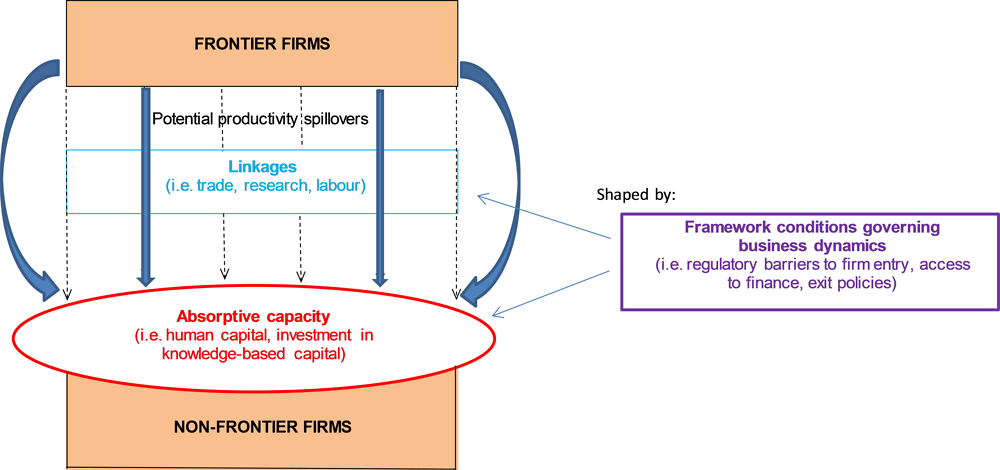
For more rapid and sustainable productivity growth, government policy should aim to enhance knowledge spillovers from frontier firms to the rest of the economy (Figure 1.1). Such spillovers are the single most important driver of productivity growth in the long run (Johansson et al., 2013). First and foremost, spillovers are conditional on a country’s policy settings (Johansson et al., 2013) and shaped by business dynamism and the efficiency of resource allocation (OECD, 2015a). More directly, spillovers are maximised by tighter linkages in terms of trade, research (with both frontier firms and universities) and labour between frontier and laggard – which are usually local – firms. Nevertheless, the productivity gains of such linkages can only be realised if the latter have the capacity to absorb the new ideas and technologies utilised by frontier enterprises. To build such capacity, investment in knowledge-based capital and human capital by local firms is key (OECD, 2015a). Reforming policy settings in these areas would give the Irish economy a better opportunity of leveraging the performance of multinational enterprises, thereby raising living standards further.
Figure 1.1. A stylised depiction of the factors impacting the magnitude of productivity spillovers
Productivity among local firms has stagnated
Productivity trends in Ireland
Aggregate productivity in Ireland has slowed over the past 15 years. Labour productivity rose by above 4% in annual average terms between 1994 and 2006, which slowed to below 2½ per cent between 2006 and 2014 (Figure 1.2). This is due to the marked decline in multifactor productivity (MFP) growth, which more than offset the contribution from the substantial rise in capital deepening over the post-2006 period. Although MFP has been continuing to rise, the decline in its growth rate highlights slower efficiency improvements in production processes.
Figure 1.2. Trend productivity growth has slowed
Index, 2000=100
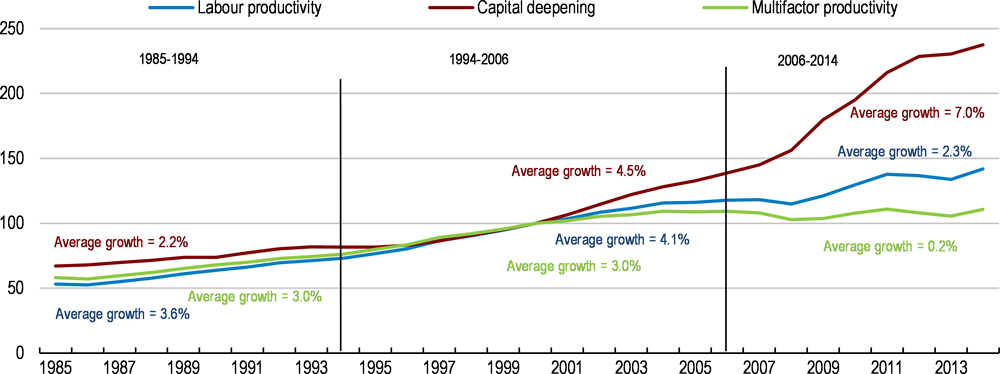
Note: Labour productivity is calculated as GDP per hour worked. Labour productivity growth can be broken down into the contribution from multifactor productivity growth and capital deepening, with the latter weighted by its income share. Growth in capital deepening is measured as the growth in the aggregate flow of capital services minus the growth in aggregate hours worked. Multifactor productivity growth is measured as the difference between the change in GDP and the change in measured inputs (capital and labour), where the inputs are weighted by their respective cost shares.
Source: OECD Productivity Database.
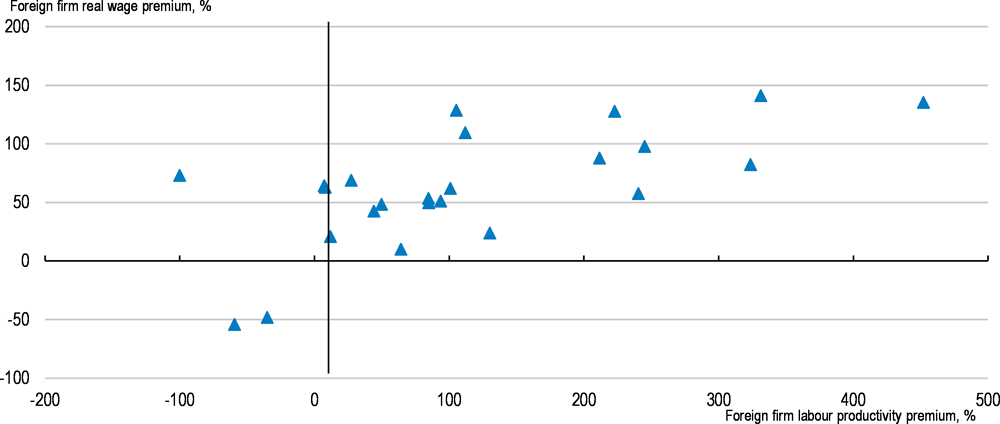
Looking beneath the aggregate trends, new firm-level analysis highlights that the majority of businesses have actually experienced falling productivity in the period since 2006 (Figure 1.3; Department of Finance, 2018). This has been especially apparent in the services sector. The rise in aggregate productivity (highlighted in Figure 1.2) has relied on the performance of a group of very large successful firms and is consistent with rising dispersion in productivity between Ireland’s foreign-owned and local firms in most industries (Figure 1.4). The disparity in productivity levels between these two types of firms has tended to translate into gaps in wages (Figure 1.5), stoking Ireland’s very high level of market income inequality.
Figure 1.3. Most businesses have experienced a decline in productivity
Median firm productivity (Index 2006 = 100)
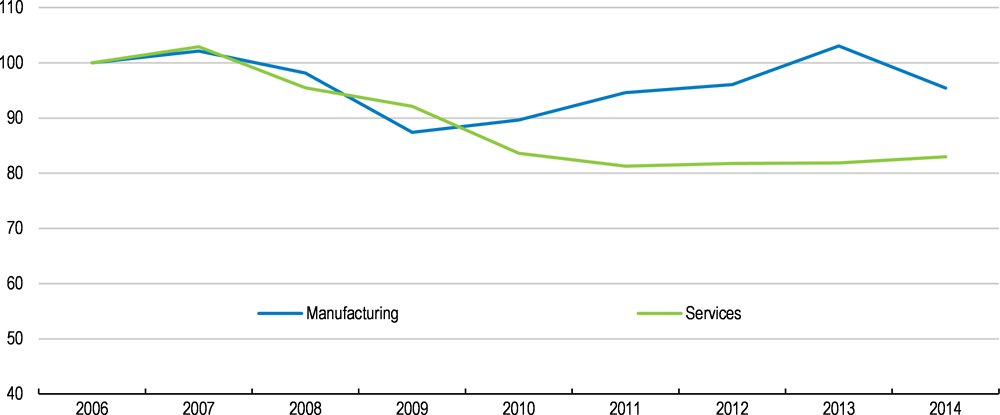
Note: The figure above shows multifactor productivity (using the Solow method) of the median firm in the productivity distribution at each point in time. These results are consistent with labour productivity estimates based on both micro and macro data.
Source: Department of Finance (2018).
Figure 1.4. Foreign-owned firms tend to be more productive
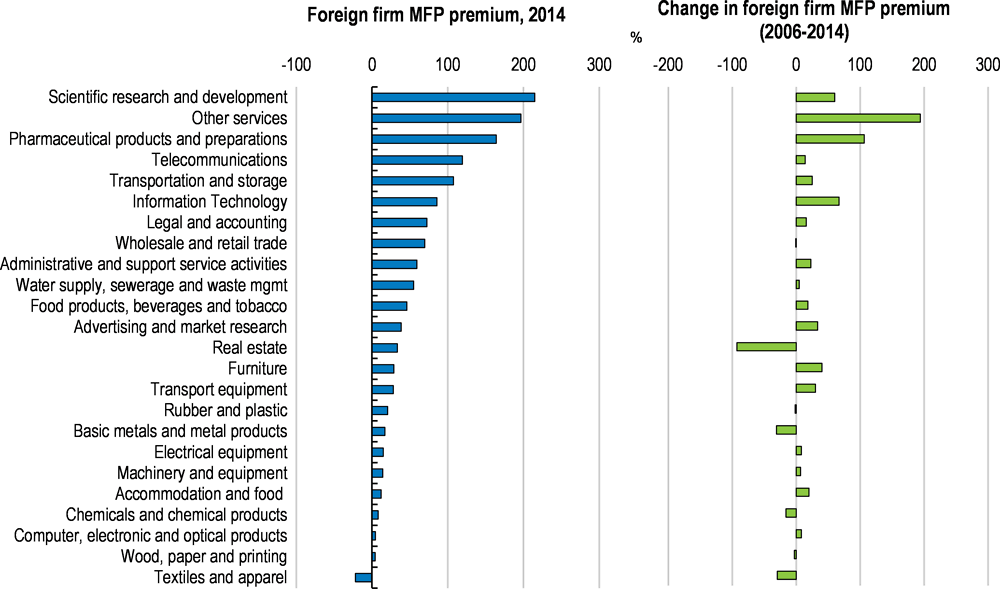
Note: The “Foreign firm MFP premium” is the percentage point difference between the multifactor productivity level (using the Solow method) of foreign firms and that of local firms in the given industry. Reflecting data availability, the change in foreign firm MFP premium is calculated between 2008 and 2014 for the telecommunications industry and 2010 and 2014 for the water supply, sewerage and waste management industry.
Source: OECD MultiProd.
Figure 1.5. Wages are substantially higher in foreign firms
Foreign firm premium over local firms for wages and labour productivity, by industry, 2014
Forces at the firm level
The Irish economy has strong productivity potential, as some parts already exhibit high levels of innovation and entrepreneurial activity. For example, against the backdrop of high-performing multinational enterprises in the ICT sector, Ireland has the highest share of ICT-related domestic value added in the OECD (accounting for 14% of GDP; OECD, 2017a). The country also has a relatively high share of patents in high-tech industries, namely communication and medical devices (OECD, 2015b). The share of firms adopting innovation strategies is also elevated, including among small businesses (Figure 1.6). However, as evidenced by the productivity trends just highlighted, these strengths have not translated into ongoing improvements in macroeconomic performance.
Figure 1.6. The share of SMEs adopting innovation strategies is high
Firms undertaking an innovation strategy as a % of all firms in each size category
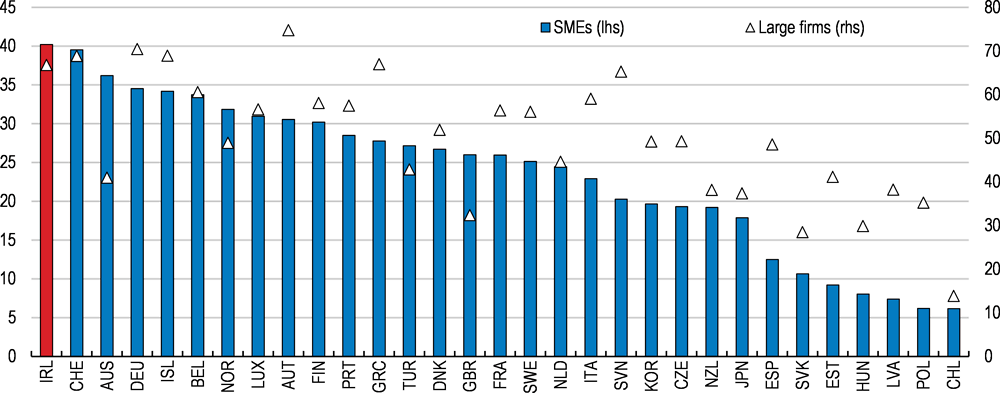
Note: The chart is based on national innovation surveys on “product or process” and “marketing or organisational” innovation strategies. The chart shows the share of firms adopting both types of innovation strategy.
Source: OECD STI Scoreboard 2017 (database).
An aggregate productivity slowdown among OECD economies over the past decade has been linked to declining business dynamism and rising misallocation of resources (OECD, 2016a). Business dynamism, typically proxied by firm start-up and exit rates, enhances market discipline and promotes better allocation of resources. In turn, the efficiency of resource allocation boosts business dynamism, allowing high potential businesses to enter markets and grow easily (OECD, 2015a). Both the extent of business dynamism and the efficiency of resource allocation condition knowledge spillovers from frontier firms (Figure 1.1).
In Ireland, the firm entry rate is low but the firm exit rate is even lower (Figure 1.7). Firm entry is important since young firms have a comparative advantage in radical innovations and they encourage incumbents to innovate through competitive pressures, which raises aggregate productivity. Despite low rates of firm entry, the survival rate is high in Ireland, thus firms are old on average. A high survival rate could be an indication that the selection of firms at entry is efficient. However, if a high survival rate is due to inefficiencies at the exit margin, it suggests that the market selection mechanism is weak (OECD, 2015a).
Figure 1.7. Both the firm entry rate and exit rate are low in Ireland
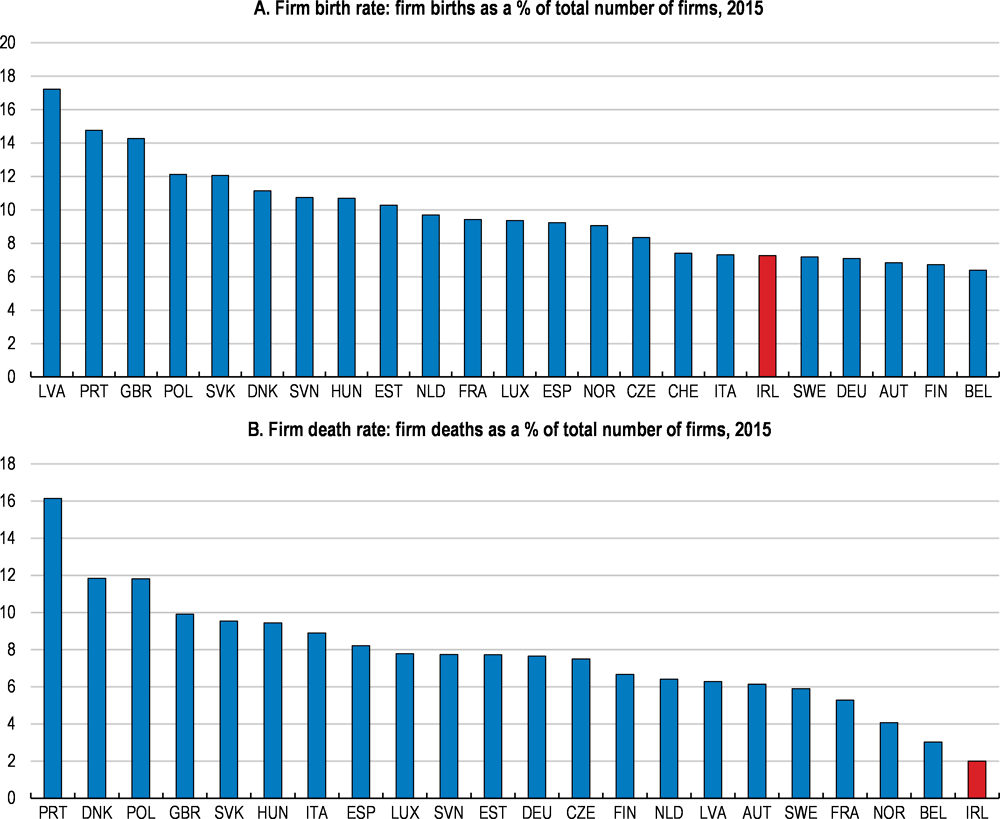
Note: In Panel A: 2014 for Denmark, Portugal, Switzerland and the United Kingdom. In Panel B: 2014 for Denmark and Poland; 2013 for Portugal and the United Kingdom.
Source: Eurostat (2017), Business Demography (database).
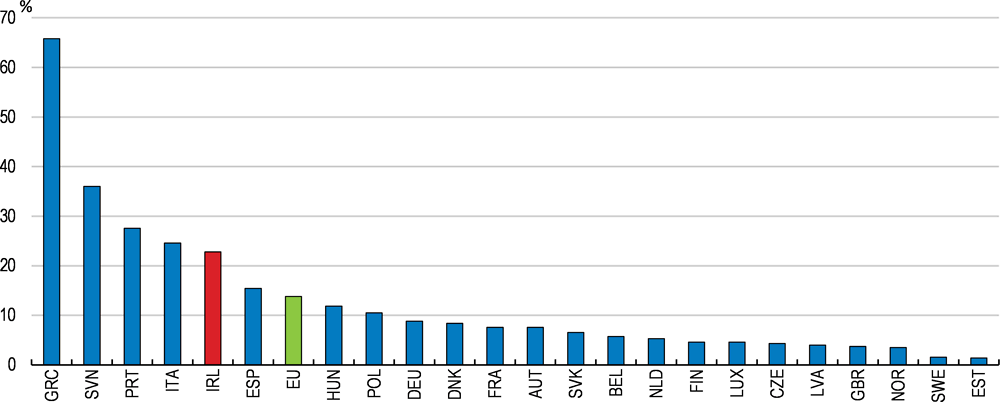
Weak market selection can lead to unproductive firms lingering in the market, weighing on the performance of the economy. Non-viable firms ‒ those kept alive by forbearance loans but otherwise insolvent ‒ trap scarce resources and hinder the growth prospects of young and innovative firms (Caballero et al., 2008). Such non-viable firms have reduced the investment and employment growth of healthy firms in many OECD countries over the past decade (Adalet McGowan et al., 2017a). In Ireland, default rates among Irish SMEs have been higher than their counterparts in many other EU countries over the past years (Figure 1.8). Most defaulted loans have experienced a breach of loan terms and forbearance has frequently been granted (Bank of Ireland, 2017). The prevalence of non-viable firms weakens the efficiency of resource allocation. This is because such firms trap resources that could otherwise be allocated to enable highly-productive businesses to expand.
Figure 1.8. Default rates are high for Irish SMEs
SME default rate by country, 2017Q2
Source: European Banking Authority (EBA), “Risk Assessment Report of the European Banking System, November 2017”.
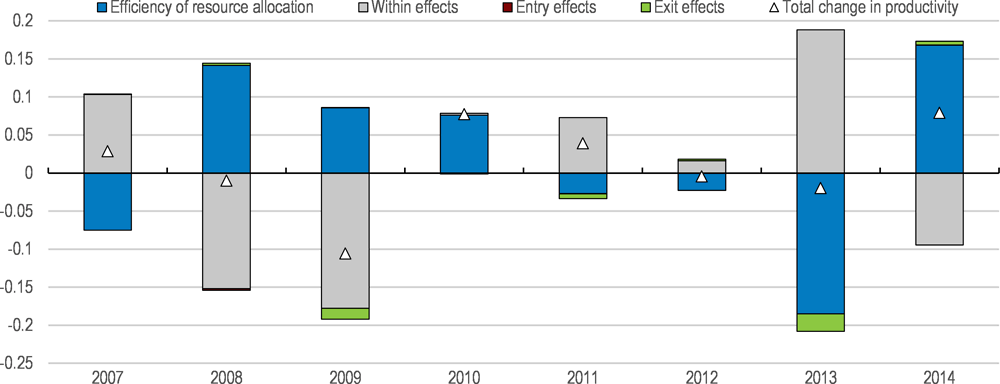
At first glance, the efficiency of resource allocation in Ireland appears to be very high (Box 1.1). However, this result owes largely to highly productive multinational enterprises (MNEs) that can raise a huge amount of resources from different channels, including from abroad. Once the MNE dominated sectors have been excluded, the efficiency of resource allocation in the Irish economy is greatly reduced and lags that of other OECD countries (Figure 1.9). Distinguishing between the results including or excluding MNEs is particularly important for Ireland since the MNE dominated sectors account for around 40% of total production in the economy, much higher than in most other countries. The contribution of resource reallocation to productivity growth has also weakened, while that of firm entry and exit has been negligible (reflecting the very limited firm entry and exit rates) over the past decade (Figure 1.10).
Box 1.1. Productivity analysis using OECD MultiProd
The OECD MultiProd project provides a comprehensive picture of productivity patterns across countries over the last two decades. The MultiProd project is part of a larger effort within the OECD Directorate for Science, Technology and Innovation to exploit existing official firm-level data (official surveys and administrative sources) in a harmonised framework to provide micro-aggregated statistics and analysis that are comparable across countries (see Berlingieri et al., 2017 for more details).
The MultiProd project collects statistics of 18 countries which have been successfully incorporated in the MultiProd database for the 1994-2012 period. A joint project between the OECD and the Department of Finance of Ireland was undertaken in parallel with this Economic Survey to include Ireland in the dataset.
The project provides a series of productivity metrics (Department of Finance, 2018). It focuses on, in particular, measures relating to industry concentration, productivity dispersion across firms, and the efficiency of resource allocation.
Efficiency of resource allocation
The Olley-Pakes decomposition used in MultiProd decomposes aggregate productivity into the contribution of two terms, an unweighted productivity term representing average firm level productivity, and a covariance term that links productivity to firm size (defined by employment shares). The latter term (known as the OP gap) is a measure of allocative efficiency, since it increases if more productive firms capture a larger share of resources in the sector:
is sectoral level productivity at time t, N represents the number of firms in a sector, is the share of firm i at time t, is the productivity of firm i at time t, and and are sectoral averages.
Figure 1.9 shows, in the Irish manufacturing sector, more than half of aggregate labour productivity is accounted for by the allocative efficiency term (OP gap) over the whole 2006-2014 period. The remaining part of aggregate productivity in manufacturing is accounted for by within-firm productivity. On the whole, Ireland’s OP gap indicates a high degree of allocative efficiency.
Figure 1.9. The efficiency of resource allocation is weaker for local firms
Labour productivity of firms in the manufacturing sector
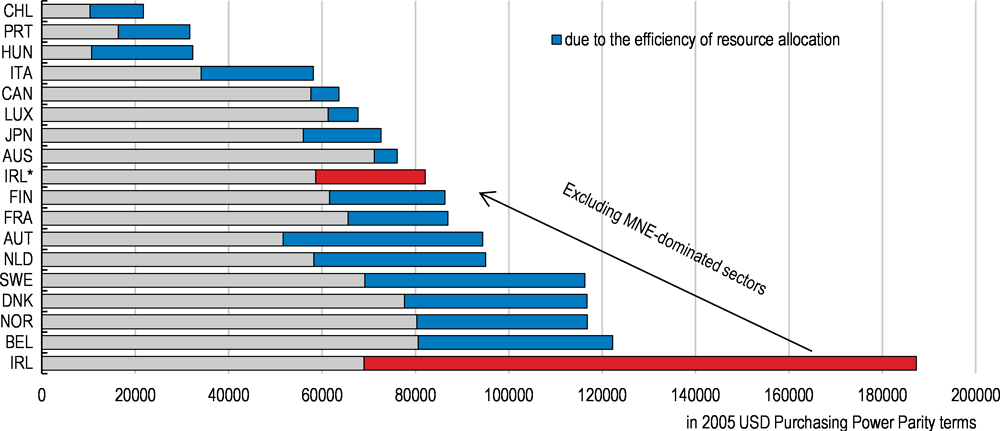
Note: “IRL” covers all firms including multinational enterprises (MNEs); “IRL*” excludes those in the MNEs dominated sectors.
Source: Department of Finance (2018) based on the MultiProd dataset.
Figure 1.9 also shows the OP gap for manufacturing when foreign-owned multinational enterprise (MNE) dominated sectors are excluded (“IRL*”). Relative to the full manufacturing sample, the exclusion of foreign-owned MNE dominated sectors results in a much lower OP gap. These results suggest that a substantial part of aggregate labour productivity in the manufacturing sector is due to the presence of large multinational firms that have high productivity.
Changes in the efficiency of resource allocation
A dynamic version of the OP gap, as developed by Melitz and Polanec (2015), is presented below, for the manufacturing sector. This approach decomposes the contributions to the growth in labour productivity into four elements:
where is sectoral level productivity, and , , are the weighted productivity averages of, respectively, entrants, incumbents and exitors computed in the relevant time period. The first term is the change in the unweighted productivity average of incumbents, representing within firm growth in productivity; the second term is the change in the efficiency of resource allocation (i.e. the change in the OP covariance term) computed for incumbents; the third term is the contribution of the productivity of new firms relative to average productivity and; the fourth term is the contribution of the productivity of exiting firms relative to average productivity of the previous period.
Overall the annual changes in labour productivity growth in manufacturing were driven by within-firm productivity changes by incumbents and reallocation over the period 2006-2014. The contribution of firm entry and exit (on an annual basis) to labour productivity growth has been negligible and sometimes negative.
Figure 1.10. A decline in the efficiency of resource allocation has pulled down aggregate productivity
Annual growth rate of productivity and the contribution of its components, Manufacturing sector, change in log points
Linkages between foreign- and locally-owned firms
Impediments to firm growth may lower the incentive or ability for local firms to create linkages with highly productive foreign-owned enterprises. In turn, weak linkages lower the potential for productivity spillovers. Trade linkages, expressed as the intensity of supply chains between foreign- and locally-owned firms, are weak. Local firms can be incorporated into the supply chains of foreign-owned firms by either providing intermediate inputs in their production processes (i.e. a “backward linkage”) or using the inputs of foreign-owned firms as inputs to their operations (i.e. a “forward linkage”).
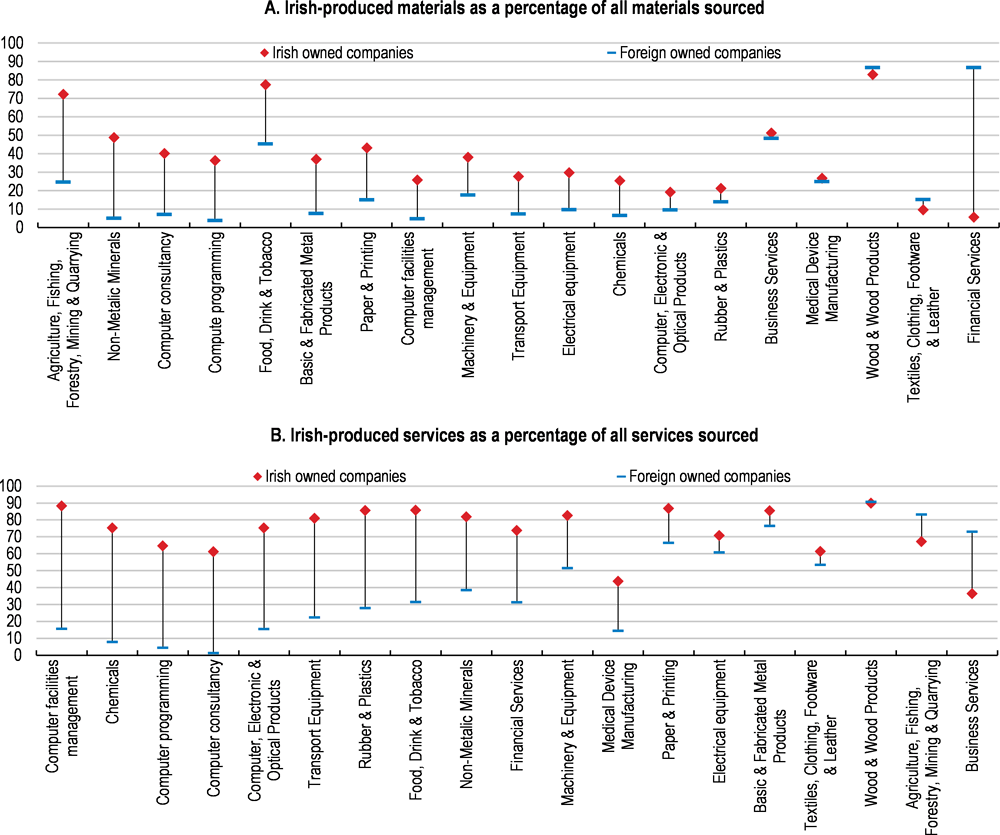
Foreign-owned firms are far less likely than Irish-owned firms to source production inputs locally (Figure 1.11). In some cases this may reflect foreign-owned subsidiaries not having full autonomy over procurement decisions, but the differences in sourcing behaviour are vast: around 65% of the material inputs of surveyed Irish-owned manufacturers were locally sourced in 2015 compared with 14% for foreign-owned manufacturers. Focusing on services inputs, over 80% of those used by surveyed Irish-owned manufacturers were sourced from Irish companies in 2015 compared to 12% by foreign-owned manufacturers.
Figure 1.11. Foreign-owned firms are much less likely to source production inputs from Ireland
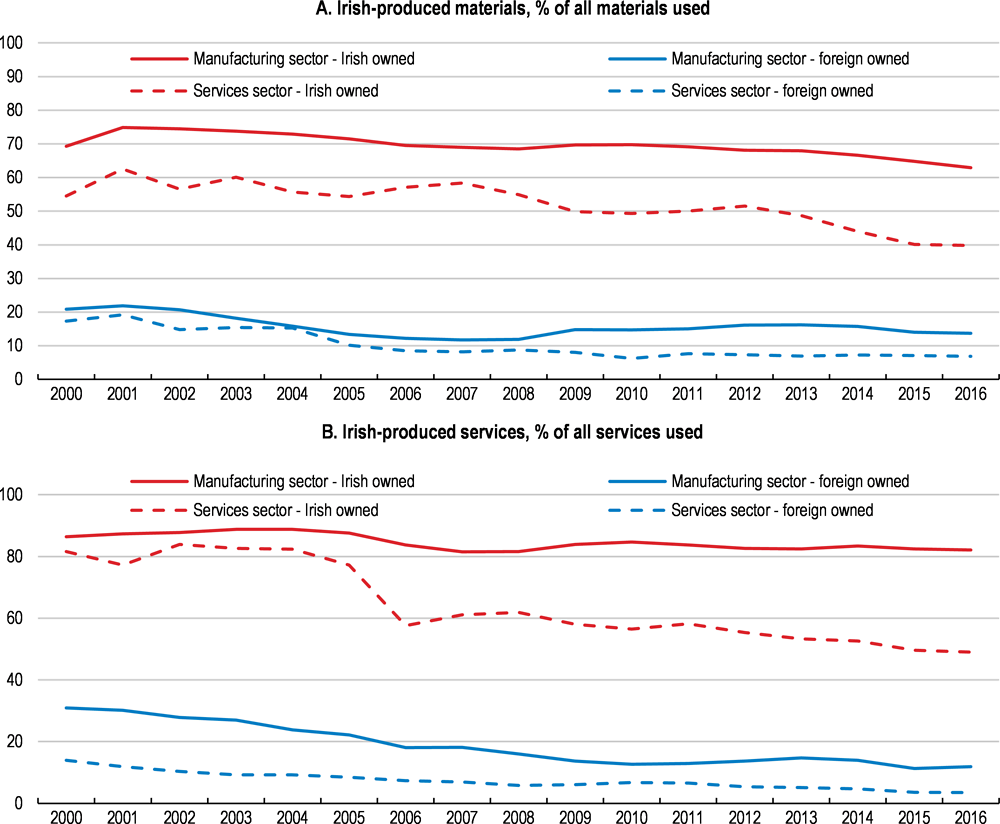
Note: Data are based on a survey of around 4200 companies that are clients of either Enterprise Ireland, IDA Ireland or Údarás na Gaeltachta that have at least ten employees.
Source: Department of Business, Enterprise and Innovation.
There are disparities across more narrowly-defined industries in the extent to which differences exist in the sourcing behaviour of Irish-owned and foreign firms. There is a large gap in the degree of local sourcing in large manufacturing industries such as food, drink and tobacco (Figure 1.12). Similarly, in many key industries in the services sector, the extent of inputs sourced domestically is much lower for foreign-owned firms. This is particularly the case in some high-tech industries such as computer consultancy and computer programming.
Figure 1.12. Disparities in the sourcing behaviour of foreign and local firms differ by sector
Not only are trade linkages weak, but productivity spillovers from foreign-owned to local firms are modest. New analysis using Irish firm level data finds some evidence of positive productivity spillovers from the presence of foreign-owned firms in the services sector, but minimal (and sometimes negative) spillovers in the manufacturing sector (Box 1.2; Di Ubaldo, Lawless and Siedschlag, 2018). Furthermore, on average, trade linkages between foreign and locally-owned firms appear to have negligible positive productivity effects on the latter. Nonetheless, such linkages do appear to produce productivity spillovers for services firms with high absorptive capacity (captured by R&D investment).
Box 1.2. Estimating productivity spillovers from firm-level data
Ireland has been highly successful at attracting foreign direct investment, with foreign-owned firms accounting for close to half the country’s gross value added over recent years. One of the rationales for attracting such investment is the positive spillovers that foreign-owned firms may confer to local businesses. Abstracting from the impact of heightened competition from the entry of foreign firms (the productivity effect of which is theoretically unclear), a key channel through which such spillovers proliferate is the diffusion of new knowledge. As foreign firms are at a disadvantage to local businesses due to distance from their parent and limited knowledge of the local market, their ability to compete must be due to possessing firm-specific assets such as superior production technology, know-how or management strategy (Görg, 2007). Such assets often have public good characteristics as they can be used in the production processes of other entities at no additional cost.
To explore the extent to which productivity spillovers are apparent in Ireland, Di Ubaldo, Lawless and Siedschlag (2018) incorporate the firm-level multifactor productivity estimates from the OECD MultiProd project (detailed in Department of Finance, 2018) into an econometric model.
The analysis confirms that foreign-owned firms are more productive than Irish-owned firms on average, meaning that there is potential for positive productivity spillovers. To highlight this, a regression model is estimated which explains multifactor productivity at the firm level by ownership status (i.e. foreign vs local-owned) while controlling for firm size, industry and region-specific time invariant factors as well as common factors that vary over time across all firms. The results suggest that a foreign ownership firm premium in Ireland exists (Table 1.1). This is the case across both the manufacturing and services sectors and for foreign affiliates owned by firms based in both the European Union and non-European Union countries. The estimates indicate that the foreign ownership premium is around 26% on average for firms from EU countries and 39% for those from outside the EU.
Table 1.1. Estimating the foreign ownership productivity premium
|
|
Log(Multifactor productivity) |
||
|---|---|---|---|
|
Variable name |
All |
Manufacturing |
Services |
|
Foreign-owned firm (EU origin) |
0.23*** |
0.09*** |
0.26*** |
|
Foreign-owned firm (non-EU origin) |
0.33*** |
0.17*** |
0.39*** |
|
Small size |
0.00 |
-0.03*** |
0.03*** |
|
Medium size |
0.02*** |
-0.02* |
0.06*** |
|
Large size |
0.01 |
0.03* |
0.03** |
|
Constant |
2.17*** |
2.22*** |
3.46*** |
|
Observations |
70663 |
13668 |
51843 |
Note: *** represents statistical significance at the 1% level, ** at the 5% level and * at the 10% level. All regressions include industry, region and time fixed effects. The reference category for firm size is micro firms (firms having less than 10 employees).
The extent of productivity spillovers is then investigated by estimating if the MFP of local firms is impacted by the presence of and interactions with foreign-owned businesses. Such spillovers may come about through competition and learning effects from a strong presence of foreign-owned firms in the same sector of activity or vertical supply chain relationships (for further discussion, see Di Ubaldo, Lawless and Siedschlag, 2018). Each of these potential channels is specified in the empirical framework and tested through firm-level regressions on an unbalanced panel across the 2008-2014 period.
The estimation results highlight positive productivity spillovers in the services sector, but minimal (and sometimes negative) spillovers to locally-owned manufacturing firms (Table 2). The differential impact between sectors may be because productivity-improving processes or technologies are more observable to other industry participants in the services sector without direct technology transfer needing to occur (Di Ubaldo, Lawless and Siedschlag, 2018).
The estimation results also highlight the importance of absorptive capacity of local firms in maximizing productivity spillovers from foreign-owned businesses. On average, the productivity impact of having forward (foreign-owned firms supplying local firms) or backward (local firms supplying foreign-owned firms) trade linkages with industries that have a high share of foreign-owned firms is not discernable. However, there is evidence that indigenous services firms that invest in R&D are better able to internalise productivity spillovers. Column (6) of Table 1.2 highlights that this is the case when indigenous firms in upstream sectors supply to foreign-owned businesses in downstream sectors.
Table 1.2. Estimating productivity spillovers
|
|
Log(Multifactor productivity – local firms) |
|||||
|---|---|---|---|---|---|---|
|
Variable name |
Manufacturing |
Services |
||||
|
(1) |
(2) |
(3) |
(4) |
(5) |
(6) |
|
|
Intra-industry |
-0.1* |
-0.03 |
0.01 |
0.3*** |
0.2** |
0.2** |
|
Intra-industry*R&D |
0.4 |
0.08** |
||||
|
Intra-region |
-0.1 |
-0.1 |
-0.1 |
0.03 |
0.03 |
0.03 |
|
Intra-region*R&D |
0.0 |
-0.06* |
||||
|
Forward linkage |
-2.2 |
-2.0 |
0.2 |
0.1 |
||
|
Forward linkage*R&D |
7.9 |
0.1 |
||||
|
Backward linkage |
-.3 |
0.3 |
-0.8 |
-0.8 |
||
|
Backward linkage*R&D |
-1.2 |
0.2*** |
||||
|
Constant |
2.0*** |
2.0*** |
2.0*** |
-0.5 |
-0.3 |
-0.4 |
|
Observations |
6719 |
6560 |
6560 |
14580 |
14530 |
14530 |
Note: *** represents statistical significance at the 1% level, ** at the 5% level and * at the 10% level. All regressions include industry, region and time fixed effects, as well as variables for industry growth, export and import status (introduced as a dummy variable that equals one if the firm exports/imports), industry concentration (proxied by the Herfindahl-Hirschman index), firm age, average wage at the firm (in log values), the R&D investment intensity of the firm (R&D investment per employee in log values) and dummy variables corresponding with firm size (i.e. “small”, “medium” and “large” as appearing in Table 1.1). The estimated coefficients on these variables can be found in Di Ubaldo, Lawless and Siedschlag (2018) or from those authors upon request. Forward linkages are measured using information from Ireland’s input-output tables while the measure of backward linkages uses information from the home country of the parent company of foreign affiliates to account for the specific input sourcing behaviour of multinationals.
To summarise the identified trends, Irish productivity growth has stagnated over the past decade, with the performance of local firms especially weak. This partly reflects a decline in the efficiency of resource allocation associated with weak business dynamism: while allocative efficiency is relatively high overall, it has had a declining impact on productivity growth over the period, with firm entry and exit having had very little impact on the productivity performance of the Irish economy. There is also evidence that the efficiency of resource allocation is notably weaker in those parts of the economy dominated by local firms. Given Ireland’s high share of multinational enterprises, there is potential for virtuous productivity spillovers from high-productivity foreign firms to local businesses. Nevertheless, supply chain linkages are limited and there is little evidence of knowledge spillovers between foreign and local firms in most instances. Against this backdrop, those aspects of government policy that impact upon firm entry and exit, the growth of high potential firms and the interactions between foreign businesses and local firms need to be examined.
Enhancing business dynamism
Reducing regulatory barriers for businesses
Well-functioning product markets ensure that high-potential businesses can enter markets and expand unimpeded. Reducing anti-competitive regulations facilitates more entry of young firms which tend to have a comparative advantage in commercialising and adopting new technologies (OECD, 2015a). It also strengthens market discipline, as new entrants create competitive pressures for incumbents to adopt innovations and reduce business costs. Reforms to reduce anti-competitive regulations enhance the market selection mechanism and the efficiency of resource allocation, boosting aggregate productivity (OECD, 2015a).
Ireland is a country where doing business is easy on average, ranking 17th in the world according to the World Bank’s Doing Business indicators. This owes largely to its low corporate tax rate and the fact that there are few barriers to entry for foreign firms, making the economy very open one for trade and foreign direct investment (FDI; Figure 1.13). However, regulatory obstacles inhibit the start-up and growth of small local businesses, reflected in the OECD Product Market Regulation (PMR) indicators for barriers to entrepreneurship (Figure 1.13). Such obstacles are particularly concentrated in the utility and legal services sectors.
Figure 1.13. Regulatory barriers are low overall but some barriers to entrepreneurship exist
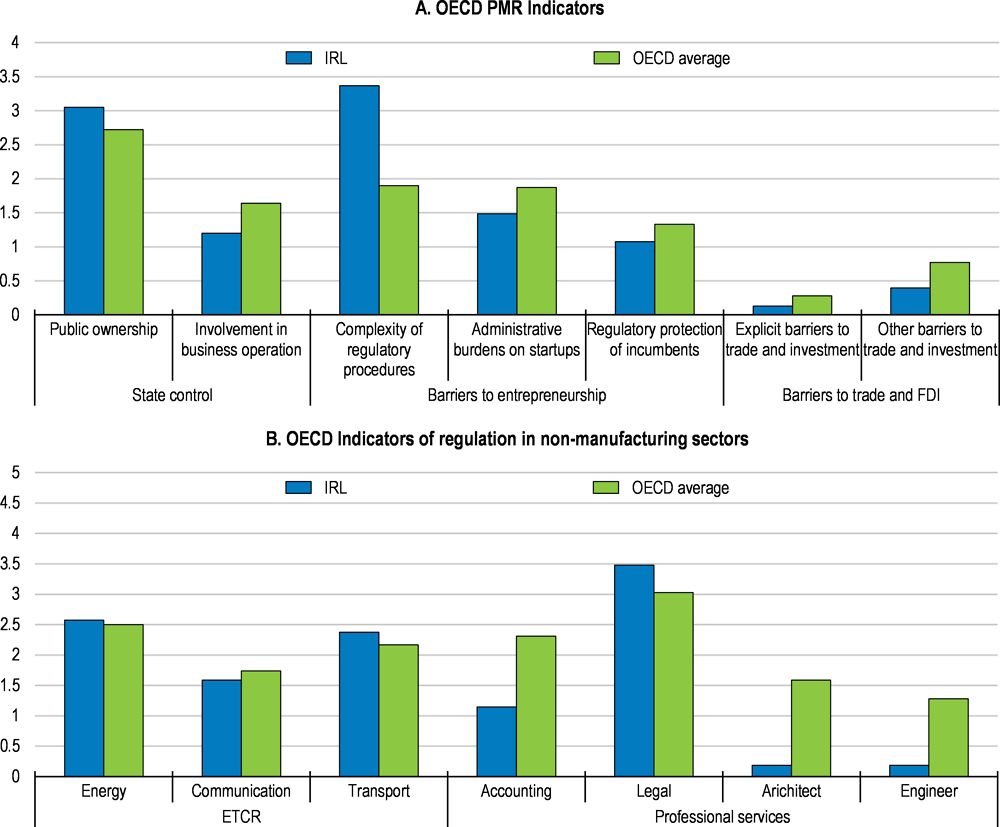
Note: The OECD Indicators of Product Market Regulation are a comprehensive and internationally-comparable set of indicators that measure the degree to which policies promote or inhibit competition. The indicator ranges from zero (least stringent) to six (most stringent).
Source: OECD Product Market Regulations Statistics (database).
Entry regulations
Relatively high barriers to entrepreneurship come largely in the form of the complexity of Ireland’s licence and permits system (Figure 1.13). This is mainly because of the currently limited scope of points of single contact (“one-stop shops”) providing an interface between different spheres of competence. Although points of single contact for getting information on notifications and licences do exist, they were not available at the local level or via the Internet until recently. Furthermore, no point of single contact existed for issuing or accepting all licences required for opening a business.
Ireland introduced the Integrated Licence Application Service (ILAS) in early 2016. The service is on-line and expected to provide a single point of contact for all businesses to apply for, renew and pay for licences. Although it is not yet fully operational, 5 000 business users have already registered on the service, which connects seven licensing authorities across ten licence types. The government should fully roll out the ILAS, extending the system to include as many licensing authorities as possible, which will greatly reduce the administrative burden on small businesses.
Other administrative burdens, notably those related to commercial property, also weigh on entrepreneurship. It costs approximately 3.5 times the OECD average to obtain a planning permit from the local authorities (Figure 1.14). Stamp duty for the registration of property, which is paid to the national tax authority, is also costly, amounting to around 2% of the value of the property. These initial costs (planning charges and property registration) should be reduced, as they raise the barriers to entrepreneurship and distort investment decisions, as discussed in previous Economic Surveys.
Figure 1.14. The cost of construction permits is high in Ireland
Cost (% of structure value), 2016
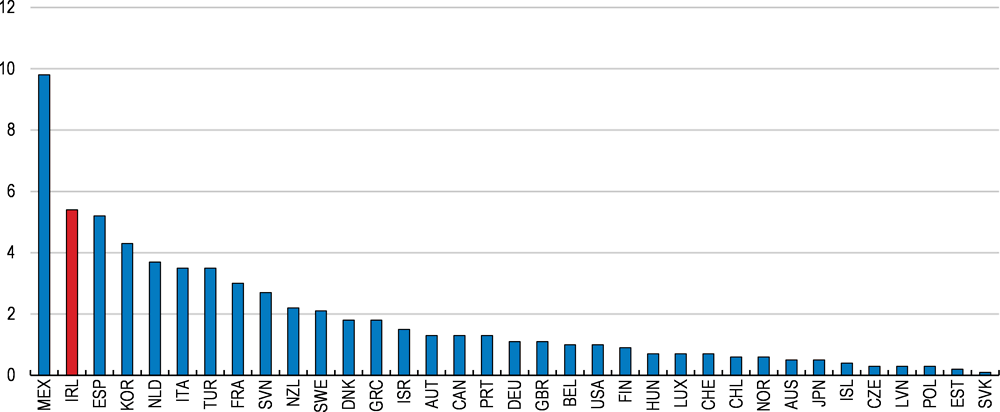
Note: World Bank Doing Business records all procedures required for a business in the construction industry to build a warehouse of a given size. The procedures include, among others, obtaining and submitting all relevant project-specific documents (for example, building plans, site maps and certificates of urbanism) to the authorities. Cost is recorded as a percentage of the warehouse value (assumed to be 50 times income per capita).
Source: World Bank Doing Business (2017).
Not only initial costs, but also recurrent costs related to commercial property are high. Firms pay “commercial rates”, which are levied by local authorities and are based on the value of the property a firm – which is not necessarily the property owner – occupies. The valuation of properties is determined by the Commissioner of Valuation Rates. The “annual rate on valuation” is decided by local authorities. In the case of Dublin City Council, it amounted to 26% of the value of a property in early 2017. Such a system especially penalises innovative young firms as they are often in a loss-making position in their early years. Commercial rates should be abolished (as well as potentially the local property tax) and replaced by a broad-based land tax which covers at least commercial and residential property (see Key Policy Insights section). This would be less distortionary to production activity, especially for entrepreneurial firms, and could be designed in a way that preserves overall government tax receipts.
Conduct regulations
Regulations in the services sector often have “knock-on effects” to other sectors, through trade linkages in the economy (Conway and Nicoletti, 2006). Tackling inefficient regulations in the services sector can reduce the price of intermediate inputs and/or raise the quality of products. It also allows businesses to gain greater benefits from participating in global value chains (GVCs) to the extent that they rely on domestic services (OECD, 2015a). OECD indicators of regulation in non-manufacturing sectors identify excessively stringent regulations in energy and legal services (Figure 1.13, Panel B). The Irish authorities also identify high costs in these sectors (NCC, 2017).
Electricity
Ireland’s electricity prices are high, with energy and network costs above many other EU countries (Figure 1.15). The energy component accounts for a large share of total electricity prices consisting of the expense of purchasing electricity on the wholesale market and the cost of electricity supply to consumers. The cost of purchasing electricity is largely determined by external conditions because of Ireland’s dependence on foreign energy sources. However, high energy costs can be explained by either price regulation or the lack of unbundling (ACER, 2016), and Ireland’s lack of unbundling can at least partly explain its overall high electricity prices.
Figure 1.15. Electricity costs are high in Ireland
Final price for the consumption of 3 500 kWh per household annually in the capital city
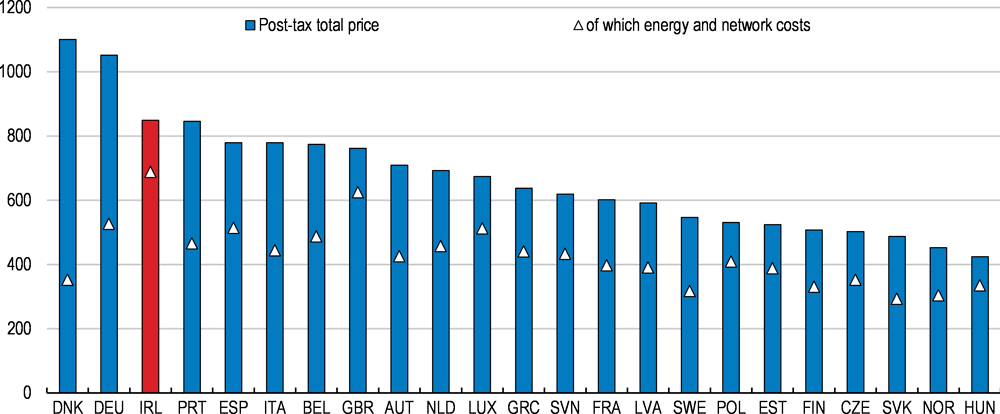
Note: The post-tax total price is broken down into: the energy component which consists of the cost of purchasing electricity on the wholesale market and the cost of retailers for supplying electricity to household consumers; the cost of network distribution; the cost of network transmission; energy taxes and charges; other taxes and charges; VAT; and the charges relating to support schemes for renewable energy sources.
Source: Agency for the Cooperation of Energy Regulators (2016).
The Irish energy sector is still characterised by relatively strong public ownership and vertical integration (Figure 1.13). In the electricity sector, the state owns virtually 100% of shares in the Electricity Supply Board (ESB), the only firm in the sector until the late 1990s. The ESB group owns the transmission and distribution networks (ESB Networks Limited, a legally separate body) and operates distribution (ESB). Eirgrid, which was established in 2006 and is also state-owned, operates transmission (the “independent system operator” model). ESB Networks Limited, which owns the transmission and distribution networks, does not have any significant assets or personnel, as these both lie within ESB Network, a ring-fenced business unit of the ESB group. The generation and supply segments are now open to competition, but ESB remains a major player in both segments, accounting for a market share of 47% and 51%, respectively.
In its decision to certify Eirgrid as the transmission operator, the European Commission made some proposals to make more effective and efficient transmission operations and governance arrangements (European Commission, 2013). The Commission found that the current arrangement, comprising ESB Networks (ESB’s business unit) and ESB Networks Limited (a separate legal entity), blurs the lines between transmission activities on the one hand and generation and supply activities on the other. The Commission made a number of proposals, including separating the ownership regime between Eirgrid and ESB, or ensuring that ESB’s transmission roles are in a single, separate entity. The authorities are currently assessing these proposals within the context of various other programmes.
Legal Services
Among professional services, regulations on legal services are particularly high (Figure 1.13), leading to high costs in the sector (Figure 1.16). This stringency is due to regulations restricting the form of legal business to sole proprietorship and prohibiting inter-professional co-operation in most cases. The professional fees charged by lawyers vary largely for common services such as conveyancing transaction, and a lack of price transparency for legal services prevails (CCPC, 2012).
Figure 1.16. The costs in the legal services sector are high in Ireland
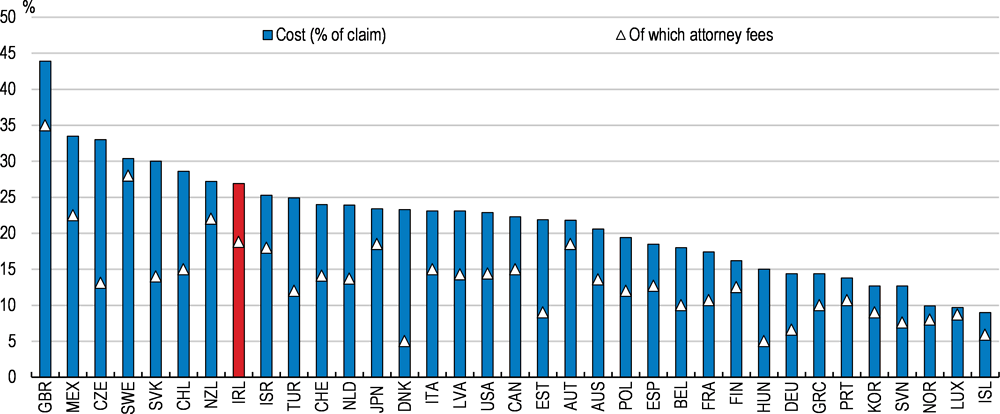
Note: In the case of MEX, JPN, USA, it refers to Mexico City, Tokyo, and New York City respectively.
Source: World Bank Doing Business (2017).
To reform the regulations in the sector, the Legal Services Regulations Act was adopted in late 2015. The Act established the Legal Services Regulatory Authority (LSRA), an independent but publicly accountable body. The LSRA will be responsible for overseeing both solicitors and barristers and processing complaints that have, so far, been dealt with by self-regulated professional bodies. The Act also sets up the Office of the Legal Costs Adjudicator to provide an independent and impartial assessment of legal costs, seeking to achieve a balance between the costs involved and the services rendered. Both institutions are expected to be fully operational in 2018. These changes will raise the transparency of legal costs and customers’ bargaining power.
The LSRA will also pursue, mostly subject to consultation, the competition-enhancing and cost-reducing provisions prescribed in the Act. The provisions envisage the introduction of legal partnerships (either solicitor-barrister or barrister-barrister partnerships) and of limited liability partnerships (LLP), the creation of multi-disciplinary practices (but limited to those between comparable professions), and the possibility of direct access to barristers for customers. These provisions will be possible only under the new regulations which the LSRA will issue. If introduced, these provisions should lower the costs of legal services through enhancing competition in the sector.
Creating a high-performing stock of physical infrastructure
High-quality transport infrastructure is also essential for the efficiency of supply chains, impacting the ability of local firms to embed themselves into global value chains and grow their business. Nevertheless, those business executives surveyed as part of the World Economic Forum Executive Opinion Survey in 2016 judged the quality of Ireland’s transport infrastructure to be poor compared with other OECD countries. This judgment was echoed by logistics professionals questioned for the World Bank Logistics Performance Indicator. The government has identified transport around urban centres as posing particular constraints, which are likely to become more pronounced given expected future demand trends (Department of Public Expenditure and Reform, 2017a). Dublin and Cork are already two of the most congested cities of their size class in the world, according to the Tom Tom Traffic Index, and both are expected to experience particularly strong population growth over the coming decade (CSO, 2013).
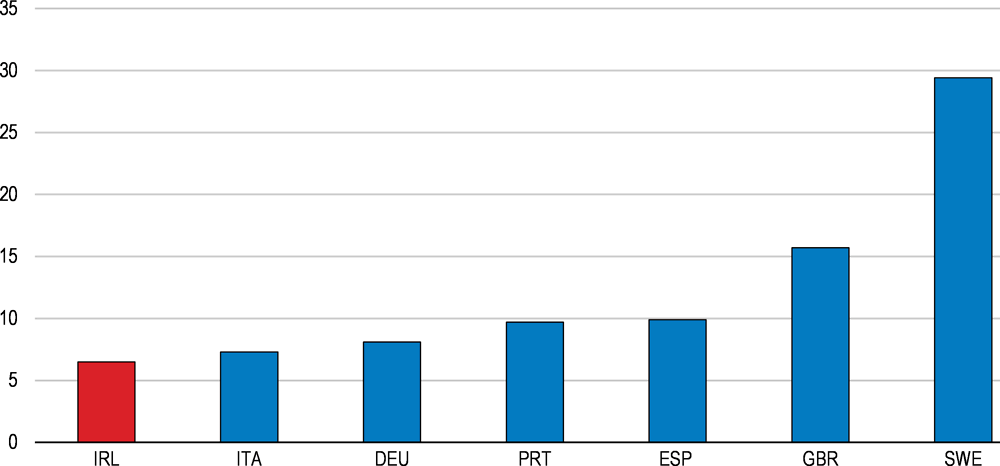
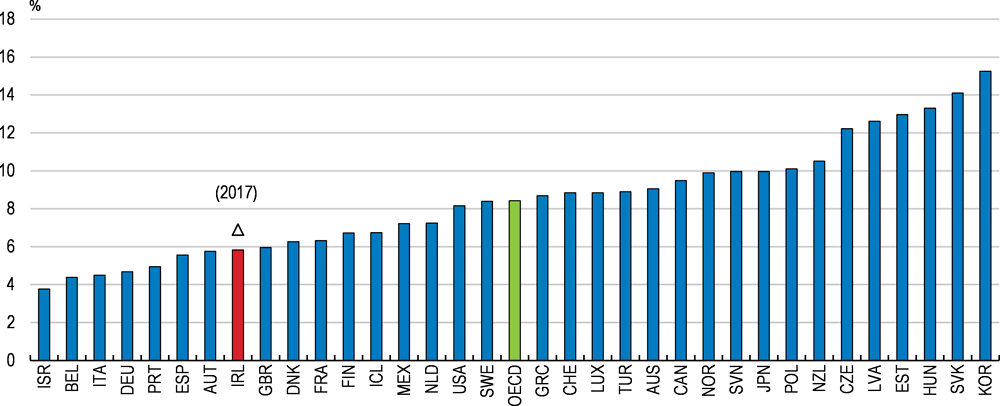
Cuts to public capital investment accounted for a disproportionate share of fiscal consolidation through the crisis, with transport infrastructure spending particularly hard hit (Kennedy, 2016). Between 2008 and 2015, government investment as a share of total government expenditures fell from 12.7% to 5.8%. By that time, the investment share of government spending was below the OECD average (Figure 1.17). The government plans to substantially increase public capital investment and the investment share of public spending has already begun to creep up. Between 2016 and 2021, capital expenditure is expected to rise by approximately 85% (Department of Public Expenditure and Reform, 2017b), with many new transport projects and upgrades planned. Furthermore, a new National Development Plan for the period 2018-2027 is being developed, that will closely align with the National Planning Framework that is also being drafted. The latter will outline a set of compatible development priorities for the country to 2040 and provide an overarching strategy for government activities across a range of policy areas including transport, housing, jobs, education, communications and the environment.
Figure 1.17. The investment share of government spending is low
Government investment as a share of total government expenditures, 2015
Note: 2015 is the latest data available for all countries.
Source: OECD (2017), Government at Glance (database).
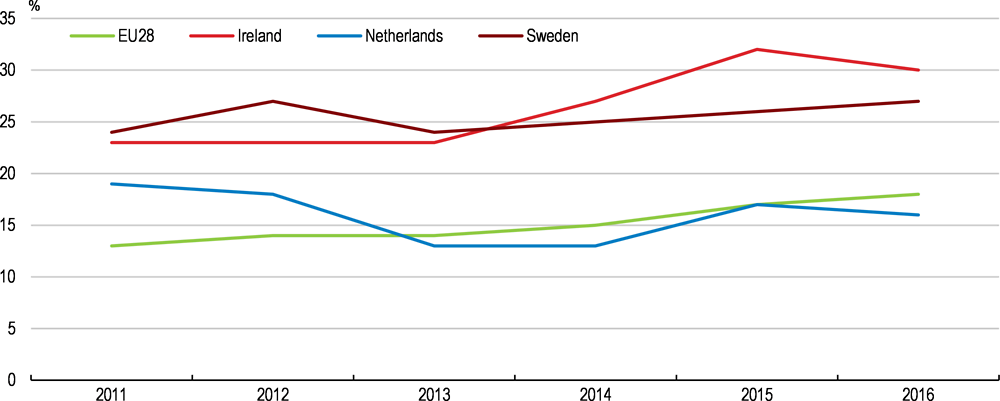
A business environment that enables firms to embrace digitalisation can also enhance their ability to reach new markets and implement new production processes. Recent work highlights that online sales have played an important role in the facilitation of export participation by Irish services firms (Lawless and Studnicka, 2017), with many Irish firms selling products online (Figure 1.18). While the proportion of enterprises with high speed broadband access (i.e. download speed above 30 mb/s) remains below that of some countries such as Sweden and the Netherlands, the increase in coverage between 2014 and 2016 was the second highest of any EU country. This partly reflects high speed broadband delivery being a strategic priority under the Programme for Government. The National Broadband Plan, published in 2012, envisaged that all premises in Ireland would have access to high speed broadband by 2020 (coverage was 65% as at September 2017). While full coverage is now not expected to be achieved until 2023, over 90% of premises should have access by 2020.
Figure 1.18. Many Irish firms sell online
Proportion of enterprises selling online (at least 1% of their turnover).
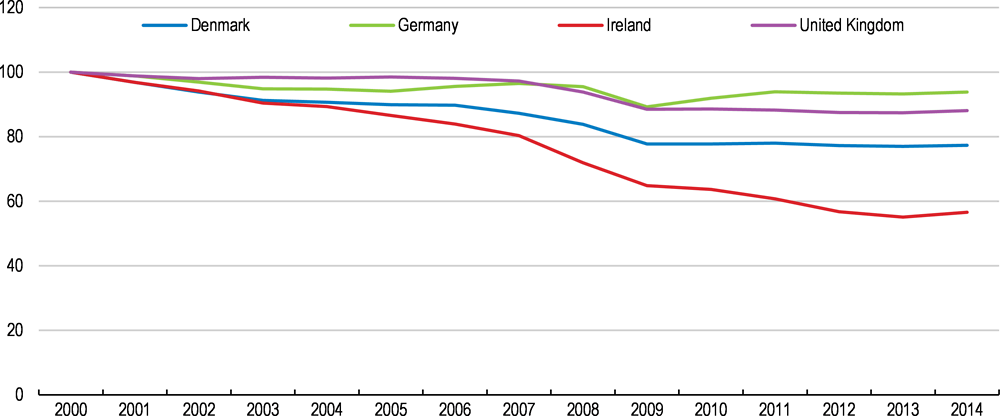
In the context of the large planned increase in public capital investment, choosing public infrastructure projects with the highest economic and social returns is critical. Since 2000, aggregate capital productivity has declined more sharply in Ireland than in any other OECD country for which comparable data exist (a subset of these are shown in Figure 1.19). This trend was observed prior to the financial crisis and has persisted since. Furthermore, recent work by the International Monetary Fund has estimated Ireland’s public infrastructure spending efficiency at below the EU average (IMF, 2017).
Figure 1.19. Capital productivity has declined sharply in Ireland
Index 2000=100
Note: Capital productivity is measured as the ratio between the volume of GDP and the volume of capital input, defined as the flow of productive services that capital delivers in production (i.e. capital services). The latest available data point for Ireland is for 2014.
Source: OECD (2017) Compendium of Productivity Indicators (database).
There are particular aspects of the selection, design and evaluation of public infrastructure projects in Ireland which may be limiting the performance of such capital. Prior to project development, there is no mandatory process of consulting with future users. Such provisions are in place in the UK and in most Scandinavian countries and provide an opportunity for user feedback that can be incorporated into infrastructure design (OECD, 2017b). The public consultation in Ireland for the mid-term review of the government’s Infrastructure and Capital Investment Plan 2016-21 was an example where such feedback has been encouraged, though it should be made compulsory in all future public investment projects.
There should also be better efforts to systematically collect information on the financial and non-financial performance of existing infrastructure. This can inform policymakers about the best delivery model for future projects and emerging capacity constraints. Furthermore, data can be used to create indicators for benchmarking infrastructure performance across time and sectors and, where possible, relative to other countries. New Zealand is one country that has invested in the evidence base for evaluating infrastructure assets. Following the 2011 National Infrastructure Plan, the government developed performance indicators for each sector on the stock, state and performance of central and local government infrastructure assets as well as those managed by the private sector. Once armed with better performance data, the establishment of an independent body that draws on that information to prioritise infrastructure projects should be considered. Nevertheless, the efficacy of such an institution relies on it being transparent and its findings not being influenced by vested interests.
In endeavouring to improve the quality of Irish infrastructure, the process for planning and delivering projects should also be reviewed. In recent years, the delay between the conception and completion of some public infrastructure projects has been inordinately long (IBEC, 2015a). This may reflect the fact that the responsibility for planning, delivering and maintaining infrastructure is highly fragmented across public sector entities (NCC, 2016). It should be ensured that there is a clear rationale for project responsibilities being divided across institutions and levels of government. In such a case, the Department of Housing, Planning and Local Government should undertake regular reviews to promote cooperation and ensure there are not contradictory approaches being undertaken by the entities involved.
Insolvency regimes are crucial in influencing business dynamics
Effective exit policies strengthen market selection by increasing the economy’s ability to wind down non-viable firms and by facilitating the restructuring of viable ones. They can also improve within-firm productivity growth among firms undergoing restructuring. Finally, such policies enhance the scope and speed at which resources sunk in failing firms are reallocated to more productive uses (Adalet McGowan and Andrews, 2016). Exit policy also matters for firm entry, since high exit costs disproportionately affect firms with riskier business strategies which entail a high probability of failure (Bartelsman et al., 2008). Recent OECD evidence shows that strengthening the insolvency regime is complementary to regulatory reforms for firm entry (Andrews et al., 2018).
While a number of policy domains are related to firm exit, insolvency regimes are crucial for the private market to facilitate the exit of non-viable firms in an orderly manner. According to Adalet McGowan and Andrews (2016), this is due to the existence of market imperfections including: information asymmetries, as debtor and creditors assign different values on the firm (Smith and Stroemberg, 2005); incomplete contracts, as it is difficult to write a complete contract ensuring an optimal outcome in advance (Hart, 2000); and coordination problems, as the interest of individual creditors can conflict with those of the creditors as a collective (Marinc and Vlahu, 2012).
In Ireland, corporate insolvency results in one of three main procedures: liquidation (winding up the business); receivership (enforcement of collateral against a loan); or examinership (restructuring). The number of insolvency cases is limited as there were 1 754 liquidations, accounting for only 12% of the total number of firms which were dissolved in 2016. The vast majority of liquidations are voluntary, while court-ordered liquidations accounted for just 61 cases. In 2016, 340 receiverships were initiated in 2016, while 20 companies went into examinership (CRO, 2017).
Corporate insolvency regime for restructuring
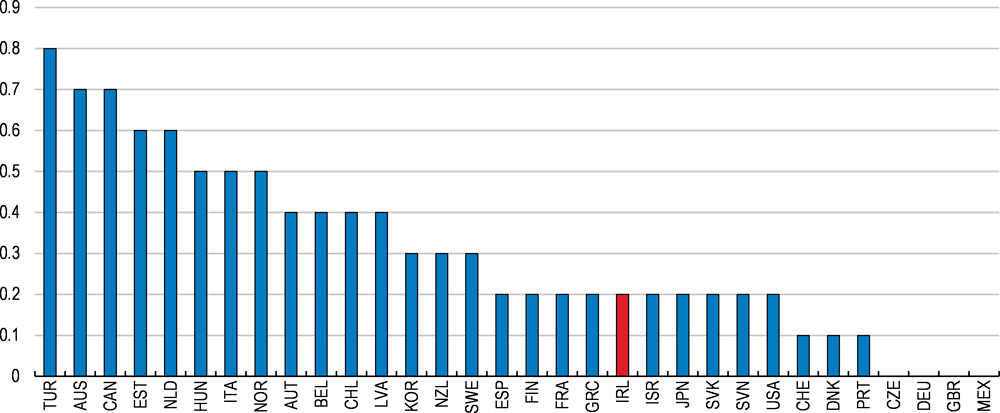
The Irish corporate insolvency regime is considered to be highly efficient (World Bank, 2017). The recovery rate (i.e. how much secured creditors recover from an insolvent firm at the end of insolvency proceedings) is very high, at 87.7% (versus the OECD average of 73.0%). The average duration of insolvency proceedings is short (0.4 years versus 1.7 years), though costs of insolvency proceedings are close to the OECD average (9% of the debtor’s assets versus 9.1%), mostly due to the cost of legal services. The framework of the Irish corporate insolvency regime is also considered to be strong (Adalet McGowan et al., 2017b; Figure 1.20), in particular with regard to corporate restructuring. The strength in the corporate insolvency framework (Figure 1.20) results from a number of positive practices in Ireland.
Insolvency proceedings start early, thus avoiding delays that reduce the possibility of successfully restructuring viable firms and lower the liquidation value of failing firms.
After the restructuring proceedings, the debtor is allowed to obtain new credit.
The debtor is allowed to continue operations during restructuring proceedings, thus increasing the chance of a successful outcome, particularly as incumbent managers are allowed to stay in charge for a limited period.
Restructuring plans need only a requisite majority of creditors for approval, instead of requiring a unanimous vote, thus facilitating the timely restructuring of firms.
Figure 1.20. The insolvency regime for corporate restructuring is efficient
OECD insolvency indicator: Corporate restructuring, 2016
Note: The indicator is constructed based on the OECD questionnaire on insolvency regimes. It ranges from zero (least stringent) to one (most stringent). “Corporate restructuring” takes into the following aspects: creditors’ ability to initiate restructuring; availability and length of stay on assets in restructuring; treatment of management during restructuring; possibility and priority of new financing; and possibility to “cram-down” on dissenting creditors.
Source: Adapted by the Secretariat based on Adalet McGowan et al. (2017).
Bankruptcy law
Bankruptcy law often has greater importance than corporate insolvency regimes for influencing the exit (and hence entry) of entrepreneurs and small businesses (Armour and Cumming, 2008). Entrepreneurs often use personal finances prior to incorporating and obtaining limited liability protection (Berkowitz and White, 2004; Cumming, 2012) and lenders often require them to make personal guarantees. In Ireland, such guarantees are common practice, with some 40% of SMEs using them (CSO, 2014). This likely impedes firm exit, as an owner of a failing firm that has given personal guarantees becomes liable if the firm’s assets cannot fund all liabilities. In Ireland, if the owner cannot pay out the liabilities or avail of alternative debt resolution under personal insolvency law (discussed below), then they risk becoming bankrupt.
For many years, Ireland’s bankruptcy law was very stringent for debtors, and all parties avoided pursuing or declaring bankruptcy at any cost, to the extent that the number of personal bankruptcy cases was virtually zero in the 2000s. Two recent reforms, which reduced the penalties for the bankrupt (Figure 1.21), resulted in an increase in the number of bankruptcies adjudicated (from 58 in 2013 to 526 in 2016). This suggests that the reforms made bankruptcy a viable solution, although the number of bankruptcy cases remains unusually low with respect to the number of highly indebted persons.
Figure 1.21. Reforms to bankruptcy law have reduced penalties for failed entrepreneurs
OECD insolvency indicator: Treatment of failed entrepreneurs, 2016
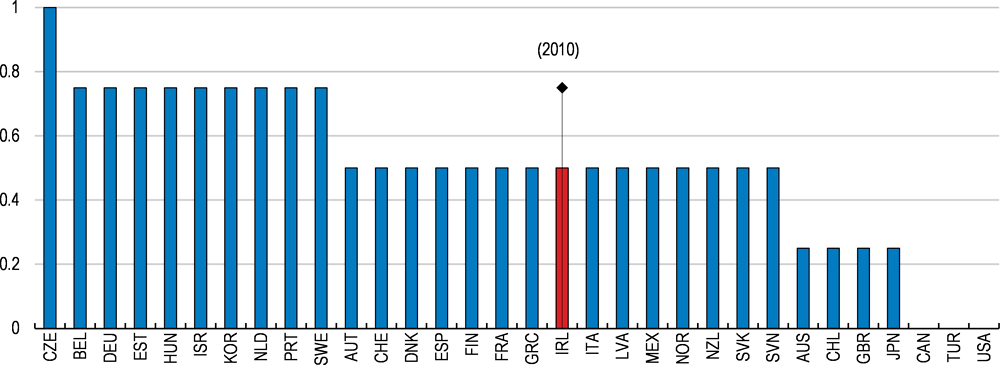
Note: The indicator is constructed based on the OECD questionnaire on insolvency regimes. It ranges from zero (least stringent) to one (most stringent). “Treatment of failed entrepreneurs” takes into the following aspects: time to discharge; and bankruptcy exemptions.
Source: Adapted by the Secretariat based on Adalet McGowan et al. (2017).
The availability of discharge (exemption of future earnings from obligations to repay pre-bankruptcy debts) reduces the burden of the debtor and thus facilitates smoother firm exit. The recent reforms just discussed reduced the time to discharge (i.e. when the exemption from pre-bankruptcy debt repayment becomes available) from twelve years to three in 2012 and from three years to one in 2015 (although it can be extended for non-cooperative debtors up to a maximum eight years from the date of bankruptcy adjudication or up to a maximum of 15 years in very serious cases). If there is an Income Payment Agreement or an Income Payment Order in place, the bankrupt person will still have to comply with it until it expires, which can last up to 3 years. However, such orders are made only where the bankrupt’s income or assets so permit and subject to the courts having regard to the reasonable living expenses of the bankrupt and their dependents. In some other countries, discharge is not allowed or, even when it is allowed, the time to discharge is long.
The exemptions of assets of the bankrupt that are not directly linked to the business also affect firm exit. In Irish bankruptcy law, the exemptions of pre-bankrupt assets from the bankrupt estate (or the legally protected assets) are very strictly limited. All of the debtor’s assets, with the exception of necessities up to a value of EUR 6 000 (equivalent to a fifth of average annual earnings), are transferred to the Official Assignee who will sell them; the proceedings are distributed among the creditors. The assets include the debtor’s dwelling, under the prior permission of the court. This contrasts, for instance, with the exemptions available under US Federal Law, which sets up minimum standards across states, allowing the exemptions up to USD 22 975 for homestead, USD 11 525 for total household goods and USD 3 450 for motor vehicle, etc.
In practice, however, the bankrupt’s home is rarely sold by the Official Assignee, because the court must take into account the reasonable living expenses of the bankrupt and his or her dependents’ in making any bankruptcy payment order. Moreover, reforms to the bankruptcy law in 2015 specified that if neither the secured creditor nor the Official Assignee sought to repossess a dwelling within three years of the date of bankruptcy adjudication, the ownership of the dwelling by the debtor can be reinstated. Overall, the bankrupt is often granted more exemptions than what is defined in the bankruptcy law, but the courts define what are ‘reasonable’ living expenses (having regard to the Reasonable Living Expenses Guidelines issued annually by the Insolvency Service of Ireland) on a case by case basis, and in this sense uncertainty remains. In parallel, collateral enforcement by creditors rarely occurs in practice (even though a secured creditor’s contractual rights are not impaired by the debtor becoming bankrupt) due to the slow repossession proceedings (see Key Policy Insights section). Thus, in some cases at least, both the debtor and creditors can be better off by engaging actively in debt resolutions outside the bankruptcy procedure.
Alternative debt resolution mechanisms
The Personal Insolvency Act of 2012 introduced three new debt resolution mechanisms to help highly-indebted people reach agreements with their creditors. These mechanisms offer different solutions to people depending on their situations (Table 1.3). Among them, the Personal Insolvency Arrangement provides for the agreed settlement of both secured and unsecured debt on a voluntary basis (Table 1.3). The debtor must be able to make some repayments to their creditors in return for a discount of their debts. When the agreed period specified in each Personal Insolvency Arrangement ends, and if the debtor has fulfilled the agreement, they will be discharged from the unsecured debts. However, the secured debt will only be discharged to the extent specified in the Personal Insolvency Arrangement.
The three personal insolvency schemes have been increasingly used since their inception. Across the three schemes, 3 038 arrangements have been approved out of 6 800 applications since 2013 (ISI, 2017). The rejection of over half of applications by creditors reflects poor prospects of repayment by debtors, but is also related to the difficulties in co-ordination among creditors. Since late 2015, the debtor can appeal to the court for a review when creditors reject a PIA proposal which includes debt secured on the debtor’s main residence. The court may impose the rejected PIA proposal on creditors, subject to a number of criteria. Data on this new review process will be published in due course, and it may be useful in assessing how to further promote the alternative debt resolution mechanisms. Then, the authorities should consider making these debt resolution mechanisms more practical, for instance, requiring the approval of the simple majority of creditors, instead of 65% of them, and removing some other additional requirements (Table 1.3).
Facilitating the exit of non-viable firms may initially entail a rise in the number of displaced workers. Nevertheless, this should be considered in a broader context: In Ireland, around 1.1 million transitions occurred in the labour market in 2015 (SOLAS, 2016). A significant share of the transitions were accounted for by job churn, while the amount of inflow from employment to unemployment was 88 000. The number of those who were displaced and became unemployed due to business closure traditionally accounts for less than 10% of this inflow into unemployment. To cushion the impact on such workers, effective jobseeker assistance programmes are key. Regarding displaced workers due to firm exit, OECD evidence shows that active labour market programmes are found to be more effective among such displaced workers following firm exit, compared with other categories of jobseekers (Andrews and Saia, 2016).
Table 1.3. Four alternative resolution mechanisms for personal insolvency in Ireland
|
Arrangement |
Type of debt covered |
Value |
Duration |
Apply through |
Contents |
|---|---|---|---|---|---|
|
Bankruptcy |
Unsecured and secured |
Over EUR 20 000 |
1 year |
High Court (voluntary declaration or else creditors can petition) |
The bankrupt is automatically discharged from bankruptcy 1 year after the order of adjudication. The bankrupt's name will remain on the register, as a discharged bankrupt. If there is an Income Payment Agreement or an Income Payment Order in place, s/he will still have to comply with it until it expires. These arrangements can last up to 3 years. |
|
Debt Relief Notice (DRN) |
Unsecured (and secured in certain cases) |
Up to EUR 35 000 |
3 years |
Approved Intermediary (AI) |
DRN provides debt relief for people with no disposable income or assets and no prospect of being able to pay off the debt. DRN writes off debt up to EUR 35 000. During this 3-year period the creditors will not be able to pursue the debtor for payment, but if the debtor’s circumstances improve, s/he may have to pay part of debts. |
|
Debt Settlement Arrangement (DSA) |
Unsecured |
No limit |
5 years (+1) |
Personal Insolvency Practitioner (PIP) |
DSA provides for the agreed settlement of unsecured debt. The debtor must be able to make some repayments to the creditors in return for a discount of debts. It is a voluntary arrangement and it requires the support of creditors representing at least 65% of the total debt. If the DSA ends successfully, the debtor will be discharged from the unsecured debts. |
|
Personal Insolvency Arrangement (PIA) |
Unsecured and secured |
No limit on unsecured, Up to EUR 3m secured (though cap can increase if agreed) |
6 years (+1) |
Personal Insolvency Practitioner (PIP) |
PIA provides for the agreed settlement of secured or unsecured debt. The debtor must be able to make some repayments to the creditors in return for a discount of debts. It is a voluntary arrangement and it requires the support of creditors representing at least 65% of the total debt. In addition, over 50% of secured creditors and 50% of unsecured creditors must vote in favour. If the PIA ends successfully, the debtor will be discharged fully from the unsecured debt and s/he will be also discharged from the secured debt to the extent specified in the PIA. |
Source: based on citizensinformation.ie
Enhancing the allocation of finance
Well-functioning capital markets ensure the efficient allocation of capital. They facilitate the entry and expansion of high-potential businesses, boosting business dynamism. Access to finance for high-growth Irish firms also supports capital investments that better enable technology transfer or their ability to operate at a scale which makes supply relationships with MNEs feasible. On the credit demand side, the importance of different types of finance varies depending on firms’ risk/return profile and stage of business development (OECD, 2015c; Figure 1.22).
Figure 1.22. The importance of different types of finance varies across firms
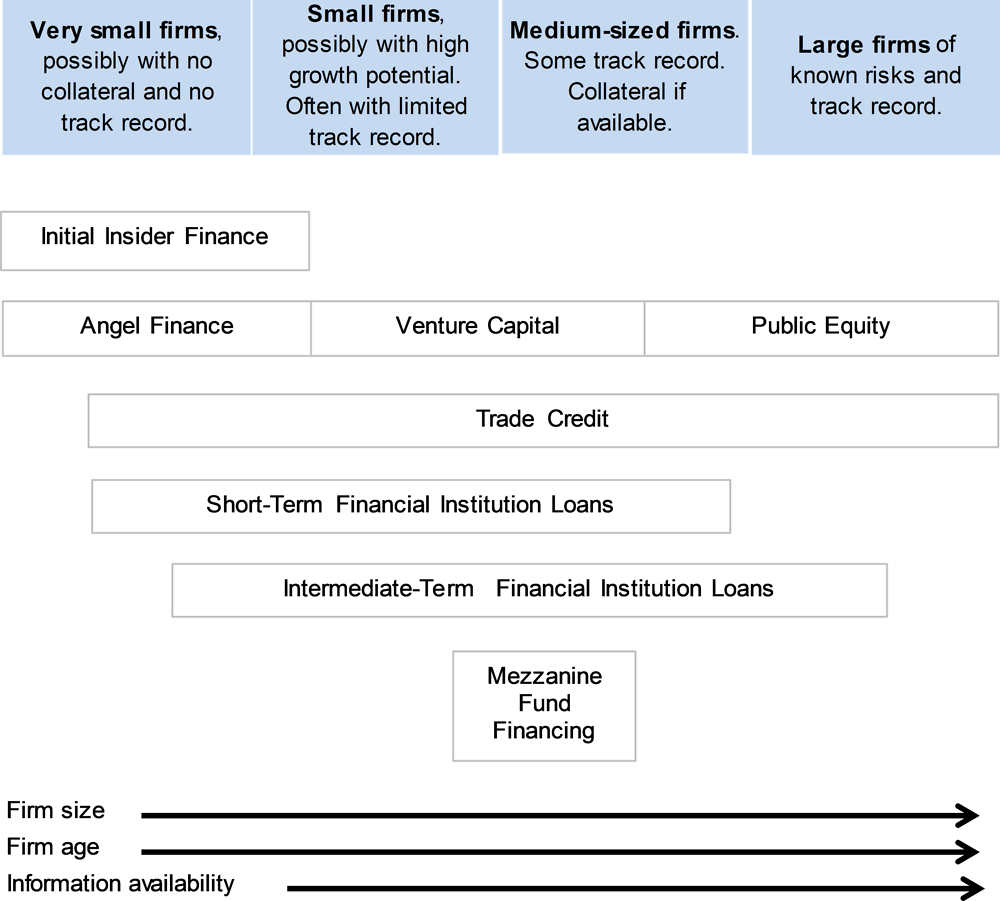
Source: Berger and Udell (1998), adapted by the Secretariat.
Bank finance, traditionally the main source of external funding among Irish SMEs, has weakened since the crisis. The share of firms relying on bank finance declined by 50% between 2005 and 2012 and, within bank finance, the share of working capital facilities rose compared with bank loans (Lawless et al., 2013). Bank loans are overall less frequently used in Ireland than in other euro area countries (Table 1.4). The decline in bank finance has been substituted by other funding sources, such as internal funding and trade credit (Casey and O’Toole, 2014). Although other types of debt finance are overall more frequently used in Ireland than in other euro area countries (Table 1.4), funding through the stock exchange remains comparatively underdeveloped (see below).
Table 1.4. Financing sources used in Ireland more than in other euro area countries
|
|
Young firms |
Developing firms |
Mature firms |
|---|---|---|---|
|
|
(< 5 yrs) |
(5 - 10 yrs) |
(> 10 yrs) |
|
Micro enterprises |
|||
|
Retained earnings |
X |
X |
|
|
Bank working capital facilities |
X |
X |
X |
|
Bank loans |
X |
||
|
Issued debt |
X |
X |
|
|
Trade credit |
X |
X |
X |
|
Other loans |
X |
X |
|
|
L/F/HP |
|||
|
Mezzanine |
|||
|
Small-sized firms |
|||
|
Retained earnings |
X |
X |
X |
|
Bank working capital facilities |
X |
X |
X |
|
Bank loans |
X |
||
|
Issued debt |
X |
X |
X |
|
Trade credit |
X |
X |
X |
|
Other loans |
X |
X |
X |
|
L/F/HP |
X |
||
|
Mezzanine |
|||
|
Medium-sized firms |
|||
|
Retained earnings |
X |
X |
X |
|
Bank working capital facilities |
X |
X |
|
|
Bank loans |
|||
|
Issued debt |
X |
X |
|
|
Trade credit |
X |
X |
X |
|
Other loans |
X |
X |
X |
|
L/F/HP |
|||
|
Mezzanine |
X |
Note: X shows the financing is used more than in other euro area countries.
Source: Adapted by the OECD based on Lawless et al. (2014).
Restoring the normal functioning of the banking sector
Impairment in the banking system
The SME default rate has remained high compared with many other European countries over the past years (Figure 1.8). Some SMEs are highly indebted, which effectively raises solvency and default risks (McCann, 2014). At firm level, the financial position of SMEs varies significantly, as about one-third of SMEs do not hold debt, while 5% of them are heavily indebted as their debt-to-turnover ratio exceeds one (CBI, 2017). The share of such firms is particularly high in the hotels and restaurants sector, where property-related loans for business purposes were excessively extended. Around 75% of SMEs with property-related debt find it an obstacle to business performance (CSO, 2014).
Reflecting the high SME default rate, borrowing conditions have remained very tight for small businesses since the onset of the crisis. Bank lending interest rates in the SME sector remain among the highest across euro-area countries (Figure 1.23, Panel A). Such market conditions tend to reflect high default rates, limited competition between lenders and high bank funding pressures (Carroll and McCann, 2016). Simultaneously, the interest rate differential between large firms and SMEs has also been significant (Figure 1.23, Panel B), a circumstance found where banks have greater market power and greater balance sheet weakness (Holton and McCann, 2016). As a result, total new lending remains very limited (Figure 1.23, Panel C), suggesting that potential lending to high-growth firms is likely to have been undermined.
Figure 1.23. Financing conditions for SMEs remain tight
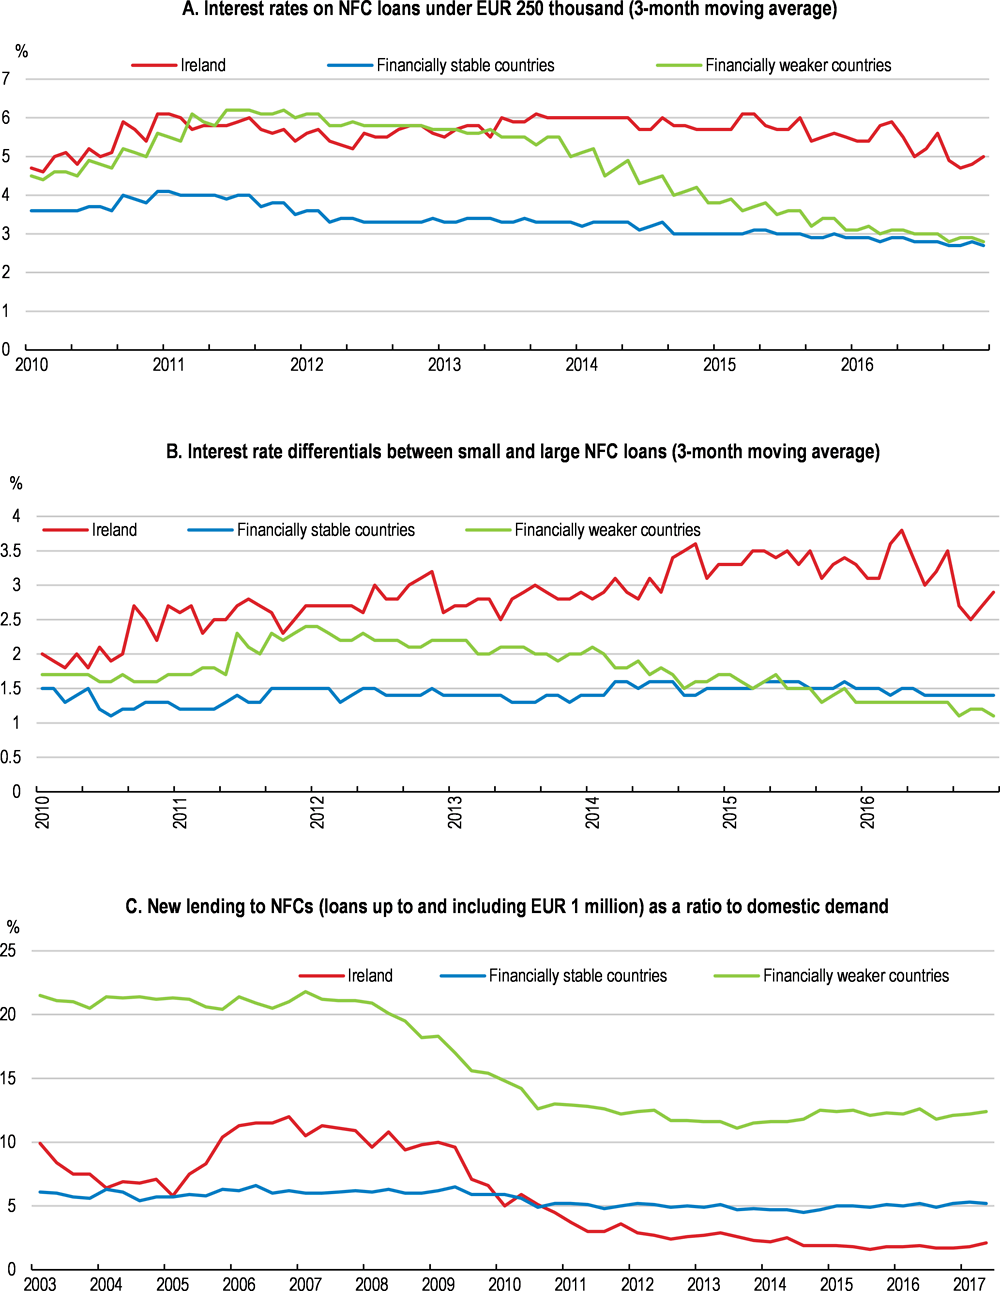
Note: Financially stable countries group comprises Austria, Germany, Finland, the Netherlands and France (Belgium is also included in Panel C), and Financially weaker countries group comprises Portugal, Italy, and Spain.
Source: Central bank of Ireland.
Forbearance lending
While the SME default rate is high, forbearance measures (i.e. granting a temporary or permanent concession or agreed change to loan terms) to distressed firms have frequently been extended. Some forborne loans do return to performance, but the value of this is largely offset by that of new or extended forbearance lending (Bank of Ireland, 2017; AIB, 2017). Forbearance lending in the SME sector most often takes the form of term extension (Bank of Ireland, 2017; AIB, 2017); this is effective for viable firms facing short-term liquidity problems but is not a durable solution for non-viable firms. Such forbearance can reduce the access to finance for young high performing companies and slow the exit of poor performing ones, lowering the efficiency of resource allocation.
The extent of NPL write-offs has been limited, compared with the amount of non-recoverable loans. This may be because banks’ provisions against defaulted loans are not sufficient, at least by international standards (Figure 1.24). If they write them off, the enforcement of collateral would limit subsequent losses. However, repossession is very difficult when the collateralised assets include the business owner’s primary dwelling house, on which the business owner provided personal guarantees in the loan contract. As it stand, Ireland’s repossession process on primary dwelling house is lengthy with uncertain results. Thus, creditors’ claim on assets is very restricted in practical terms, which in turn adversely affects bank credit supply. In this respect, it is essential to improve judicial efficiency in repossession proceedings and the authorities should consider granting creditors a possession order for a future date to speed up repossession proceedings (see Key Policy Insights section).
Figure 1.24. The ratio of NPLs net of provisions to capital is high
Percentage, Q2 2017
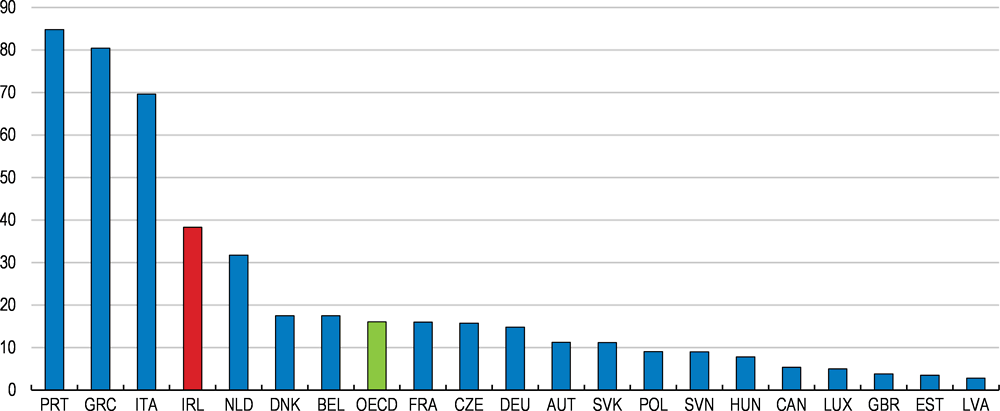
Note: Q1 for the United Kingdom. The OECD aggregate is an unweighted average of the latest data available for 34 OECD countries.
Source: IMF (2017), Financial Soundness Indicators (database), International Monetary Fund, November.
Strengthening the insolvency regime would also speed up the resolution of NPLs. The health of the banking sector is closely associated with a reduction in the prevalence of non-viable firms, and this is facilitated by making the insolvency regime effective (Andrews and Petroulakis, 2017). As non-viable firms exit the market, which requires an effective insolvency regime, forbearance loans will decline and the banking sector will regain its health. This will strengthen the efficiency of the allocation of capital, enabling highly productive firms to attract more of it.
As for new loans, banks should reduce the use of personal guarantees of the business owner to cut off the link between business failure and personal bankruptcy. The most common conditions for new loans remain the commitment of business owners to their personal guarantees (CSO, 2014). Such collateral requirements help banks to screen out risky businesses, but once the firm defaults, banks get into trouble as repossession of collateral is not easy in practical terms. In this respect, the authorities should consider introducing guidelines for banks that specify circumstances under which personal guarantees from businesses should not be sought. Instead, banks should adopt a business model focusing on the assessment of the business plan and cash flow. Such a practice would also help differentiate the perceived risk of defaults across businesses.
Developing alternative financing channels
Equity finance is key for firms seeking long-term corporate investment for innovation, value creation and growth. The development of equity finance in Ireland is opportune, not only because it will take some time for the banking sector to regain its normal functioning, but more generally because equity financing is especially relevant for firms with a high risk-return profile, such as new, innovative and high-growth firms. It will also contribute to financial stability, containing an excessive rise in economy-wide leverage ratios (Cournède and Denk, 2015).
Private equity
Private equity finance can boost the creation and development of innovative firms. Business angels, mainly former entrepreneurs and wealthy individuals, operate in a seed/early-stage investment segment. They commonly target firms with a high potential to generate substantial revenues over the medium to long term. In contrast with business angels, venture capitalists are formally organised funds meeting retail investors’ requirements. They intervene at a later stage, after a business idea or product has been successfully test-marketed, to finance full-scale marketing and production. They target a small pool of high-growth-potential firms with the capacity to generate high returns in a relatively short timeframe.
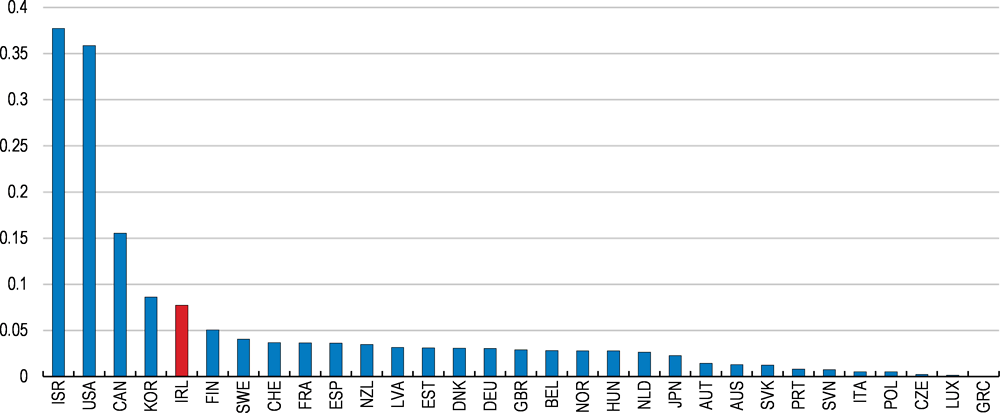
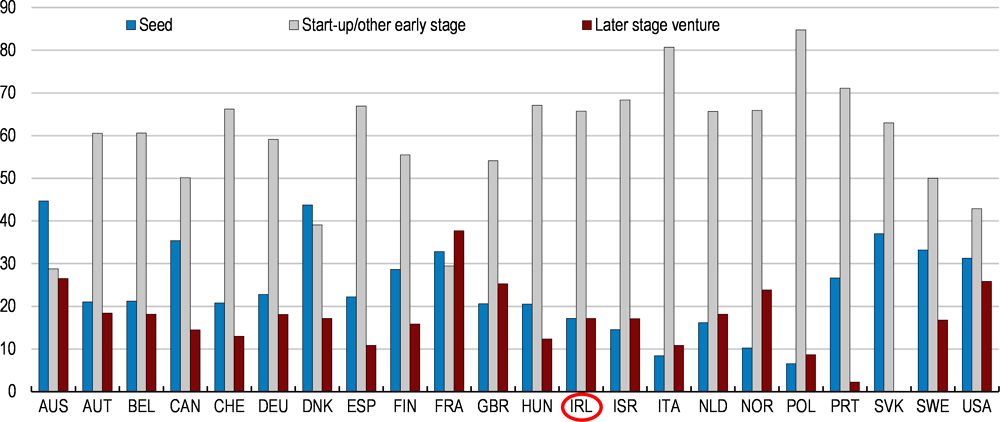
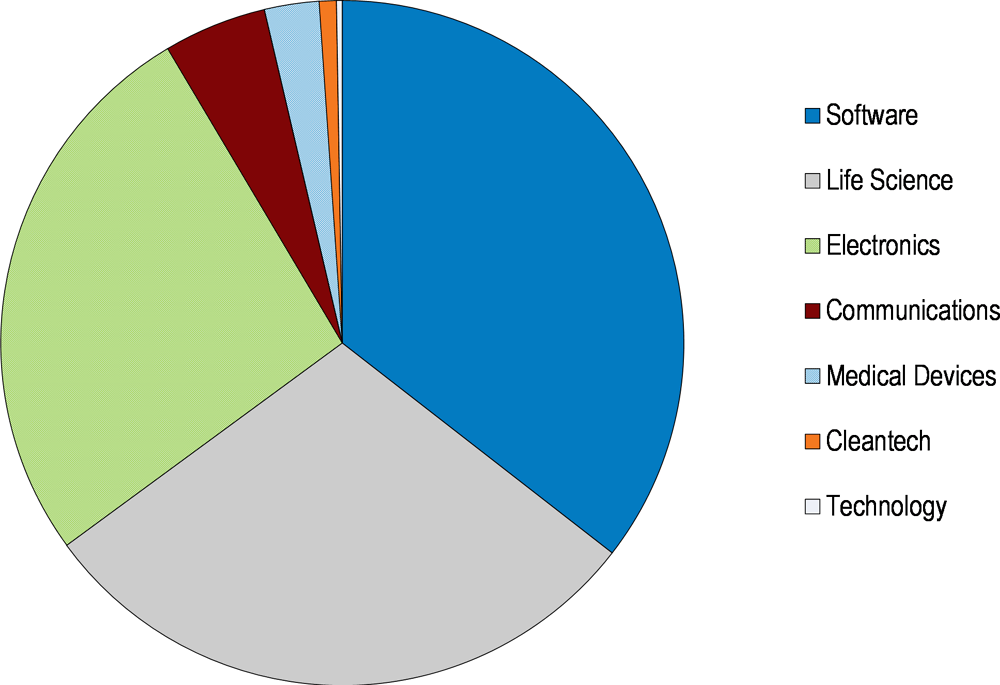
Financing by venture capitalists is more developed in Ireland than in other OECD countries (OECD, 2017c; Figure 1.25) but is limited to a small number of firms, with around 1% of Irish SMEs applying for it over each six-month period in recent years (Department of Finance, 2017). As in other countries, venture capital financing is concentrated in the ICT sector in particular (O’Toole, 2014). It is also disproportionately concentrated on firms in the middle stage of development (Figure 1.26). This leaves scope for public funds to target their support to a wide range of beneficiaries, in particular for those in earlier development stages (see below).
Figure 1.25. Venture capital investment is higher than in most other OECD countries
Venture capital investment as a percentage of GDP, 2016
Figure 1.26. Venture capital finance is concentrated in the middle-development stage in Ireland
Venture-capital-backed companies by development stage, % of total VC finance, 2016
Insolvency reforms that accelerate the initiation and resolution of insolvency proceedings is complementary to the core VC business model, which relies on the aggressive reallocation of resources across the investment portfolio from failing to high-performing ventures (Andrews et al., 2018).
Public equity
For growth-oriented and innovative enterprises, specialised platforms for a public listing can provide important financial resources (OECD, 2015c). For businesses in a late stage of development, the stock exchange serves as both a source of capital and an “exit vehicle” for venture capitalists, which can earn substantial revenues by selling their equity in successful businesses.
Listed firms have to comply with stock-exchange rules, which protect investors’ interests and market integrity. This usually involves disclosure by firms through an initial prospectus of basic information about their activities and financial situation, and later though regular reporting. It also requires firms to place a minimum share of their equity in public circulation. Trading takes place under the rules established by the exchange, which is usually regulated by a securities authority. All such requirements may be difficult and costly to meet for many small businesses.
The Enterprise Security Market (ESM), the specialised platform for small businesses in the Irish Stock Exchange, sets less strict listing and disclosure requirements. In contrast with the Main Securities Market (MSM), it does not set requirements for firms listed on it to place a minimum of 25% of shares in public circulation or to publish a prospectus. Similarly, price-sensitive information need only be provided twice yearly in the ESM, whereas its continuous provision is required in the MSM. In terms of preserving investors’ interests and market integrity, ESM advisors provide small firms with guidance on their responsibilities under the rules in the exchange.
The ESM has made progress since its inception just over a decade ago. The market capitalisation value in the ESM is larger than the Alternext market, Euronext’s specialised platform for small businesses, though much lower than the Alternative Investment Market (AIM) in the London Stock Exchange (Figure 1.27). The number of the listed companies in the ESM is limited (25 in 2016) compared with Alternext and AIM (197 and 173, respectively). Compared with similar markets, the amount of new capital raised by ESM listed companies is also limited (Figure 1.27).
Figure 1.27. The alternative stock exchange platform can be developed further
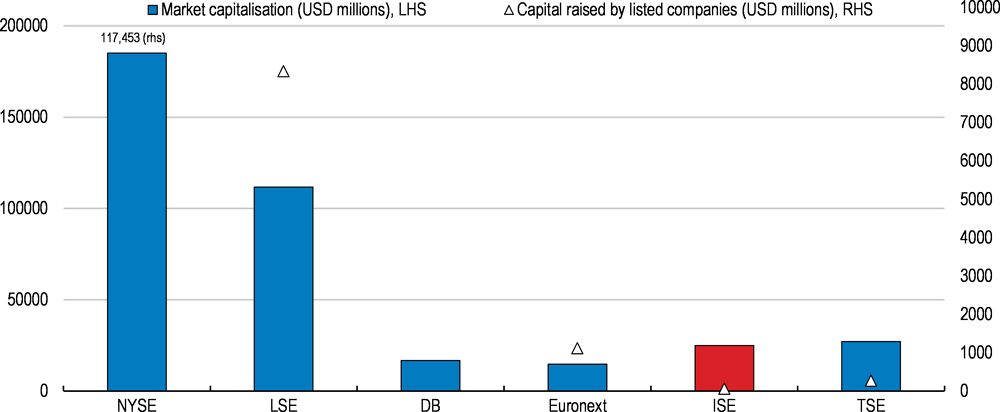
Note: “NYSE”: NYSE MKT in New York Stock Exchange; “LSE”: the Alternative Investment Market in the London Stock Exchange; “DB”: the Entry Standard in the Deutsche Boerse; “Euronext”: ALTERNEXT in the Euronext group; “ISE”: the Enterprise Securities Market in the Irish Stock Exchange; “TSE”: MOTHERS in the Tokyo Stock Exchange. No data available for the capital raised by listed companies for “DB”.
Source: OECD calculation based on the World Federation of Exchanges’ database and the LSE’s annual report.
The limited number of firms may suggest that public equity finance is costly in Ireland. If this is the case, the authorities should consider alleviating debt bias of firms – interest payments are deductible in corporate taxation while the return on equity is not (de Mooij, 2011). To do so, firms could be allowed to deduct the notional return on equity from their corporate tax bill (Mirrlees et al., 2011), as was introduced in Belgium in the 2000s. However, given Ireland’s low rate of corporate taxation, the resulting reduction in the average effective tax levels would be very limited. This is even more so for small but high-growth-potential firms which do not yet pay corporate tax.
The limited amount of capital raised in the ESM may reflect the typical problem of a small stock exchange: that monitoring costs are very high for investors relative to the level of investment and low levels of liquidity. The marginal and average tax rate for interest on bonds and dividends is identical (OECD, 2015d) and a recent policy removed the obligation for investors in the ESM to pay stamp duty. As a further step, the authorities can consider reforming the Employment and Investment Incentive Scheme, a tax relief for investing in firms in early stages, to cover also those transitioning to public equity, following the example of the Enterprise Investment Scheme (EIS) in the United Kingdom.
The United Kingdom’s EIS offers tax relief to investors who purchase new shares in small and high-risk trading firms. The relief sets 30% of the cost of the shares up to a maximum investment of GBP 1 million against the individual’s income tax liability, which can be deferred over several years. The firms must be an unquoted company at the time the shares are issued. When the company transitions to the AIM, investors do not lose the tax relief if the company satisfies all the conditions such as the number of employees (250 or fewer). Such a tax relief would facilitate both the development of early stage private equity and the transition of successful businesses into the stock exchange.
Improving public financial support
Financing transactions are in general affected by market failures such as information asymmetry, particularly in the case of young innovative businesses (Calvino et al., 2016). Young firms tend to be liquidity constrained as they lack credit history and collateral to secure a loan. The problem becomes more acute if they are involved in innovation processes which have uncertain outcomes. This is particularly the case when they deal with assets whose nature may be intangible and difficult to evaluate, such as patents. All these problems call for public intervention to financially support young and innovative firms.
Ireland has set up a number of public funds to support small businesses since the early 2010s. These funds mainly take the form of fund-of-funds and co-investment funds, both of which seek to leverage private sector investment (Table 1.5).
Table 1.5. Funds that provide access to finance for small businesses in Ireland
|
Scheme |
Type |
Year launch |
Capacity |
Main targets |
Outline |
Achievements |
|---|---|---|---|---|---|---|
|
Ireland Strategic Investment Fund (ISIF) |
fund-of-funds |
2014 |
EUR 7.1 billion (taking over the portfolio of the National Pension Fund) |
Targeting investment in private sector entities that interface directly with SMEs. |
Large volumes of granular debt and equity investments to be made in SMEs. |
To date, EUR 355 million has been committed to four SME funds: BlueBay SME Credit Fund; Carlyle Cardinal Ireland SME Equity Fund; Causeway Capital Partners SME Equity Fund; BMS Finance (Ireland) fund. |
|
Innovation Fund Ireland |
co-funding |
2010 |
Approximately EUR 250 million (leveraging private funds of at least EUR 250 million) |
Early-stage and high-growth companies. |
Venture capitals (VC). Attracting leading international venture capital fund managers to Ireland. |
Approximately EUR 80 million has been committed to four funds which are actively investing. |
|
Seed & Venture Capital Scheme |
co-funding |
2013 |
EUR 175 million (leveraging private funds of EUR 525 million) |
High potential start-up and scaling companies. |
Private fund managers investing in equity and quasi-equity. |
EUR 175 million was fully allocated in 2 separate competitive calls in 2013 and 2015. A number of venture capital funds targeting early stage funding. |
|
Development Capital Scheme |
co-funding |
2012 |
EUR 75 million (leveraging private funds of EUR 150 million) |
For mid-sized, high-growth, local companies with significant prospects for job and export growth. |
Private fund managers investing between EUR 2 to EUR 10 million in equity, quasi equity and/or debt. |
The target (total EUR 225 million) has been exceeded and there are now three funds actively investing in the Irish market. |
|
Microenterprise Loan Fund |
direct financing |
2012 |
N.A. |
Viable micro-enterprises with commercially viable proposals. |
Unsecured loan of between EUR 2 000 and EUR 25 000. |
From October 2012 to December 2015, the Fund approved loans to 770 micro-enterprises to the value of EUR 11.7 million. |
|
Strategic Banking Corporation of Ireland (SBCI) |
Funding private banks |
2015 |
The current funding capacity: EUR 1.05 billion |
On-lending model: not lending directly to enterprises. Risk sharing activity. |
On-lenders provide loans. These SME loans can be for a term of 2-10 years with upper loan limit of EUR 5 million. |
To end June 2017, the SBCI had committed a total of EUR 881 million to its 7 on-lending partners. EUR 855 million of SBCI supported funding was provided to 21 132 Irish SMEs. More than 80% of loans were for investment purposes and the average loan size was approximately EUR 42 000. |
Source: Entrepreneurship at a Glance (2017), Ireland country note.
In 2014, the Ireland Strategic Investment Fund (ISIF) took over the EUR 7.1 billion discretionary portfolio of the National Pensions Reserve Fund. The ISIF invests on a commercial basis in a manner designed to support economic activity and employment in Ireland. To ensure the efficient delivery of funding to the SME sector, the ISIF generally targets investment in private-sector funds that deal directly with SMEs. Within this funding scheme, programme terms are flexible if the underlying requirement is met: namely, that the funding is provided on a commercial basis.
Enterprise Ireland, a state agency responsible for the development and growth of Irish enterprises in world markets, manages a number of co-investment funds (Table 5). In this funding scheme, private-sector fund managers make their own commercial investment decisions in the context of an agreed investment strategy. Enterprise Ireland usually commits at maximum 50% of total funding and invests according to the same commercial terms as private funds (on a ‘pari passu’ basis).
Public support through these funds is concentrated in certain segments in the economy. In the co-funding scheme with private funds, it is less likely for public funds to crowd out private financing. As a consequence, however, public support is concentrated in a limited segment of the economy, such as the ICT sector, where most VCs invest (Figure 1.28), and firms in comparatively later stages of development. For instance, the amount of investment for firms in the earliest stage account for only 6.2% in Enterprise Ireland’s Seed and Venture Capital Scheme 2013-18 (Enterprise Ireland, 2017). The authorities should assess if the support from public funds could be made in a more broad-based manner and balanced more toward firms in earlier stages.
Figure 1.28. Funding through the Seed and Venture Capital Scheme is concentrated in certain sectors
Sectoral breakdown of investments cumulative to December 2016, % by value
The Microenterprise Loan Fund Scheme deals more directly with firms in early stages, where market failures are most pronounced. The scheme is managed by the Social Finance Foundation, a not-for-profit company, on behalf of the Minister for Enterprise and Innovation. The scheme targets firms in early stages which cannot satisfy conventional bank credit criteria and have been refused credit from a bank. The funding by this scheme to small businesses is comparatively balanced across sectors (Figure 1.29) and 56% of its approvals were granted to those in business for less than 1½ year (Microfinance Ireland, 2017). However, the scheme is limited in its size, as the total amount of loans approved accounted for EUR 18.2 million cumulatively as of end-2016, accounting for around 10% of the total amount allocated to the Seed and Venture Capital Scheme. The scheme could be extended further, ensuring that funding is strictly conditional on various tests of financial viability.
Figure 1.29. Funding through the Microenterprise Loan Fund Scheme is diversified
Sectoral breakdown of investments cumulative to end 2016, % by value
In order to address investment financing constraints, the Strategic Banking Corporation of Ireland (SBCI) was established in late 2014 to deliver effective financial supports to small businesses addressing market failures (SBCI, 2017). The SBCI secured available EU resources including funding from the European Investment Bank. The SBCI has adopted so far the wholesale lender approach ‒ it does not lend directly to borrowers but provides funding to partner finance providers (“on-lenders”) at attractive terms. Between 2014 and June 2017, EUR 855 million (0.31% of the 2016 GDP) of SBCI supported loans were provided to 21 132 Irish SMEs.
The SBCI currently has three on-lender banks, namely AIB, Bank of Ireland and Ulster Bank. The on-lending scheme can be effective if private banks face difficulties obtaining funding in financial markets. In such cases, the wholesale lender funds private banks at more attractive terms than they could obtain from the market, with the lower cost passed on to borrowers such as SMEs. The on-lending scheme, however, can induce distortive effects, because the reduction in interest rates due to the on-lender scheme may modify the expectation of interest rates by borrowers, which can be harmful for the development of the market.
One of the SBCI’s stated objectives is to promote competition, as the Irish credit market is highly concentrated. The SBCI seeks to engage with new entrants, having established on-lender partnerships with four non-banks. They provide essentially non-bank finance such as invoice financing (providing cash with upfront payments against the value of outstanding invoices) and lease finance. The on-lender scheme is effective in this case, since new entrants typically face difficulties in funding in the market due to information asymmetries. The SBCI should ensure that the low cost funding is made available only for a limited time to help new lenders overcome barriers to market entry.
The SBCI is diversifying its business model to engage in risk sharing (SBCI, 2017). It has taken over the operation and management of the Credit Guarantee Scheme (CGS), launched in October 2012, on behalf of the Minister of Business, Enterprise and Innovation. The CGS offers guarantees of up to 80% on SME loans, in return for a 2% annual premium to the insurer. It is the participating lenders, namely AIB, Bank of Ireland and Ulster Bank, that decide whether or not to use the scheme based on the creditworthiness of applicant firms. In other words, firms cannot apply directly for the scheme. Up until the end of 2017, 530 CGS loans were provided with a value of EUR 84.4 million (0.03% of the 2016 GDP).
If the aim of the SBCI is to support higher risk SMEs that cannot obtain finance, the CGS is more effective than the on-lender scheme. This is because private banks are unwilling to lend to high risk SMEs even with low funding costs. The CGS has scope to be developed further to address market failures such as the asymmetry of information for young firms which lack credit history and whose risks banks cannot always perceive accurately. In the OECD area, governments are strengthening the focus of SME policy on supporting start-ups, with guarantees increasingly targeting young, innovative firms more explicitly (OECD, 2016b). Such an approach should be followed in Ireland to allow greater focus on young firms, which face the most difficulty in obtaining loans. Initial credit guarantees for start-ups could cover even 100% of the loan. However, when reaching the end of their contract, any renewal of the guarantee should cover a smaller proportion.
The SBCI is diversifying its business model in risk sharing for some specific purposes. This includes the Agriculture Cash Flow Loan Scheme launched in early 2017 and the Brexit Loan Scheme which will be launched in March 2018. In both schemes, the risk is shared between private banks, the SBCI, the State and the European Investment Fund. The SBCI will complete an evaluation of the effectiveness of the Agriculture Cash Flow Loan Scheme for the future development and roll-out of the scheme. The SBCI intends to also conduct such evaluations for all other products, which should be pursued.
Maximising knowledge spillovers to local firms
One of the rationales for attracting FDI is the positive spillovers that foreign-owned firms can confer to local businesses. Forging supply linkages with foreign firms may appeal to local firms as a way to broaden their customer base or as a potential channel for training and financing opportunities. At the same time, foreign firms often value the proximity of local suppliers to their market and their ability to adjust specifications and provide inputs that are aligned with local preferences. A key channel through which such spillovers proliferate is the diffusion of new knowledge. This may be through informal interactions between producers, local firms being able to more closely examine the innovations of others or via the technical requirements embodied in procurement terms. The large and widening productivity gap between foreign-owned and domestic enterprises suggests some impairment in the knowledge diffusion process in Ireland.
The way that locally-owned firms are exposed to foreign businesses is through trade or research collaboration. The extent to which local firms have the incentive and ability to develop these relationships will depend on their prospects for growth if they succeed. In this regard, the framework policies already discussed are key. Nevertheless, local firms must also possess the absorptive capacity to successfully implement new technologies or processes to which they are exposed (Figure 1.1 further above). Past work has highlighted the importance of factors such as the human capital embedded in local firms (Bloom et al., 2012) and their investment in knowledge based capital (Griffith et al., 2004) for firm’s absorptive capacity. Once again, the incentive for firms to invest in these factors depends on the framework conditions governing the business sector. However, policy settings relating to specific areas such as innovation and education also need to be considered by policymakers.
Policies that encourage local firms to be further integrated in supply chains
Trade linkages between the foreign and domestic-owned sector can be strengthened by reducing search costs, uncertainty and a lack of information regarding available suppliers (OECD, 2005). The Irish government has a history of developing linkage programmes between foreign and local firms (Ruane and Ugur, 2002). Since 2012, the government’s Global Sourcing Strategy has utilised collaboration between the Irish Development Agency (which is responsible for inward investment promotion) and Enterprise Ireland (responsible for the development and growth of Irish enterprises in work markets) to identify possible supply chain relationships between specific MNEs and local suppliers. Potential collaborators are then introduced during agency-organised trade missions. However, between 2012 and mid-2016, only 21 new contracts were secured as a result of the initiative (Enterprise Ireland, 2016).
While the Global Sourcing Strategy has been somewhat successful so far (Enterprise Ireland, 2016), it must be ensured that it does not favour particular local firms over others. The local suppliers that are identified as part of the initiative are the export-focused businesses that are in contact with Enterprise Ireland. Often, such firms are those most likely to have the product sophistication or scale to enter supply relationships with MNEs. However, complementary initiatives providing information about the local businesses that fall outside the gaze of Enterprise Ireland (e.g. locally traded service companies or micro-enterprises) could further enhance trade linkages.
One way to promote the integration of all capable local firms into the supply chains of MNEs may be through greater involvement by the Local Enterprise Offices (which deal with many firms outside the scope of Enterprise Ireland) in the Global Sourcing Strategy. A database with standardised, updated and certified data relating to both Irish-owned and foreign-owned firms could also be established and disseminated throughout the business community. This could promote the proliferation of both forward and backward supply chain linkages between foreign and domestic-owned firms. An example of such a tool is the information system used as part of the United Nations Industrial Development Organization Subcontracting and Partnership Exchange. This system facilitates supplier and buyer matchmaking and is coupled with benchmarking assessments of suppliers’ performance (United Nations Industrial Development Organization, 2017). Nevertheless, sufficient resources need to be devoted to maintaining such a database in order for it to be effective.
Promoting innovation collaboration
Local firm’s exposure to new knowledge can also be improved through greater participation in research collaboration with outside entities. Such co-operation may be especially important for smaller and less productive firms that do not possess a large stock of advanced machinery or skilled personnel that can readily engage with the technologies and organisational processes at the technological frontier. Despite many local Irish firms possessing innovation strategies, there is significant further scope to increase innovation activities in such firms, particularly in the services sector. Indeed, there is evidence of a strong correlation in Ireland between innovation collaboration activities and firm performance (National Competitiveness Council, 2017).
Around two thirds of Irish firms are not involved in research collaboration. Small Irish firms are especially unlikely to collaborate, and report less collaborative activity than their counterparts across Europe (Eurostat, 2014). Foreign-owned enterprises located in Ireland are more likely to undertake joint research, but a large proportion of this is with firms located abroad (Figure 1.30, Panel A). Furthermore, there is evidence that the appetite of Irish firms to engage in collaboration has diminished over the past decade (Figure 1.30, Panel B).
Figure 1.30. Irish innovators are less likely to collaborate
The government has recognised the need for further promoting collaboration by firms (Department of Business, Enterprise and Innovation, 2015). This has spurred ongoing efforts by government agencies to promote collaborative activity. One initiative has been the establishment of 15 industry-led research centres by Enterprise Ireland and IDA Ireland (the Technology Centres Programme). These are collaborative research entities established and led by industry that possess qualified researchers who are affiliated with public research institutions (OECD, 2017d). At the same time, Science Foundation Ireland has established 17 research centres that aim to combine fundamental and applied research to find solutions that can ultimately have an economic impact (Box 1.3). These are important initiatives for promoting innovation collaboration, though it should continue to be ensured that there is not duplication or fragmentation of research across the different government programmes.
Box 1.3. Science Foundation Ireland research centres
Science Foundation Ireland has established 17 geographically dispersed research centres that are co-funded with industry partners. A key aim of these centres is to consolidate activities across higher education institutions in order to create a critical mass of internationally leading researchers that can be cost-effectively accessed by businesses. The centres partner with engineers and professionals in industry to answer research questions that are of strategic importance for Ireland. Specific research areas include nanotechnology, bioeconomy, photonics, big data, as well as more traditional domains such as dairy and telecommunications. There are currently over 320 companies involved in the centres through collaborative research agreements.
One such centre is AMBER (Advanced Materials and BioEngineering Research), which was born out of a collaboration between the Science Foundation Ireland Centre for Research on Adaptive Nanostructures and Nanodevices (CRANN), Trinity Centre for Bioengineering, University College Cork and the Royal College of Surgeons in Ireland. The industry partners are diverse, both in terms of sectors and scale, covering the four primary sectors of ICT, medical devices, pharmaceuticals and advanced manufacturing technologies. A primary objective of the AMBER centre is to successfully transfer the new knowledge that it creates to industry through licensing agreements, staff exchange and formal knowledge transfer. An economic impact study of the centre was undertaken in 2016, highlighting significant positive effects when the direct, indirect and induced impacts are considered. Specifically, the study found that the overall impact on the Irish economy was 5 times the funds invested in the centre over the 2007-16 period.
AMBER aims to collaborate with small and medium enterprises as much as possible, with such firms accounting for about half the industry partners. One approach that the administrators of AMBER have found successful for increasing the involvement of such firms has been to gather a group of them together to participate in a “grand challenge” research project in which they all have a common interest. This reduces the investment needed in the project by any individual firm, making it more feasible and attractive for them to participate.
As highlighted by recent OECD work, there is greater scope for promoting research collaboration between research institutions and smaller Irish businesses (OECD, 2017e). The majority of existing collaborative research programmes focus on the involvement of exporting businesses or those already in innovative industries. One of the major impediments to the participation of smaller firms may be a lack of understanding of how to engage in such collaborative activities. Research institutions should thus focus on providing simple short-term collaborative activity offerings (e.g. updating ICT capacity) that can lead to a longer term relationship and more transformational projects for the business.
Greater investment in knowledge based capital
Translating exposure to new knowledge into efficiency gains by local businesses will partly depend on their investment in knowledge based capital. This is because some aspects of new technologies are difficult to codify and require practical investigation before they can be properly incorporated into production processes (Griffith et al. 2004). Indeed, new empirical evidence highlights that productivity spillovers to local manufacturing firms in Ireland are positively associated with their investment in research and development (R&D) activities (Box 2; Di Ubaldo, Lawless and Siedschlag, 2018).
Across countries, R&D tends to be partly funded by the government given that the social returns to such activity can exceed the private returns (Arrow, 1962). In Ireland, public support for business R&D rose by 0.3% of GDP between 2006 and 2014 (Figure 1.31). However, the fact that total business R&D expenditure increased by roughly the same magnitude suggests that the additionality of the public spending (i.e. the extent to which it induced additional private R&D spending) was limited. At present, business R&D intensity in Ireland is below the OECD average. Around two thirds of Irish business R&D is also undertaken by foreign firms, with research activity in local industry much more limited. In 2015, researchers accounted for 4% of the workforce of foreign-owned firms, but only 0.7% of Irish-owned firms.
Figure 1.31. Public support to business R&D has increased significantly over recent years
Government support for business R&D, as a percentage of GDP, 2014
Public support for business R&D in Ireland is heavily skewed towards R&D tax incentives (Figure 1.31), though there are direct public support measures for R&D in higher education institutions that promote collaboration with businesses. R&D tax incentives may be appealing given that they leave firms to decide which R&D activities to fund. However, depending on their design, such policy instruments may favour less dynamic incumbents at the expense of young firms. This is because the implicit subsidy rate of such measures tends to increase with firm profitability and young firms are often in a loss-making position in the early years of an R&D project (OECD, 2015a).
The design of Ireland’s R&D tax incentives seeks to minimise any discrimination against small loss-making firms. Specifically, unused tax credits can be carried-forward indefinitely or can be refunded gradually over a three year period following the R&D funds being spent. Even so, the value of future claims for loss-making businesses is lower than the value of present claims for profitable firms due to time-discounting (Figure 1.32). Furthermore, it may be some time before young firms have sufficient upfront funds to start an R&D project. This may be a factor behind the muted R&D activity of Ireland’s small local firms: less than 1% of companies with turnover below EUR 1 million use the tax credit each year, compared with 12.5% of companies with turnover above EUR 1 million (IBEC, 2016).
Figure 1.32. Irish R&D tax incentives are more beneficial for profitable firms
Tax subsidy rates on R&D expenditures for small and medium enterprises, 2017
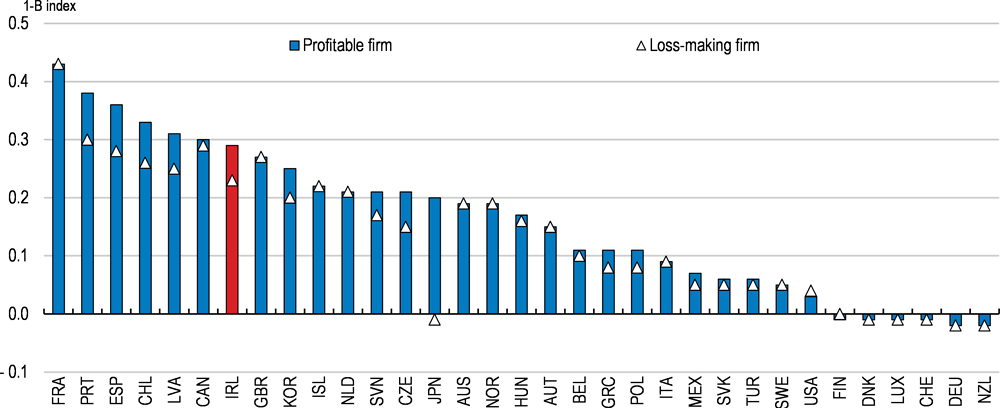
Note: (1-B-index) increases in the generosity of R&D tax incentives. Specifically, the B-index represents the required rate of pre-tax return to justify $1 of R&D outlay taking account of both R&D tax incentives and the corporate income tax rate.
Source: OECD STI Scoreboard 2017 (database).
The government could consider adjusting the design of the R&D tax incentive to be neutral across profitable and loss-making firms. However, the mix of public support for business R&D should also be rebalanced towards more direct funding measures such as grants, loans and loan guarantees. Such measures may be especially useful for encouraging the growth of young local firms that have limited internal funds but good ideas that need to be developed. Nevertheless, any such rebalancing should be coupled with measures that continue to ensure that the allocation of public funds is transparent, rules-based and subject to ex-post evaluation. The government has commissioned a report to assess existing R&D supports to identify how best to increase innovation activity in the business sector.
Improving managerial capacity and worker skills
The full potential productivity benefits of new technologies can also only be realised if skilled managers exist that can deliver complimentary changes to organisational processes. However, data from the World Management Survey suggest that managerial skills in Ireland are poor compared to other high income countries such as Germany, Sweden and the UK (Table 1.6). Across the sampled firms, the calculated management scores also exhibit greater dispersion in Ireland than in most other countries. This is consistent with the large disparities in measured productivity between foreign-owned and local firms already discussed, suggesting that the managerial skills of the latter firm may be even lower than the average management score suggests. This reflects shortfalls in Ireland’s education system: less than half the local firms surveyed by government agencies are satisfied by the business acumen of graduates against a satisfaction rate around 60% for foreign-owned firms (Higher Education Authority et al., 2015).
Table 1.6. Managerial skills and dispersion across firms
2014
|
|
Average Management Score |
Cross-firm standard deviation of Management Score |
|---|---|---|
|
DEU |
3.18 |
0.56 |
|
SWE |
3.17 |
0.52 |
|
GBR |
2.99 |
0.59 |
|
ITA |
2.95 |
0.55 |
|
PRT |
2.77 |
0.57 |
|
IRL |
2.77 |
0.77 |
|
ESP |
2.75 |
0.62 |
Note: The World Management Survey is a cross-country, cross-industry dataset built to measure the quality of management practices in establishments across multiple dimensions. The extent to which organisations use short-term targets, provides incentives for high performance and monitor performance data are all captured in the management score derived from the survey. For further details, see Bloom et al., (2014).
Source: World Management Survey.
Poor management skills may reflect the low proportion of those in employment engaged in lifelong learning activities (Figure 1.33). Many Irish-owned companies have reduced the funding being allocated to training programmes for employees over recent decades. Between 2000 and 2015, spending on formal training programmes as a share of payroll by Irish-owned firms declined in most sectors (Figure 1.34).
Figure 1.33. Lifelong learning participation is relatively low
% of the population aged 25 to 64 participating in education and training, 2015
Figure 1.34. Irish-owned companies in most sectors have reduced employee training
Funding of formal structured training as a share of payroll in Irish-owned companies, %
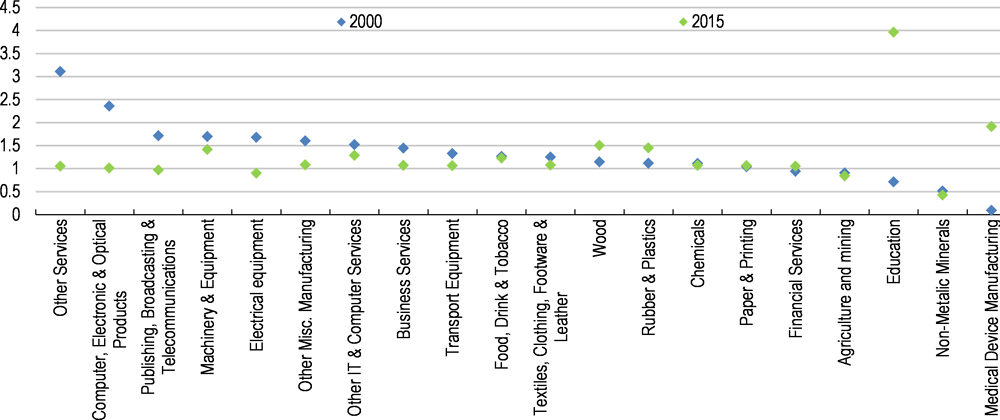
Note: Data are based on a survey of around 4200 companies that are clients of either Enterprise Ireland, IDA Ireland or Údarás na Gaeltachta that have at least ten employees.
Source: Department of Business, Enterprise and Innovation.
Employers need to be encouraged to fund more training for employees. A relatively low proportion of training opportunities are provided by employers at present (Expert Group on Future Skills Needs, 2016), a factor behind the low lifelong learning rates of workers. Training programmes that focus on enhancing managerial skills are likely to be particularly beneficial for promoting the effective adoption of new technologies and processes, and hence productivity spillovers. A first step should be to increase the prominence of evaluations, highlighting those programmes with the greatest benefits in terms of firm performance. Encouragingly, the Department of Education and Skills is currently investing resources in data collection and programme evaluation.
The government could also allocate a greater share of funding under the National Training Fund to training for those in employment. This may go towards unwinding the past funding cuts to the Skillnets programmes, which were heavily work-based training courses designed in collaboration with firms (IBEC, 2016). Broadening financial support to students undertaking part-time and postgraduate courses could also encourage lifelong learning (Expert Group on Future Funding for Higher Education, 2015). The costs of boosting training of workers could be shared between the government and employers, with the contribution of the latter collected through an increase in the levy they pay towards the National Training Fund. Furthermore, the impact on firm competiveness would be mild, leaving the tax wedge on employment income in Ireland around 8½ per cent below the OECD average level.
The increase in the demand for skills may also be met through expanding the role of online education. Such a delivery method holds great potential in Ireland, given the roll out of the National Broadband Plan over the coming years. That said, inadequate digital skills of the population may limit the proliferation of such courses: only 48% of Irish individuals had basic or above basic digital skills in 2017, which was 9 percentage points below the EU average (Eurostat, 2017).
Managerial skills in locally-owned firms could also be enhanced by attracting workers from foreign-owned enterprises. Past empirical analysis has identified the movement of workers from locally-based MNEs to local firms as a channel for strengthening productivity growth in OECD countries (Balsvik, 2011; Martins, 2005). The fact that most FDI in Ireland derives from the US should increase the potential for labour flows between foreign-owned and local firms, given the common language and cultural similarity of the two countries. Nevertheless, a significant impediment for attracting personnel to the local sector is the substantially lower wages paid. In 2015, the average wage in a foreign-owned firm in Ireland was over 50% higher than in a local firm (Figure 1.35).
Figure 1.35. Wages are substantially lower in local firms
Ratio of wages in foreign firms to local firms
Personnel at senior management level could be attracted from MNEs by being offered company equity or stock options in a local firm. However, stock options have traditionally been an unattractive form of remuneration to employees in Ireland as they have carried income tax and social charge liabilities when they are exercised as well as capital gains tax when they are sold (IBEC, 2015b). In a welcome move, the government introduced a new scheme in the 2018 Budget aimed at lowering the tax burden on stock options in small and medium sized enterprises. Under the programme, share options will only be taxed upon their disposal at the capital gains tax rate. The basis on which firms will be deemed eligible to participate in the programme is not yet clear. The authorities should exercise caution if they plan to make eligibility contingent on firms being below a given size threshold given that such a policy design may disincentivise firm growth (Chen and Mintz, 2011). In addition, the scale of any adverse impacts on income inequality from the new scheme should be evaluated and kept in mind.
In some cases, non-compete agreements embedded in MNE employment contracts restrict employees willing to move to local firms from doing so. In the US, where most MNEs located in Ireland derive from, around 20% of employees have such clauses in their employment contract (Starr et al., 2017). While these measures may increase the incentive for firms to invest in education and other professional development for their workers (Starr, 2017), they may also restrict the potential for knowledge spillovers between firms within a given country (US Department of the Treasury, 2016). As such, the authorities should evaluate the extent to which such provisions may be limiting worker mobility in the Irish context.
Recommendations to encourage sustainable productivity growth
Enhancing business dynamism
Key recommendations:
Reduce the price of construction permits and registration of property charged by the relevant authorities.
Replace local business tax with a broad-based land tax.
Permit the introduction of new forms of legal businesses.
Systematically collect information on the performance of existing public assets to better enable transparent, evidence-based, prioritisation of future infrastructure projects.
Other recommendations:
Reduce the administrative burden to obtain permits and licences for start-ups by fully developing the new on-line Integrated Licence Application Service.
Develop the out-of-court debt resolution mechanisms, making it easier for the debtor and creditor to reach agreements by reducing stringent requirements.
Enhancing the allocation of financing
Key recommendations:
Introduce guidelines for banks that specify circumstances under which personal guarantees from businesses should not be sought.
Further develop alternative financing platforms for young businesses.
Other recommendations:
Consider reforming the Employment and Investment Incentive Scheme, a tax relief for equity investors, to support the transition of innovative firms into the public stock exchange.
Scale up the Microenterprise Loan Fund Scheme so that public financial support reaches firms in early stages and in a wide range of sectors.
Focus the Credit Guarantee Scheme on overcoming market failures that young firms typically face rather than supporting mature firms.
Maximising knowledge spillovers
Key recommendations:
Increase the use of direct public support for business research and development such as grants, loans and loan guarantees.
Increase the share of funding dedicated to training for those in employment and financial support to workers undertaking postgraduate courses.
Other recommendations:
Raise the participation of local firms in the supply chains of foreign-owned enterprises by giving Local Enterprise Offices a more active role in identifying potential supply linkages.
Evaluate the extent to which non-compete agreements are constraining workers moving to local firms.
Bibliography
ACER (2016), Annual Report on the Results of Monitoring the Internal Electricity and Gas Markets in 2015, November 2016, Agency for the Cooperation of Energy Regulators.
Adalet McGowan, M., and D. Andrews (2016), “Insolvency Regimes and Productivity Growth: A Framework for Analysis”, OECD Economics Department Working Papers, No. 1309, OECD Publishing, Paris.
Adalet McGowan, M., D. Andrews, and V. Millot (2017a), “The Walking Dead?: Zombie Firms and Productivity Performance in OECD Countries”, OECD Economics Department Working Papers, No. 1372, OECD Publishing, Paris.
Adalet McGowan, M., D. Andrews, and V. Millot (2017b), “Insolvency Regimes, Zombie Firms and Capital Reallocation”, OECD Economics Department Working Papers, No. 1399, OECD Publishing, Paris.
AIB (2017), Annual Financial Report 2016 for the Financial Year Ended 31 December 2016, Allied Irish Banks.
Andrews, D., and F. Petroulakis (2017), “Breaking the Shackles: Zombie Firms, Weak Banks and Depressed Restructuring in Europe”, OECD Economics Department Working Papers, No. 1433, OECD publishing.
Andrews, D., and A. Saia (2016), “Coping with Creative Destruction: Reducing the Costs of Firm Exit”, OECD Economics Department Working Papers, No. 1353, OECD Publishing, Paris.
Andrews, D. et al. (2018), “Confronting the Zombies: Insolvency and Financial Reform, Corporate Restructuring and Productivity Growth”, OECD Economics Department Working Papers, forthcoming.
Armour, J., and D. Cumming (2008), “Bankruptcy Law and Entrepreneurship”, American Law Economic Review, Vol. 10, No. 2.
Arrow, K.J. (1962), “Economic Welfare and the Allocation of Resources to Invention”, The Rate and Direction of Inventive Activity, Princeton University Press.
Balsvik, R. (2011), “Is labor mobility a channel for spillovers from multinationals? Evidence from Norwegian manufacturing”, The Review of Economics and Statistics, Vol. 93, No. 1.
Bank of Ireland (2017), Annual Report for the Year Ended 31 December 2016, Bank of Ireland.
Bartelsman, E.J., J. Haskel, and R. Martin (2008), “Distance to Which Frontier? Evidence on Productivity Convergence from International Firm-level Data”, CEPR Discussion Papers, No. 7032.
Berkowitz, J. and M. White (2004), “Bankruptcy and Small Firms’ Access to Credit”, RAND Journal of Economics, Vol. 35.
Berlingieri, G. et al. (2017), “The MultiProd Project: a Comprehensive Overview”, OECD Science, Technology and Industry Working Papers, No. 2017/04, OECD Publishing, Paris.
Bloom, N. et al. (2014), “The new empirical economics of management”, NBER Working Paper, No. 20102.
Bloom, N. et al. (2012), “Americans do IT better: US multinationals and the productivity miracle”, American Economic Review, Vol. 102, No. 1.
Caballero, R., T. Hoshi and A. Kashyap (2008), “Zombie Lending and Depressed Restructuring in Japan”, American Economic Review, Vol. 98, No. 5.
Calvino, F., C. Criscuolo, and C. Menon (2016), “No Country for Young Firms?: Start-up Dynamics and National Policies”, OECD Science, Technology and Industry Policy Papers, No. 29, OECD Publishing, Paris.
Carroll, J., and McCann, F. (2016), “Understanding SME Interest Rate Variation across Europe”, Quarterly Bulletin Articles, Central Bank of Ireland, March: pp. 60-76.
Casey, E., and C. O’Toole (2014), “Bank-lending Constraints and Alternative Financing during the financial Crisis: Evidence from European SMEs”, ESRI Working Paper No. 450, Economic and Social Research Institute.
CBI (2017), Macro-Financial Review 2017: I, June 2017, Central Bank of Ireland.
CCPC (2012), National Consumer Agency: Solicitors – Fees Charged & Price Availability, February 2012, National Consumer Agency (Competition and Consumer Protection Commission).
Chen, D. and J. Mintz (2011), “Small business taxation: revamping incentives to encourage growth”, The School of Public Policy Research Papers, Vol. 4, No. 7, University of Calgary.
Conway, P., and G. Nicoletti (2006), “Product market regulation in the non-manufacturing sectors of OECD countries”, OECD Economics Department Working Paper, No. 530, OECD Publishing, Paris.
Cumming, D. (2012), “Measuring the Effect of Bankruptcy Laws on Entrepreneurship across Countries”, Journal of Entrepreneurial Finance, Vol. 16.
Cournède, B., and O. Denk (2015), “Finance and Economic Growth in OECD and G20 Countries”, OECD Economics Department Working Papers, No. 1223, OECD Publishing, Paris.
CRO (2017), Companies Registration Office Report 2016, Companies Registration Office.
CSO (2013), Regional Population Projections 2016-2031, CSO Statistical Release, 12 December 2013, Central Statistics Office.
CSO (2014), Access to Finance, Central Statistics Office.
de Mooij, R. A (2011) “Tax Biases to Debt Finance: Assessing the Problem, Finding Solutions”, IMF Staff Discussion Note, SDN/11/11, International Monetary Fund.
Department of Business, Enterprise and Innovation (2015), Innovation 2020: Ireland’s strategy for research and development, science and technology, December.
Department of Public Expenditure and Reform (2017a), Report of the Mid-Term Review of the Capital Plan: Building on Recovery 2016-2021, August.
Department of Public Expenditure and Reform (2017b), Exchequer Capital Envelopes 2018-21: outcomes of Mid-term Review of The Capital Plan, Central Capital Policy Section.
Department of Finance (2018), “Patterns of firm level productivity in Ireland”, forthcoming.
Department of Finance (2017), SME Credit Demand Survey: October 2016 – March 2017.
Di Ubaldo, M., M. Lawless and I. Siedschlag (2018) “Productivity spillovers from multinational activity to indigenous firms in Ireland”, ESRI Working Paper, forthcoming.
Enterprise Ireland (2016), Enterprise Ireland and IDA Joint Trade Mission in Ireland opens doors for Irish SMEs with Irish based multinationals, Press Release.
Enterprise Ireland (2017), Seed and Venture Capital 2016 Report, Enterprise Ireland.
European Commission (2013), Commission Decision of 12.4.2013 pursuant to Article 3(1) of Regulation (EC) No 714/2009 and Article 10(6) of Directive 2009/72/EC – Ireland – Eirgrid / ESB, European Commission.
Eurostat (2017), Digital Skills of Individuals Dataset, (accessed on 13 February 2018).
Eurostat (2014), Community Innovation Survey Dataset, (accessed 24 May 2017).
Expert Group on Future Funding for Higher Education (2015), “The Role, Scale and Value of Higher Education in Ireland”, Discussion Paper for Stakeholder Consultation, January 2015.
Expert Group on Future Skill Needs (2016), “Lifelong learning participation among adults in Ireland”, EGFSN/SOLAS Skills Snapshot, July 2016.
Görg, H. (2007), “Productivity spillovers from multinational companies”, in Perspectives on Irish Productivity, Forfás.
Griffith, R., S. Redding and J. Van Reenen (2004), "Mapping the Two Faces of R&D: Productivity Growth in a Panel of OECD Industries", The Review of Economics and Statistics, Vol. 86, No. 4.
Hart, O. (2000), “Different Approaches to Bankruptcy”, NBER Working Paper Series, No. 7921.
Higher Education Authority et al. (2015), National Employer Survey: Employers’ View on Irish Further Education and Training Outcomes, May 2015.
Holton, S., and F. McCann (2016), “Sources of the small firm financing premium: Evidence from euro area banks”, Research Technical Papers 09/RT/16, Central Bank of Ireland.
IBEC (2016), “IBEC priorities for Budget 2017: compete to succeed”, Irish Business and Employers Confederation.
IBEC (2015a), “Does the infrastructure and capital investment framework for 2016-21 go far enough?”, IBEC Policy Brief, Issue 4, November.
IBEC (2015b), “IBEC submission to the consultation on the taxation of entrepreneurship”, A submission to the Department of Finance, July 2015.
IMF (2017), “Ireland Public Investment Management Assessment”, Technical Assistance Report, September 2017.
Interdepartmental Committee on Science, Technology and Innovation (2015), Innovation 2020: Ireland’s strategy for research and development, science and technology, December 2015.
ISI (2017), ISI Statistics Quarter 4 2016, Insolvency Service of Ireland.
Johansson, Å. et al. (2013), “Long-Term Growth Scenarios”, OECD Economics Department Working Papers, No. 1000, OECD Publishing.
Kennedy, A. (2016), “Public capital: investment, stocks and depreciation”, Analytical Note No. 9, Irish Fiscal Advisory Council.
Lawless, M. and Z. Studnicka (2017), “Services exports and exporters of services”, ESRI, Department of Jobs, Enterprise and Innovation and Enterprise Ireland, April.
Lawless, M., F. McCann, and C. O’Toole (2013), “The Importance of Banks in SME Financing: Ireland in a European context”, Central Bank of Ireland, Economic Letter No. 5.
Lawless, M., C. O’Toole, and D. Lambert (2014), Financing SMEs in Recovery: Evidence for Irish Policy Options, Report prepared for the Department of Finance, the Economic and Social Research Institute.
Marinc, M. and R. Vlahu (2012), The Economics of Bank Bankruptcy Law, Springer-Verlag, Berlin Heidelberg.
Martins, P.S. (2005), “Inter-firm employee mobility, displacement and foreign direct investment spillovers”, mimeo.
McCann, F. (2014), “Profiling the Indebtedness of Irish SMEs”, Central Bank of Ireland, Economic Letter No. 3.
Melitz, M.J., and S. Polanec (2015), “Dynamic Olley-Pakes Productivity Decomposition with Entry and Exit.” RAND Journal of Economics 46 (2): 362-375.
Microfinance Ireland (2017), Report on the Microenterprise Loan Fund Scheme as at 31st March 2017, Microfinance Ireland.
Mirrlees, J., A. Stuart, T. Besley, R. Blundell, S. Bond, R. Chote, M. Gammie, P. Johnson, G. Myles, and J. Poterba (2011), Tax by Design, Oxford University Press, Oxford.
NCC (2017), Costs of Doing Business in Ireland 2017, June 2017, National Competitiveness Council.
NCC (2016), Ireland’s Competiveness Challenge, December 2016 National Competitiveness Council.
OECD (2017a), Science, Technology and Industry Scoreboard 2017, OECD Publishing, Paris.
OECD (2017b), Getting Infrastructure Right: A framework for better governance, OECD Publishing, Paris.
OECD (2017c), Entrepreneurship at a Glance 2017, OECD Publishing, Paris.
OECD (2017d), OECD Reviews of Innovation Policy: Costa Rica 2017, OECD Publishing, Paris.
OECD (2017e), OECD Skills Studies: Supporting Entrepreneurship and Innovation in Higher Education in Ireland, OECD Publishing, Paris.
OECD (2016a), OECD Economic Outlook 2016, OECD Publishing, Paris.
OECD (2016b), Financing SMEs and Entrepreneurs 2016: An OECD Scoreboard, OECD Publishing, Paris.
OECD (2015a), The Future of Productivity, OECD Publishing, Paris.
OECD (2015b), Science, Technology and Industry Scoreboard 2015, OECD Publishing, Paris.
OECD (2015c), New Approaches to SME and Entrepreneurship Financing: Broadening the Range of Instruments, OECD Publishing, Paris.
OECD (2015d), OECD Economic Surveys: Ireland 2015, OECD Publishing, Paris.
OECD (2005), “Encouraging linkages between small and medium-sized companies and multinational enterprises”, An overview of good policy practice by the OECD Investment Committee, 10 November, 2005.
O’Toole, C. M. (2014), “SME Lifecycle and Non-Bank Financing in Europe: What Determines Usage?”, Dublin: Central Bank of Ireland, Draft Research Technical Paper.
Ruane, F. and A. Ugur (2002), “Foreign direct investment and productivity spillovers in the Irish manufacturing industry: evidence from firm level panel data”, Trinity Economic Papers, No. 20026. Trinity College, Dublin.
SBCI (2017), Annual Report & Financial Statements 2016, Strategic Banking Corporation of Ireland.
Smith, D. and P. Strömberg (2005), “Maximizing the Value of Distressed Assets: Bankruptcy Law and the Efficient Reorganization of Firms”, in L. Laeven and P. Honohan (ed.) Systemic Financial Crises: Containment and Resolution, Cambridge University Press.
SOLAS (2016), National Skills Bulletin 2016, September 2016, Further Education and Training Authority (SOLAS).
Starr, E. et al. (2017), “Noncompetes in the US Labor Force”, mimeo.
Starr, E. (2017), “Consider this: training, wages and the enforceability of covenants not to compete”, mimeo.
United Nations Industrial Development Organization (2017), The UNIDO Subcontracting and Partnership Exchange Programme, Vienna.
US Department of the Treasury (2016), “Non-compete contracts: economic effects and policy implications”, Office of Economic Policy, March 2016.
World Bank (2017), Doing Business 2017: Equal Opportunity for All, Washington, DC.
