This chapter puts the Swedish corporate bond market in an international context, comparing it with selected European and non-European markets. It also discusses some of the regulatory aspects that affect the secondary corporate bond market and its functioning, such as transparency rules in trading and pricing.
The Swedish Corporate Bond Market

3. The Swedish corporate bond market in an international comparison
Abstract
This chapter provides a comparison of the Swedish market with a number of countries/regions with respect to both the primary and secondary markets. The quantitative analysis in this section does not include real estate companies.
3.1. Market size and characteristics
Testament to the sharp growth in Swedish bond markets, since 2005 the share of debt securities in non‑financial companies’ total financial debt has grown faster in Sweden than in any of the other regions shown below. Between 2005 and 2019, the share increased by 61% in Sweden, compared to 15% in the United Kingdom, 12% in the United States and 32% in the Euro Area (Figure 3.1, Panel A). The share dropped somewhat thereafter but recovered in 2023. As a result of this growth, Sweden now has a higher share of debt securities in total financial debt than the euro area aggregate. At the end of the second quarter of 2023 it was 16%, compared to 11% in the euro area and 20% in the United Kingdom. In the United States, the share of debt securities in total financial debt was 60% (Panel B).
Figure 3.1. Debt securities, share in total financial debt
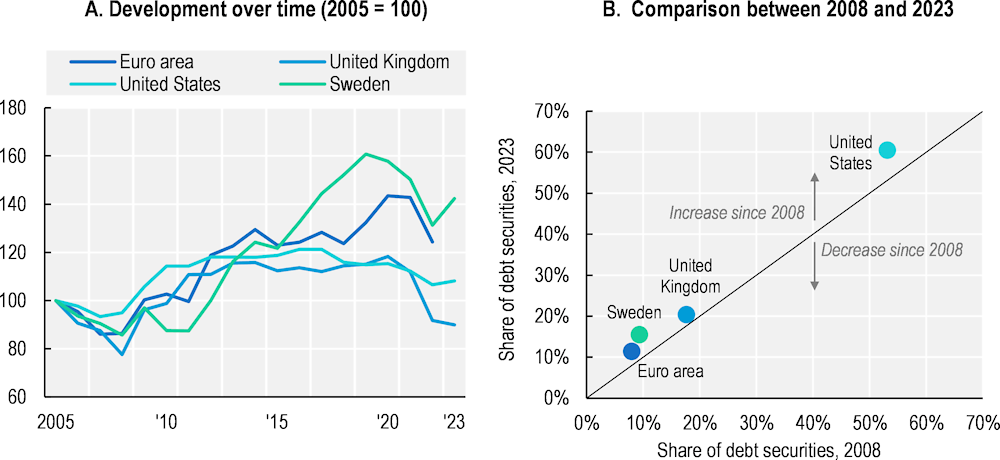
Note: Panel A shows the share of debt securities (long-term and short-term) in total debt financing (the sum of total loans and total debt securities) for non-financial companies. 2023 data as of Q2-2023. Data for the euro area are for Q4-2022.
Source: ECB; Swedish Financial Accounts from Statistics Sweden (SCB); UK Office for National Statistics; US Federal Reserve.
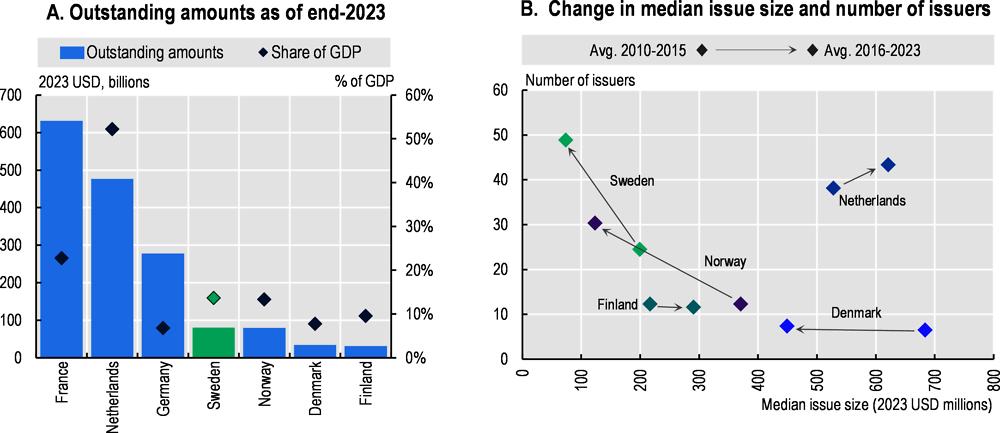
Sweden has the largest non-financial corporate bond market in the Nordics. At the end of 2023, the total outstanding amount was USD 80 billion, equivalent to 14% of GDP, slightly higher than in Norway (13% of GDP), and much higher than in Denmark (8% of GDP) and Finland (10% of GDP). However, it is still significantly smaller than certain European peers, notably the Netherlands, where the total outstanding amount represents 52% of GDP (Figure 3.2, Panel A).
The Swedish market’s development over time differs from many other countries. Panel B below shows how the number of issuers and median issue size have changed between the periods 2010‑15 and 2016‑23 (averages for both periods). A movement upwards (downwards) indicates an increase (decrease) in the number of issuers, whereas a move to the left (right) indicates a decrease (increase) in the median issue size. Notably, Sweden has moved upwards to the left, almost doubling the number of unique issuers while decreasing the median issue size by more than 60%. As mentioned when discussing Figure 2.11, this shows how the market has expanded to include a larger number of smaller companies. In fact, in 2021 Sweden had more issuers than the much larger Dutch market. Norway has followed a similar trajectory. Contrarily, in the Netherlands both the number of issuers and the median issue size have increased. The Danish and Finnish markets remain limited in size, with no more than 7 and 12 issuers in 2023, respectively.
Figure 3.2. Non-financial corporate bond markets, international comparison
Source: OECD Capital Market Series dataset, LSEG, see Annex for details.
The industry composition of corporate bond issues in Sweden has changed, as shown in Figure 2.13, and the degree of concentration has increased somewhat. As shown in Figure 3.3, the dominant industry changed (from utilities to industrials) between 2000‑11 and 2012‑23, and the share of the top industry in total issuance increased from 29% to 34%.1 This level of concentration places Sweden at the higher end among its peers. Norway has the highest degree of concentration, with the energy sector representing 50% (63%) of total issuance in 2012‑23 (2000‑11). In the past decade, the countries with the lowest industry concentration were the Netherlands and the United States, both with consumer cyclicals at 18% and 17% respectively (Panel B).
Figure 3.3. Industry concentration, total non-financial issuance (not including real estate)

Source: OECD Capital Market Series dataset, LSEG, see Annex for details.
Looking at the share of the top ten issuers in total issuance offers another measure of market concentration as well as an indication of how the market has changed over time. Figure 3.4 below provides an international comparison of how that share changed from 2005-2015 to 2016-2023. Concentration decreased in seven out of the eight countries/regions shown below, by an average of 11%. Concentration increased marginally in the United States (although from a much lower level than the other countries). In Sweden the decrease was as much as 27 percentage points, indicating the extent to which the market has broadened. Its concentration is now slightly less than the EU average.
Figure 3.4. Top ten issuers’ share in total issuance
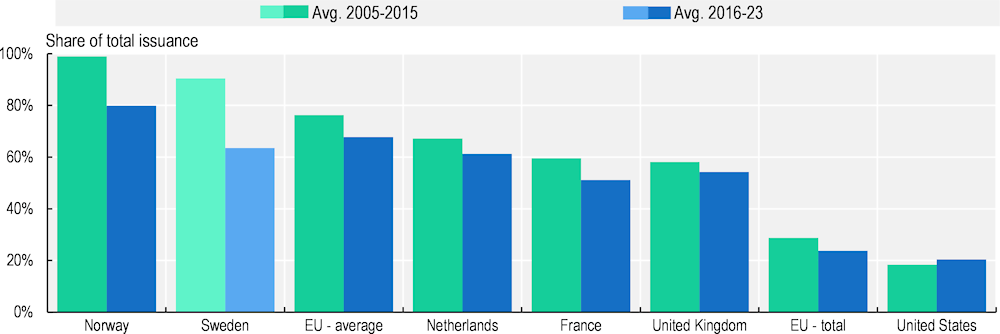
Note: “EU – average” refers to the weighted average of the EU27; it is calculated by adding up the top 10 issuers’ total issuance in each EU country in each year and then dividing that sum by the total issuance in the EU. “EU – total” refers to the share of the 10 largest issuers in the EU as a whole.
Source: OECD Capital Market Series dataset, LSEG, see Annex for details.
Many companies are active internationally and have revenues in several different currencies, making foreign currency borrowing a useful tool for matching payments and revenues and reducing exchange rate risk exposure. It may also be a strategy for obtaining lower financing costs, as illustrated by the fact that between 2015 and 2017, when US and euro area interest rates diverged as the Federal Reserve began tightening monetarily policy while the ECB maintained an expansionary position, US companies issued record levels of euro-denominated debt (8% of total issuance during the period) (Çelik, Demirtaş and Isaksson, 2019[44]).
Panel A in Figure 3.5 below shows the share of domestic currency issuance since 2010 in different regions. The increase in domestic currency issuance in Sweden earlier shown in Figure 2.7 is clearly visible. Unsurprisingly, companies in the United States (94% in 2023) and the EU (81%) predominantly finance themselves with domestic currency denominated debt, given their globally dominant currencies and the significant size of their internal markets. In 2023, 53% of Swedish non-financial bonds by amount were issued in the domestic currency, higher than companies in the United Kingdom (which issue significant amounts in both EUR and USD).
Panel B shows the average foreign currency-denominated issue size between 2010‑23 as a multiple of the average domestic-currency issue size across countries. A higher multiple indicates a larger difference between average amounts raised in foreign currency and domestic currency issues. As expected, smaller countries with smaller domestic corporate bond markets show higher multiples, suggesting that large companies that issue in foreign markets issue relatively larger amounts compared to those issuing domestically. In Sweden, the average foreign-currency denominated bond is 3.9 times larger than the average SEK-denominated bond. In Norway, which has a smaller non-financial corporate bond market than Sweden but some very large companies (notably in the energy sector), the multiple is as high as 5.8x.
Figure 3.5. Foreign/domestic currency issuance across regions
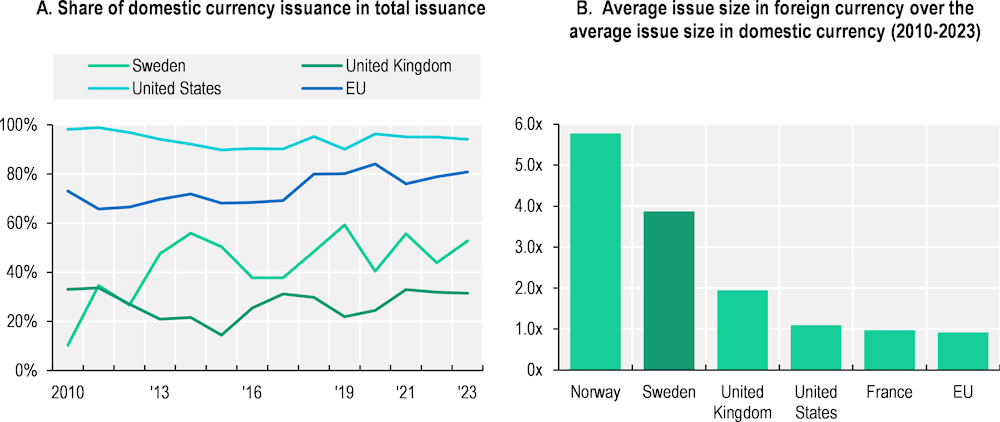
Note: Foreign currency issuance within the EU could for example be an EU country outside of the euro zone issuing a bond in euros.
Source: OECD Capital Market Series dataset, LSEG, see Annex for details.
As discussed in Chapter 2 (and shown in Figure 2.3), Sweden has a high share of bonds without credit ratings (even when including local ratings). Figure 3.6 compares this share with those in other countries. In terms of amounts, Sweden had the third highest share of unrated bonds among the countries below in the period from 2000 to 2023. At 21% of aggregate issuance, it is lower than in Finland and Norway but 3.5 times higher than the share in France and almost six times higher than the share in the Netherlands. The figures are similar when looking at the number of unrated bonds instead (which is generally higher since larger issues are more likely to have credit ratings). Unrated issuers in Sweden include smaller companies as well as large, well-known companies (Wollert, 2020[13]).
Figure 3.6. Share of unrated corporate bonds in total non-financial issuance, 2000‑23
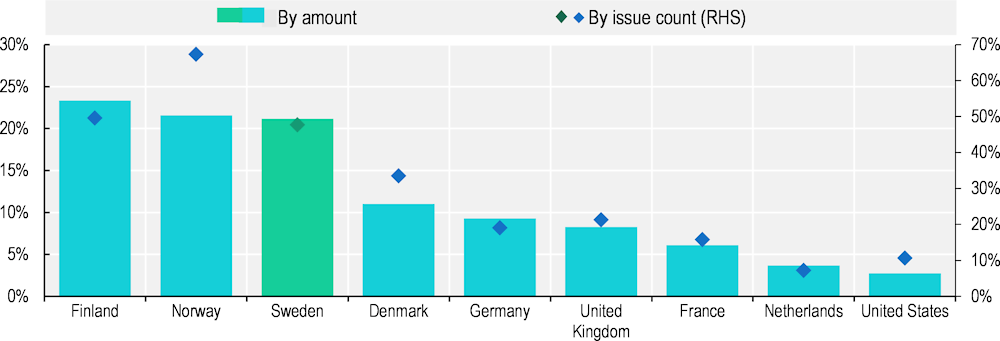
Note: Refers to bonds not rated by either S&P, Moody’s or Fitch. As illustrated in Figure 2.4, including local ratings has a negligible impact.
Source: OECD Capital Market Series dataset, LSEG, see Annex for details.
Issuing a bond involves a number of costs that can be significant to smaller companies. The issuance cost varies across regions. For example, in the United States the cost is estimated to be around 0.6% of the total proceeds, whereas in Europe the median cost is approximately 0.4% (OECD, 2017[45]). In addition to the fees paid to the underwriting bank and other advisors as well as the cost of obtaining a credit rating, listing the bonds on an exchange involves listing fees. Table 3.1 below provides a comparison of the fees charged by the four most common exchanges used by Swedish non-financial companies that list their bonds: Nasdaq Stockholm, Luxembourg, London and Dublin (see also Figure 2.8). The figures are calculated for two different principal amounts, EUR 50 million and EUR 500 million, and assumes a five‑year maturity. All fees refer to the full five‑year period. Notably, the Stockholm exchange has no registration fees, only annual maintenance fees. The opposite model applies on the London Stock Exchange, which only charges fees at the time of listing but not afterwards. For both a smaller bond with a face value of EUR 50 million and a larger one of EUR 500 million, the Luxembourg exchange charges the lowest fees, although the differences are relatively small, especially compared to the London and Stockholm exchanges.
Table 3.1. Cost of listing a bond with a maturity of five years, by exchange
|
EUR |
Stockholm |
Luxembourg |
London |
Dublin |
|---|---|---|---|---|
|
Principal: EUR 50m |
||||
|
Approval fee (one‑off) |
- |
3 000 |
2 320 |
8 500 |
|
Listing fee (one‑off) |
- |
1 500 |
6 699 |
540 |
|
Maintenance fee (annual) |
9 962 |
2500 |
- |
16 500 |
|
Total (5 years) |
9 962 |
7 000 |
9 019 |
25 540 |
|
Principal: EUR 500m |
||||
|
Approval fee (one‑off) |
- |
3 000 |
2 320 |
8 500 |
|
Listing fee (one‑off) |
- |
1 500 |
6 960 |
540 |
|
Maintenance fee (annual) |
9 962 |
3500 |
- |
16 500 |
|
Total (5 years) |
9 962 |
8 000 |
9 280 |
25 540 |
Note: As of October 2023. Assumes listing on the Standard/Regulated Tier of each market. Includes approval fees paid to regulators. Excludes VAT. Maturity is assumed to be five years, and costs refer to the full cost over that period. It is assumed that it is the issuer’s first bond listing – discounts are sometimes given for subsequent listings. For Euronext Dublin, the approval fee includes: Euronext Document Fee and Central Bank of Ireland Document Fee, while the listing fee refers to the formal notice fee.
Source: Nasdaq Stockholm, Bourse de Luxembourg, London Stock Exchange and Euronext Dublin.
As noted in Section 2.5, investment funds make up a substantial share of domestic ownership of Swedish corporate bonds. Figure 3.7 below shows that the holdings of investment funds are also higher than in some other countries, most notably Denmark, the Netherlands and France. That can have financial stability implications. Investment funds, most notably open-ended funds, need to trade actively in the secondary market in response to fund in- and outflows. Open-ended corporate bond funds effectively offer short-term liquidity based on a portfolio of mostly illiquid instruments. When the share of total ownership by such funds is high, it can expose the market to significant pressure in times of financial turmoil. The regulatory measures taken with respect to investment fund redemptions in response to the COVID‑19 crisis discussed under section 2.8.2 seek to mitigate that risk. Contrarily, long-term investors such as pension funds and insurance companies trade in the secondary market to a much lesser extent, if at all, typically holding bonds to maturity. As also shown in the graph below, the share of such investors is low in Sweden compared to the Netherlands, Denmark and France. In the Netherlands, for example, the share of pension and insurance fund ownership is two and a half times higher than in Sweden. However, while long-term investors tend to offer more stability, the tool through which they do so – holding until maturity – has detrimental impacts on secondary market liquidity. That does not necessarily imply that the reverse is true: having a large share of investors that need to be active in secondary market trading does not necessarily create more liquidity. If active secondary market investors’ demand is highly correlated (for example selling in a downturn in response to increased redemptions), the market will be one‑sided, with no beneficial effects on liquidity. Indeed, the fact that Sweden has a high share of investment fund investors does not seem to have had any significant positive impact on secondary market liquidity.
It is worth noting that increasing ownership of corporate bonds by open-ended funds is a global trend. Over the past ten years, the exposure to corporate bonds by open-ended funds and exchange traded funds have increased substantially (OECD, 2024[24]).
Figure 3.7. Domestic ownership of non-financial corporate bonds by investor type, Q2‑2023
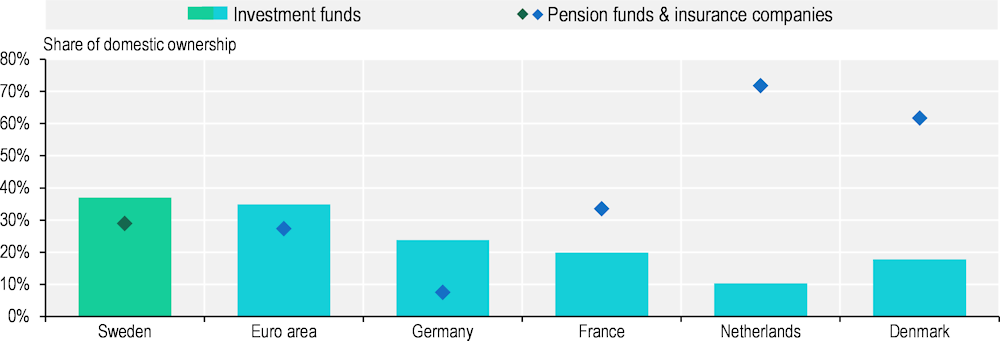
Note: Data for the euro area refer to Q4-2022.
Source: ECB.
3.2. Transparency and disclosure rules for corporate bond trading
An important aspect of the functioning of a corporate bond market is the rules that apply with respect to transparency and disclosure. These affect the liquidity and price discovery mechanism of the market as well as investor confidence. Transparency rules, when functioning properly, can also help regulators detect potential misconduct and unfair pricing. However, a balance needs to be struck to ensure adequate transparency without discouraging dealer intermediation, in particular for illiquid bonds. As discussed under section 2.8, the waivers applicable under the existing MiFIR/D II framework actually led to a decrease in transparency in the Swedish bond market. To put the Swedish and European frameworks into context, this section offers an international comparison of how transparency and disclosure rules apply on other bond markets, notably in the United States.
Since different rules typically apply depending on the listing status of a bond, it is useful to first clarify the terminology used. Table 3.2 below provides a summary of the terminology applied, which is in line with IOSCO (2017[46]). Note that, according to the IOSCO definitions, a bond that is only admitted to trading on a non-exchange trading venue such as an alternative trading system (ATS), an organised trading facility (OTF) or, most notably in Sweden, a multi-lateral trading facility (MTF), is considered unlisted, which may differ from the national understanding of what it means to be “listed”.
There are substantial cross-country differences in transparency and reporting requirements, both in terms of design and application. In addition, there are differences with respect to pre‑ and post-trade transparency rules (as mentioned in Chapter 2, due to waivers in MiFIR/D II, all investment firms trading in Swedish bonds are exempt from pre‑trade disclosure). For example, for regulatory reasons, most corporate bonds in the EU are listed, while trading is primarily done OTC. However, under MiFIR/D II transparency rules apply based on listing status rather than mode of trading, meaning that any trade – including OTC – in a listed bond is subject to the rules under the MiFIR/D II framework. In the United States and Canada, where most bonds are unlisted and traded OTC, there are elaborate transparency rules applicable to trading in these securities. Listed bonds usually have to comply with the rules set by the exchange on which they are listed (IOSCO, 2017[46]).
Table 3.2. Terminology – bond types
|
Status |
Description |
Possible trading venues |
|---|---|---|
|
Listed |
Bonds listed or admitted to trading on a regulated exchange. |
|
|
Unlisted |
Any bond not listed on a regulated exchange. Includes bonds admitted to non-exchange trading venues. |
|
Source: IOSCO (2017[46]), Regulatory Reporting and Public Transparency in the Secondary Corporate Bond Markets, https://www.iosco.org/library/pubdocs/pdf/IOSCOPD578.pdf.
The United States has a well-developed system for OTC trading called the Trade Reporting and Compliance Engine (TRACE), which has been in place since 2002. TRACE is operated by the Financial Industry Regulatory Authority (FINRA), a self-regulatory organisation authorised by the US Congress to oversee broker-dealer operations.2 All broker-dealer member firms are obliged to report OTC transactions in TRACE‑eligible securities under rules approved by the Securities and Exchange Commission (SEC) (FINRA[47]). Through this system, prices and trade volumes are disseminated to market participants in near real time for OTC trading. In addition to intra-day data, the system also provides aggregate trading statistics (e.g. most active bonds, total volume traded, etc.) at the end of each day (at 19.00 Eastern Time). As discussed above, due to the nature of the instrument, the impact of increased transparency on the liquidity of corporate bond markets is not entirely clear-cut. For this reason, TRACE was phased in gradually, allowing for a continuous study of its effect on liquidity. In the first years, the reporting window was successively shortened from 75 minutes after a transaction was completed, down to within 15 minutes since early January 2006. The scope of securities was also gradually expanded, initially including primarily large (USD 1 billion or above) bonds with high credit ratings. By early 2005, it had been expanded to cover 99% of all public transactions in eligible securities. After a transaction has been reported, it is immediately disseminated through TRACE. These data are then accessible through all major data vendors and to retail investors on the FINRA website (CFA Institute, 2011[48]). In 2024, FINRA proposed an amendment to further reduce the reporting delay to one minute (US SEC, 2024[49]).
Contrary to some expectations, TRACE has not led to a greater concentration in dealers (see discussion on dealer incentives under section 2.8). Dealer activity has instead remained rather high and no significant detrimental effects on dealer-provided liquidity have been observed. More generally, a meta‑study of the effect of transparency on liquidity (including other markets and systems than the US and TRACE), found that a majority of studies indicated that higher transparency is at least somewhat beneficial (CFA Institute, 2011[48]).
As discussed in Section 2.8, despite the intentions of MiFIR/D II regulations to increase transparency in the corporate bond market, the waivers included have de facto had the opposite effect. This experience is not unique to the Swedish market; in a 2019 survey on MiFID II the International Capital Market Association (ICMA) found that a number of challenges remained to be addressed, most notably a continued lack of post-trade transparency even two years after the implementation of the new rules. The report also points out that certain rules on the primary market have led to greater administrative burdens for companies without much benefit, in particular the allocation justification recording (where firms providing placing services to issuers need to keep an audit trail, a non‑public written record of the justification for each investor allocation made). Several respondents also indicated that it is difficult to identify whether a counterparty is a systematic internaliser (SI), an investment firm that on a frequent, systematic and substantial basis executes client orders on its own account, outside of trading venues, which is important to know since it has implications for the post-trade reporting requirements for OTC transactions. Finally, the ICMA report highlights the difficulty of accessing post-trade data published through Approved Publication Arrangements (APAs), and the fact that many respondent firms consider the vast majority of such data to be unusable due to low quality. However, it bears mentioning that while 60% of respondents in 2019 said price discovery had not improved following the implementation of MiFIR/D II, this was a decrease from 70% in 2018 and almost a third said it had improved somewhat. Further, the regulation has likely been a driver of the observed increase in electronic trade flows (ICMA, 2019[50]). It remains to be seen what the impact of the MiFIR review proposals will be.
In order to contextualise the transparency and disclosure framework in Sweden and the EU, Table 3.3 below provides a comparison between the reporting delays applied under the MiFIR/D II framework and those that apply in a selected number of peer countries, drawing from a comparative study conducted by IOSCO (2017[46]). The table shows how the rules apply depending on 1) the trading venue (exchange, non‑exchange trading venue or OTC) and 2) whether disclosure is pre‑ or post-trading. Rules for listed and unlisted bonds (in line with the definition given in Table 3.2) are shown separately. The symbols used are explained in the notes to the table.
It should be noted that while the table shows that the EU rules require near real-time transparency both pre‑ and post-trade, numerous waivers significantly affect how these rules work in practice, in particular in smaller markets where liquidity is low, as discussed in Section 2.8. As the table illustrates, many jurisdictions make data available for listed bonds in real-time to the public only against a fee, releasing it for free after a delay (often 15‑20 minutes). Self-regulatory organisations play an important role in several markets, notably in the United States (FINRA), Korea (KOIFA) and Canada (IIROC), as well as in Japan (JSDA, not shown below).
With respect to the primary market, an important part of the bond issuance process is the allocation of bonds. In order to find a consensus price, the lead manager(s) (the bank(s) mandated to manage the issuance process) will seek to gather a sufficiently large number of possible investors. Consequently, bond issues are often oversubscribed. In response to this, certain investors will inflate their orders to receive a larger share of bonds in the allocation process, to the detriment of investors that are constrained by internal rules forbidding them to place orders in excess of what they actually want to invest. The allocation is supposed to be carried out according to rules agreed with the issuer, and lead managers are to keep records of the process. However, the process tends to be less transparent for high-yield bonds (European Commission, 2017[51]). Under the European Union’s MiFIR/D II framework, firms providing placing services to issuers are obliged to keep an audit trail justifying each investor allocation.
Table 3.3. Regulatory reporting in selected jurisdictions
|
Listed bonds |
|||||||||||
|---|---|---|---|---|---|---|---|---|---|---|---|
|
Trading venue |
|||||||||||
|
Exchange |
Non-exchange trading venue |
OTC |
|||||||||
|
Pre‑trade: real time disclosure to… |
Post-trade: real-time disclosure to… |
Pre‑trade: real time disclosure to… |
Post-trade: real-time disclosure to… |
Dissemination |
|||||||
|
Exchange users |
Public |
Exchange users |
Public |
Exchange users |
Public |
Exchange users |
Public |
Pre‑trade |
Post-trade |
||
|
Australia |
✓ |
✓$ |
✓ |
✓$ (20 min) |
n/a* |
n/a* |
n/a* |
n/a* |
Operates under exchange markets, so real-time just like on exchange |
||
|
Canada |
✓ |
✓$ |
✓ |
✓$ |
✓ |
✓$ |
✓ |
✓$ |
n/a |
||
|
Korea |
✓ |
✓ |
✓ |
✓$ |
n/a |
n/a |
n/a |
n/a |
Self-regulatory organisation and information vendors |
||
|
Sweden/EU |
✓ |
✓ |
✓ |
✓ |
✓ |
✓ |
✓ |
✓ |
SIs must make public firm quotes, subject to conditions |
Through APAs for bonds admitted to trading |
|
|
Switzerland |
✓ |
✓$ (15 min) |
✓ |
✓$ (15 min) |
✘ |
✘ |
✘ (T+3) |
✘ (T+3) |
Exchange Market Data Systems, Market, Data Vendors, Internet |
||
|
United States |
✓ |
✓ |
✓ |
✓$ |
Depends** |
✘ |
15 min |
15 min |
TRACE system (FINRA) |
||
|
Unlisted bonds |
|||||||||||
|
Trading venue |
|||||||||||
|
Non-exchange trading venue OTC |
OTC |
||||||||||
|
Pre‑trade data available to … |
Post-trade data available to… |
Dissemination |
|||||||||
|
Exchange users |
Public |
Exchange users |
Public |
Pre‑trade |
Post-trade |
||||||
|
Australia |
n/a |
n/a |
n/a |
n/a |
n/a |
Summary information by trade association |
|||||
|
Canada |
✓*** |
✘ |
✓ |
✓ |
n/a |
T+2 by self-regulatory organisation |
|||||
|
Korea |
n/a |
n/a |
n/a |
n/a |
✓ |
Within 15 mins by self-regulatory association |
|||||
|
Sweden/EU |
✓ (Continuous basis) |
✓ (Continuous basis) |
✓ (Real-time/close to) |
✓ (Real-time/close to) |
SIs must make public firm quotes, subject to conditions |
Through APAs for bonds admitted to trading |
|||||
|
Switzerland |
n/a |
n/a |
n/a |
n/a |
n/a |
n/a |
|||||
|
United States |
TRACE system (FINRA) |
||||||||||
Note: For listed bonds, real-time data are often made available to the public against a fee. This is indicated by the ✓$ symbol. Cases where the information is available in real-time for a fee, but made publicly available for free after a certain time period are indicated by ✓$ (x min), where the brackets indicate the delay before information is made available for free. The table does not reflect the EU’s MiFIR review proposals.
* Australia has no alternative market license framework.
** Available in real time if the venue in question maintains an order book or displays quotations.
*** Displayed to users in real time if in an order book and otherwise displayed.
Source: IOSCO (2017[46]), Regulatory Reporting and Public Transparency in the Secondary Corporate Bond Markets, https://www.iosco.org/library/pubdocs/pdf/IOSCOPD578.pdf.
Notes
← 1. When including real estate companies in this analysis, that becomes the dominant sector in Sweden from 2011‑21, but the top issuer’s share in total issuance does not change in any significant way. The top industry does not change for any other country.
← 2. FINRA was previously known as the National Association of Securities Dealers (NASD).