Chapter 3 describes the methods used to analyse whether politically motivated violence is more pronounced in urban or rural areas, how the intensity of violence has shifted between cities and their hinterland over time, and how the use of violence varies geographically across North and West Africa. The spatial and temporal relationships between cities and violence are studied using population densities from WorldPop, a global gridded population dataset that has been used for longitudinal analysis since 2000. The report also classifies density data according to the recent “degree of urbanisation” definition adopted by the United Nations, which distinguishes between three categories of human settlements and facilitates cross-national comparisons. Population data are next combined with conflict data from the Armed Conflict and Location & Event Data (ACLED) project to classify violent events as urban, semi-urban or rural, and to calculate the distance from each violent event to the nearest urban area. The report also uses the Spatial Conflict Dynamics indicator (SCDi) developed by the Sahel and West Africa Club (SWAC/OECD) to identify major clusters of violence in the region. The results of the indicator are complemented by a qualitative analysis of ten case studies that have experienced high levels of violence in the past decade, in order to identify the local roots of urban and rural conflicts.
Urbanisation and Conflicts in North and West Africa

3. Mapping urban and rural violence in North and West Africa
Abstract
Key messages
This report combines population and conflict data to study the relationship between political violence and urban areas in North and West Africa since 2000.
The “degree of urbanisation” definition adopted by the United Nations is used to classify violent events as urban, semi-urban or rural.
The report applies the Spatial Conflict Dynamics indicator (SCDi) to identify major clusters of violent activities in the region.
A qualitative analysis of ten case studies particularly affected by political violence since 2010 addresses the local roots of urban and rural conflicts in the region.
How to assess the urbanity of violence
In North and West Africa, armed conflicts are rarely contained within the strict boundaries of a region or country. Instead, they tend to spread and relocate opportunistically, as violent actors clash over the control of strategic places, routes and local resources.1 Assessing these patterns of mobility is critical in evaluating how and where armed conflicts emerge, develop and eventually end in the region. This report sets out to explain this shifting geography of armed conflict by focusing on the urban dimension of violence in North and West Africa. It examines whether conflicts predominantly affect urban or rural areas, how the intensity of violence has changed between such regions, and which urban areas are the most violent (Table 3.1).
The goal of the first question is to examine whether violent events and fatalities observed in North and West Africa since 2000 tend to be primarily located in cities or in their rural hinterlands. In other words, is political violence more urban or rural? This is a crucial question, considering the rapid increase in the number of urban dwellers in the region in recent years. The report then examines whether political violence has become increasingly concentrated in urban areas in the past two decades. Are urban areas more violent than rural areas? The last question addresses the relationship between cities and insurgencies, reviewing the local factors that help explain why violence develops in urban or rural areas. Why are some urban areas more violent than others?
Table 3.1. Questions, approaches and tools to assessing urban violence
|
Questions |
Approaches |
Tools |
|---|---|---|
|
1. Are urban areas more violent than rural areas? |
Assess the relative number of violent events and fatalities according to their distance to urban areas |
Distance from each violent event to the nearest urban cell |
|
2. Has the intensity of violence in urban areas changed over time? |
Assess the changing proportion of violent events and fatalities according to their distance to urban areas |
Distance from each violent event to the nearest urban cell |
|
3. Are some urban areas more violent than others? |
Identify major hotspots of violence and contextualise the relationship between cities and conflict |
Spatial Conflict Dynamics indicator (SCDi) and qualitative analysis of a selection of urban areas |
The conceptual approaches and tools used to measure the intensity of violence in urban and rural areas, their temporal variations and their spatial characteristics build on previous work on the geography of violence in the region (OECD/SWAC, 2020[1]; Radil et al., 2022[2]; Walther et al., 2021[3]). To determine whether violence is more or less urban in general, the report assesses the relative number of violent events and fatalities based on their proximity to urban areas (question 1). If violence is predominantly an urban phenomenon, the highest concentration of violent activities will be found in or very near urban centres, and rapidly decay with distance from them.
A similar approach is used to determine whether violence is becoming more urban over time, using the changing proportion of violent events and fatalities in relation to their distance to urban areas (question 2). If violence is increasingly clustered in urban areas, the proportion of violent events and fatalities located in or near urban areas will have increased in recent years by comparison with previous periods. Finally, the report uses the Spatial Conflict Dynamics indicator to identify where the major hotspots of urban violence are located and offers a qualitative analysis of the local factors that could explain why violence develops in certain urban areas (question 3).
A regional and local approach to cities and conflicts
This report examines spatial trends in urban violence in 21 North and West African countries – Algeria, Benin, Burkina Faso, Cameroon, Chad, Côte d’Ivoire, Gambia, Ghana, Guinea, Guinea-Bissau, Liberia, Libya, Mali, Mauritania, Morocco, Niger, Nigeria, Senegal, Sierra Leone, Togo, and Tunisia (Map 3.1). This regional approach considers the northern and southern “shores” of the Sahara as two related battlefields for states and non-state organisations. It also captures two of the continent’s major spatial clusters of urban agglomerations: a North African cluster along the Mediterranean and Atlantic coasts and a West African cluster along the Gulf of Guinea (OECD/SWAC, 2020[1]).
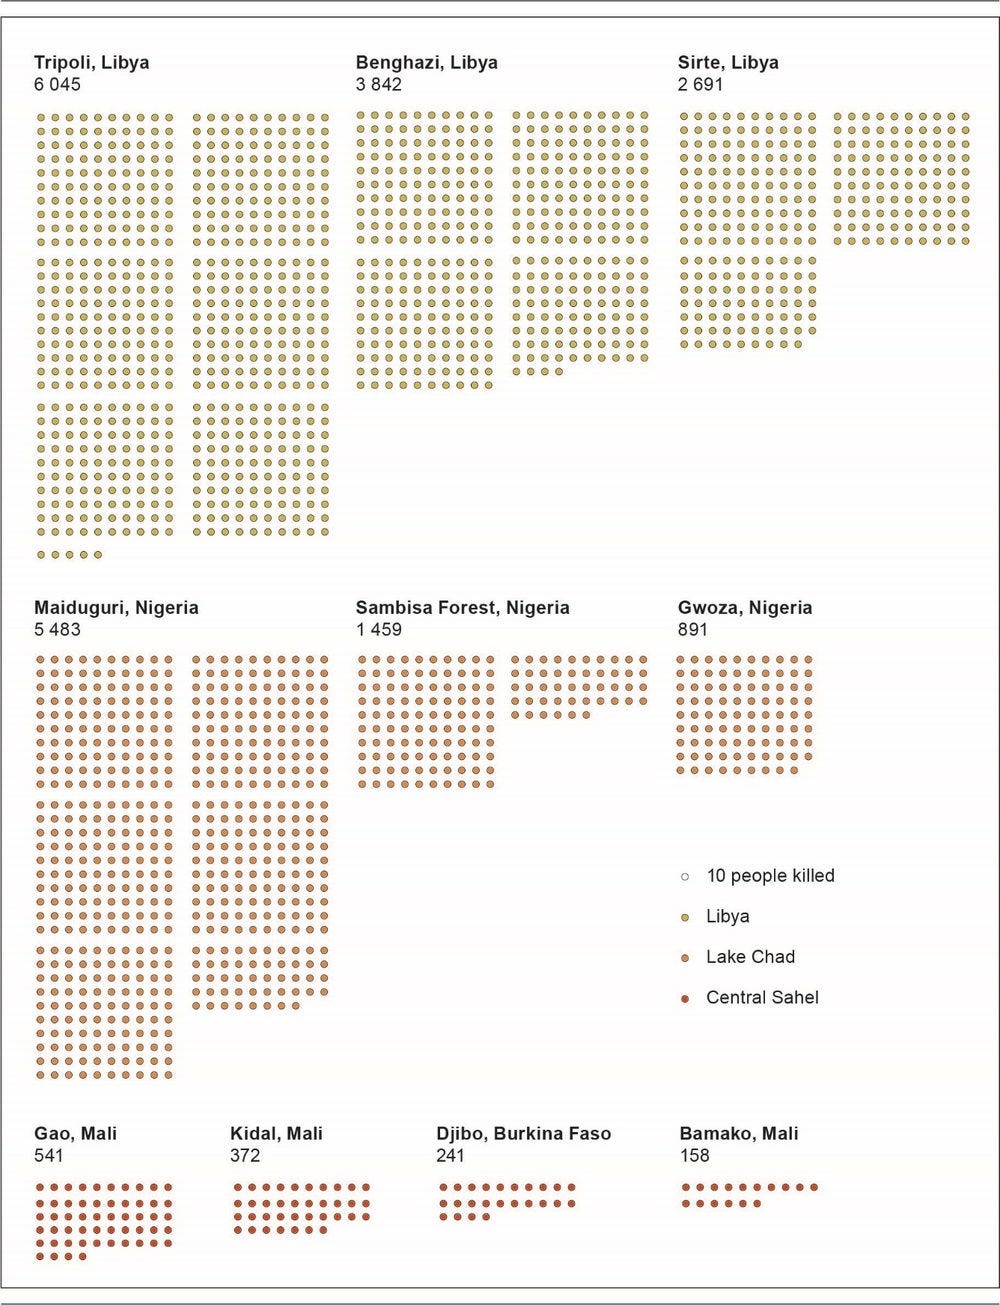
This regional approach is complemented by a qualitative analysis of ten case studies that have experienced a high number of fatalities in the Central Sahel, Lake Chad region and Libya, the three main epicentres of conflict in the past decade (Figure 3.1). In the Central Sahel, the report focuses on the cities of Djibo, Gao and Kidal, where victims of the persistent conflict between the government of Mali and Burkina Faso and violent extremist organisations are particularly numerous, and on Mali’s capital, Bamako. In the Lake Chad region, the report examines three places that have been particularly affected by the Boko Haram insurgency since 2009: the Nigerian cities of Gwoza and Maiduguri, and the Sambisa Forest, a rural region used by Boko Haram and, more recently, the Islamic State’s West Africa Province (ISWAP). In North Africa, the analysis focuses on Benghazi, Sirte and Tripoli, three major cities affected by the First and Second Libyan wars, which devastated the country in 2011 and 2014-20.
Map 3.1. Regions, countries and case studies
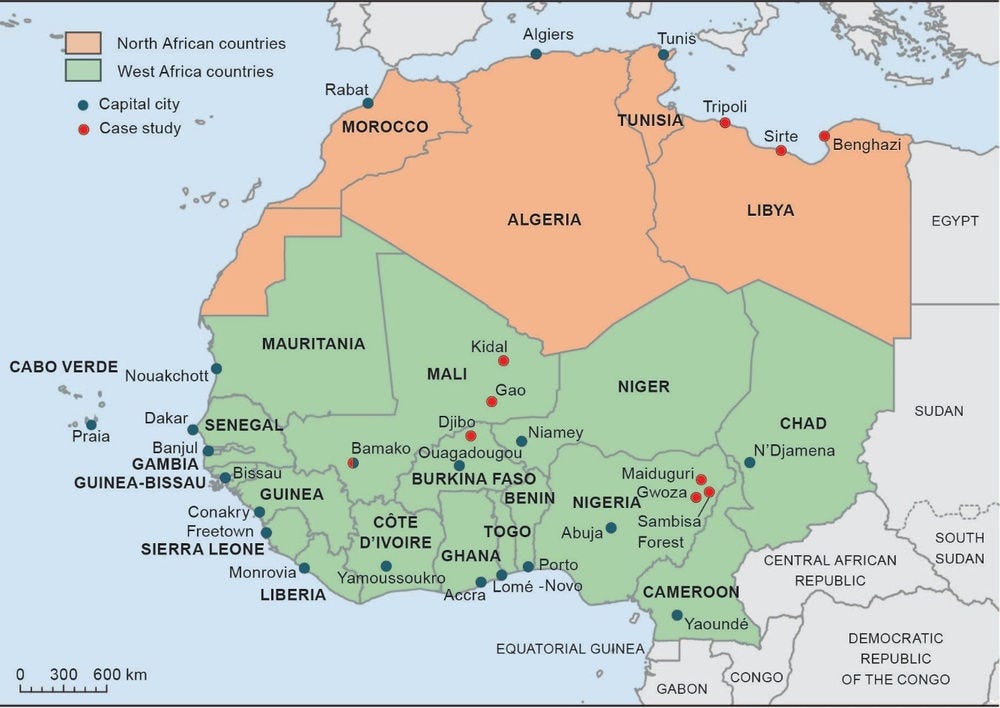
Figure 3.1. Number of fatalities by urban agglomeration, 1997-2021
Source: Authors based on ACLED (2022[4]) data. Data is available through 30 June 2022. ACLED data is publicly available.
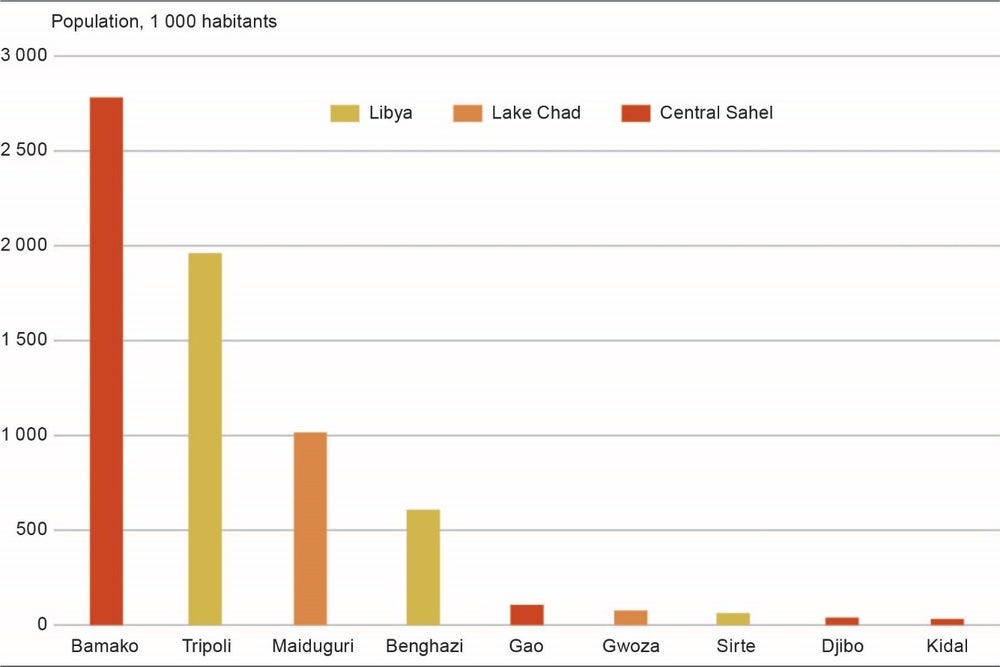
The demographic size of the urban agglomerations considered in this report ranges from 2.8 million people in Bamako to less than 35 000 people in Kidal (Figure 3.2). In general, the highest number of casualties occur in agglomerations that are strategically important in a conflict, rather than in the most populated places. For example, the town of Gwoza in Nigeria was the scene of fierce clashes between the government and Boko Haram that killed nearly 900 people in the mid-2010s, although it had fewer than 70 000 inhabitants. In the Sahara, too, cities are generally small, and their size only imperfectly reflects their military importance. For example, 372 casualties were recorded in Kidal, one of the most important political centres of north-eastern Mali. In Libya, the fighting in and around the town of Sirte, the birthplace of Muammar Kaddafi, owes less to its demographic weight (less than 60 000 inhabitants) than to its key role in the first civil war.
Figure 3.2. Population by urban agglomeration, 2015
Combining population and conflict data
To study how the demographic evolution of North and West Africa is related to political violence, the report uses WorldPop (WorldPop, 2022[6]), a global gridded population dataset that has been assessed as performing the best in spatial accuracy and estimated errors (Yin et al., 2021[7]). WorldPop is a residential dataset, which estimates where people reside, and calculates population density since 2000.
Most of the global population datasets transform national census information into gridded population estimates, yet each uses different data sources, settlement definitions and area or cell sizes. WorldPop is selected over alternative datasets such as Africapolis, LandScan or Global Human Settlement Layer (GHSL) because it has a high spatial resolution, is the most comprehensive for a cross-country and longitudinal analysis and is the most temporally current (see Box 3.1, Table 3.2).
Box 3.1. Comparing WorldPop, Africapolis, GHSL and LandScan
Produced by the OECD, Africapolis is based on a spatial approach and applies a physical criteria (a continuously built-up area) and a demographic criteria (more than 10 000 inhabitants) to define an urban agglomeration. An urban unit is defined by combining satellite and aerial imagery, official demographic data such as censuses and other cartographic sources. Population estimates in both North and West Africa are only available for 2015, which makes longitudinal analysis not possible (OECD/SWAC, 2016[8]; 2020[1]). The 2020 update should be available in 2023.
The GHSL combines population censuses with remotely sensed land-cover layers to calculate residential population density in 1 kilometre by 1 kilometre gridded cells (European Commission, 2022[9]). GHSL data use a threshold of 50 000 inhabitants to define urban centres, which is poorly adapted to the African continent, where 92% of all urban agglomerations included fewer than 100 000 inhabitants in 2015 (OECD/SWAC, 2020[1]). The temporal availability is also limited to four years (1975, 1990, 2000, 2015), which makes the longitudinal analysis less precise than WorldPop.
Like WorldPop, LandScan (Oak Ridge National Laboratory, 2022[10]) is a gridded population dataset in 1 km by 1 km cells. However, it is an ambient population estimate, calculating a 24-hour average of where people are located, depending on commuting patterns. Both datasets show similar trends for urbanisation across North and West Africa. However, LandScan’s ambient population approach has the unfortunate consequence of reducing “the number and size of cities, especially in low-income countries” (Dijkstra et al., 2021, p. 15[11]), an obstacle for the analysis of this report.
Table 3.2. Comparison of four population datasets for urban areas in Africa
|
Population dataset |
Data source |
Temporal |
Urban definition |
Grid cell size |
|---|---|---|---|---|
|
Africapolis |
Population censuses and spatial analysis (satellite) |
1950-2015 (population), 2015 (agglomeration perimeters) |
Minimum of 10 000 people in a built-up area with less than 200 metres between buildings. |
N/A |
|
Global Human Settlement Layer (GHSL) |
Grid cells and population censuses |
1975, 1990, 2000, 2015 |
1 500 inhabitants/km2 or 50% share of built-up on land and contiguous grid cells, with a minimum total population of more than 50 000 inhabitants |
1 km |
|
LandScan |
Spatial data, high-resolution imagery exploitation and multi-variable dasymetric modelling to disaggregate census counts |
2000-21 |
N/A (context-dependent) |
1 km |
|
WorldPop |
Land-cover-based methods alongside national censuses |
2000-20 |
Urban extent (Morphological Urban Area, MUA). |
1 km |
WorldPop is a gridded density dataset that divides North and West Africa into 1 km by 1 km cells and estimates how many people reside in each cell in each year. The dataset does not identify individual cities or urban areas, as for example Africapolis does. However, it offers the best mix of spatial resolution, longitudinal coverage and performance estimates.
To classify WorldPop density data in different demographic categories, the report adopts the recent “degree of urbanisation” definition established by the United Nations (UN) Statistical Commission (UN, 2020[12]; Dijkstra et al., 2021[11]). The UN definition is based on population density per square kilometre, which is also the size of the cells generated by WorldPop, obviating any additional geoprocessing that could introduce errors. Under the UN definition, cells of 1 500 or more people per square kilometre are classified as urban, those between 300 and 1 499 as semi-urban, and those below 300 as rural (Table 3.3). WorldPop’s estimate for 2020 is presented in Map 3.2, using the UN’s degree of urbanisation criteria, which indicates the spatial clusters of urban populations previously described.
Table 3.3. Population density and demographic categories
|
Population density per km2 |
Category |
|---|---|
|
≥ 1 500 |
Urban |
|
300-1 499 |
Semi-urban |
|
≤ 299 |
Rural |
Sources: (Dijkstra et al., 2021[11]), Applying the Degree of Urbanisation to the globe: A new harmonised definition reveals a different picture of global urbanisation; (UN, 2020[12]), Report of the Secretary-General on Implementation of the 2020 World Population and Housing Census Programme and the Methodology for Delineation of Urban and Rural Areas for International Statistical Comparison Purposes.
The geography of political violence is studied using the Armed Conflict Location & Event Data (ACLED) project, which provides disaggregated georeferenced information on violent events since 1997 (Raleigh et al., 2010). Building on previous work addressing the geography of conflict in North and West Africa by the OECD/SWAC (2020[13]; 2021[14]; 2022[15]), the study identifies eight categories of actors based on their communal, ethnic or political goals and structure and, where possible, on their “spatial dimension and relationships to communities” (ACLED, 2019, p. 19[16]), see Table 3.4. Actors can either be formal organisations involved in violent activities, informal groups of people or non-combatant categories. Formal organisations include “state forces”, defined as collective actors that exercise de facto state sovereignty over a given territory, such as military and police forces from the region. Another type of formal organisation is “rebel groups”, organisations whose political agenda is to overthrow or secede from a given state. Splinter groups or factions that emerge from a rebel group are recorded as distinct actors. Informal groups are defined based on their social, ethnic or regional attributes, such as “Fulani ethnic militias”.
ACLED distinguishes between two types of militias, those defined by identity and those that pursue political objectives. “Identity militias” are a heterogeneous group of militants structured around ethnicity, religion, region, community and livelihood. They are often named after the locality or region where they operate, like the Benue Communal Militia in Nigeria. “Political militias” are organisations whose goal is to influence and impact governance, security and policy in a given state through violent means, such as the Imghad Tuareg Self-Defense Group and Allies (GATIA) in Mali. Unlike rebel groups, political militias “are not seeking the removal of a national power, but are typically supported, armed by, or allied with a political elite and act towards a goal defined by these elites or larger political movements” (ACLED, 2019, p. 22[16]).
Map 3.2. Population density in North and West Africa, 2020
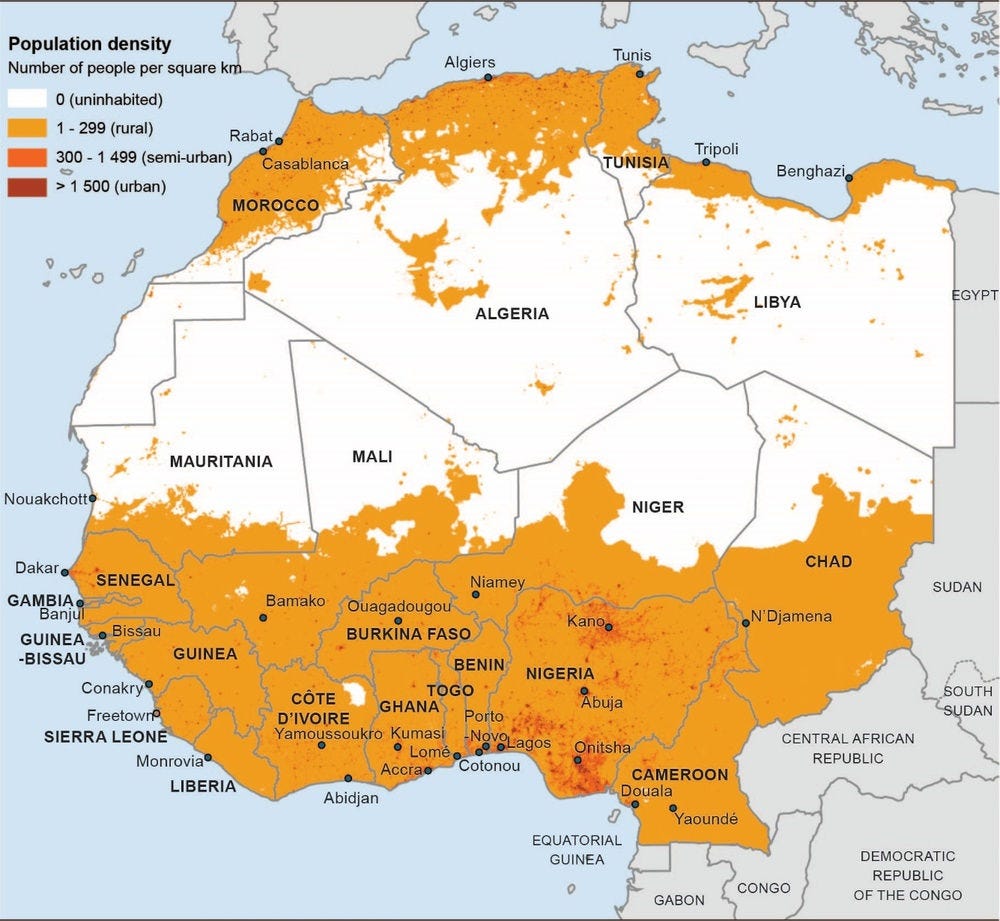
Note: According to the UN’s degree of urbanisation criteria, population densities of 1 500 per km2 or greater are considered urban.
Source: Authors based on WorldPop data.
Several categories of civilian actors are identified by ACLED. “Rioters” are unarmed individuals or groups engaged in disorganised violence against civilians, government forces or other armed groups during demonstrations, while “protesters” are unarmed demonstrators who engage in a public event without violence. Finally, “civilians” refer to the unarmed and unorganised victims of violent events identified by their country of origin. International organisations, foreign military forces, private security firms, and independent mercenaries engaged in violent events are coded as “external” and “other forces.” It is important to note that the ACLED database does not distinguish between the perpetrators and the victims of an attack, except for civilians who are, by definition, unarmed and cannot engage in political violence.
The analysis focuses on three types of event representative of armed conflict in the region: battles between armed groups and/or state forces, explosions and remote violence, and violence against unarmed civilians. Nonviolent actions such as strategic developments are not considered.
Battles are defined as “violent interactions between two politically organised armed groups at a particular time and location” (ACLED, 2019, p. 7[16]). Battles can occur between any state and non-state actors and involve at least two armed and organised actors. This category is subdivided into three sub-event types, depending on whether non-state actors or government forces overtake territory or whether there is no territorial change. Battles caused almost 100 000 fatalities in the region from January 1997 through June 2022, during just under 21 500 events. Nine out of ten of these fatalities were caused by armed clashes. Battles are the deadliest type of violent event, with 4.6 people killed per event, rising to 5.4 victims when non-state actors retake territory.
Explosions and remote violence correspond to “one-sided violent events in which the tool for engaging in conflict creates asymmetry by taking away the ability of the target to respond” (ACLED, 2019, p. 9[16]). These acts of violence can be carried out using bombs, grenades, improvised explosive devices (IEDs), artillery fire or shelling, missile attacks, heavy machine gun fire, air or drone strikes, or chemical weapons. Explosions and remote violence have killed more than 27 000 people since 1997 in more than 8 000 incidents. Explosions and remote violence cause 3.3 victims per event on average, and 9.6 victims per event for suicide bombings, the deadliest form of sub-event recorded in the database.
Violence against civilians includes “violent events where an organised armed group deliberately inflicts violence upon unarmed non-combatants. ... The perpetrators of such acts include state forces and their affiliates, rebels, militias, and external/other forces” (ACLED, 2019, p. 11[16]). Violence against civilians has accounted for 42% of the events and 35% of the fatalities recorded in North and West Africa since 1997. The vast majority of the 68 000 civilian deaths and more than 21 000 incidents observed in the region were caused by direct attacks. On average, 3.2 civilians are killed per violent event in the region (3.6 in North Africa and 3.2 in West Africa).
ACLED also tracks protests and riots, but these are highly urbanised and represent a fundamentally different political process from armed conflict. For this reason, protests or riots are not included in the main analysis of the report, despite their influence on the security situation of numerous cities in the region, as the case of Kaduna in northern Nigeria demonstrates (Box 3.2). The resulting data includes 50 822 violent events and 192 971 fatalities from 1 January 1997 to 30 June 2022 (Table 3.4). Because the WorldPop population data has only been available since 2000, the analysis of the relationship between cities and conflict is limited to the period between 1 January 2000 and 30 June 2022, in which 180 554 people were killed in 47 952 incidents.
Table 3.4. Actors involved in violence in North and West Africa by category, 1997-2022
|
Name |
Number |
Example |
|---|---|---|
|
State forces |
924 |
Military forces of Niger |
|
Rebels |
154 |
Ansar Dine |
|
Political militias |
558 |
Imghad Tuareg Self-Defense Group and Allies (GATIA) |
|
Identity militias |
1 972 |
Benue Communal Militia (Nigeria) |
|
Rioters and protesters |
11 |
Rioters (Senegal) |
|
Civilians |
1 044 |
Civilians (Cameroon) |
|
External forces |
143 |
United Nations Multidimensional Integrated Stabilization Mission in Mali (MINUSMA) |
|
Others and unknown |
13 |
Nigeria Petroleum Development Company |
|
Total |
4 453 |
|
Source: Authors based on ACLED (2022[4]) data. Data available through 30 June 2022. ACLED data is publicly available.
Box 3.2. Interreligious conflicts in Kaduna, Nigeria
The city of Kaduna in northern Nigeria has been repeatedly affected by interreligious conflicts caused by tensions over land, political office, the distribution of oil rents and the legacies of colonial policies that promoted differential treatment and unequal administration.
In Kaduna’s tense political context, interreligious clashes can flare easily. In 2000, the “sharia riots” were triggered by Christian protests over the introduction of a version of religious law in Kaduna State amid a wider campaign of “sharianization” in northern Nigerian states beginning in 1999. Muslim violence against Christian protesters touched off a cycle of violence and reprisals in the city and beyond. Two years later, the “Miss World riots” were caused by a Nigerian newspaper commenter’s joke about the Prophet Muhammad; Muslim demonstrators and provocateurs then reportedly attacked Christians in Kaduna, triggering reprisals.
These two incidents mark the most severe violence in Kaduna city during the 1997-2021 period, with 1 255 fatalities in 2000 and 250 in 2002 according to ACLED (2022[4]). The 2000 riots and the state of impunity that followed left enduring grievances in Kaduna on both sides of the Muslim-Christian divide. After Nigeria’s return to civilian rule in 1999, the initial expectation was that, as with Nigeria’s presidency, the Kaduna governorship would rotate between Muslims and Christians. If the governor hailed from one religious community, the deputy governor would be chosen from the other. Parts of this rotational agreement broke down in Kaduna, especially with Governor Nasir El-Rufai’s choice of a fellow Muslim as running mate for his 2019 re-election campaign. In 2011, the re-election of then-President Goodluck Jonathan, a southern Christian, triggered riots in northern cities, which sometimes included anti-Christian pogroms. Some of the worst violence, with an estimated 180 people killed, occurred in Kaduna city and in Zaria, another city in Kaduna state. In 2012, a Boko Haram bombing in Kaduna triggered reprisal attacks on Muslims by Christians, and then the reverse.
Source: Alexander Thurston for this publication.
Table 3.5. Number of violent events and fatalities in North and West Africa by type, 1997-2022
|
Event type |
Sub-event type |
Events |
Fatalities |
|---|---|---|---|
|
Battles |
|
21 374 |
97 492 |
|
|
Armed clash |
19 535 |
87 974 |
|
|
Government regains territory |
981 |
4 876 |
|
|
Non-state actor takes over territory |
858 |
4 642 |
|
Explosions/remote violence |
|
8 314 |
27 372 |
|
|
Air/drone strike |
3 031 |
11 600 |
|
|
Grenade |
70 |
70 |
|
|
Remote explosive/landmine/IED |
3 036 |
8 884 |
|
|
Shelling/artillery/missile attack |
1 655 |
1 782 |
|
|
Suicide bomb |
522 |
5 036 |
|
Violence against civilians |
|
21 134 |
68 107 |
|
|
Abduction/forced disappearance |
3 876 |
0 |
|
|
Attack |
17 007 |
67 146 |
|
|
Sexual violence |
251 |
961 |
|
Total |
|
50 822 |
192 971 |
Source: Authors based on ACLED (2022[4]) data. Data is available through 30 June 2022. ACLED data is publicly available.
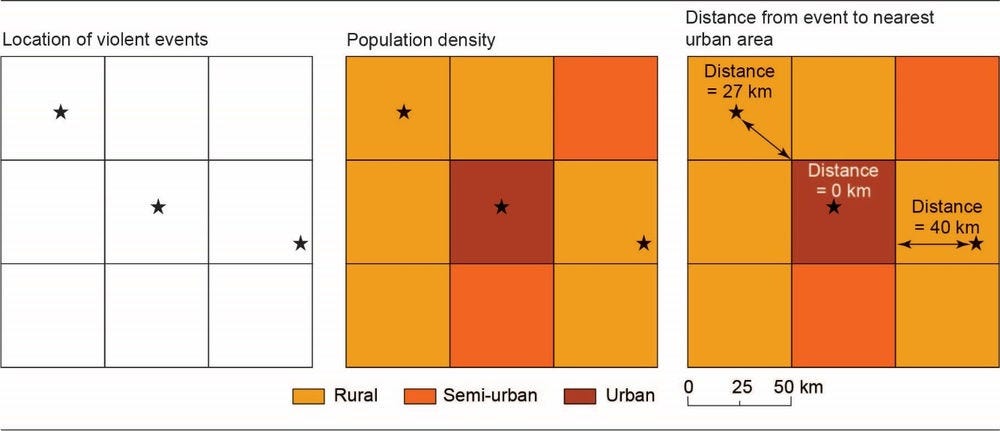
The relationship between population and conflict is analysed using a geographic information system to associate the locations of violence with an annual population density raster. Violence for each year is overlaid on that year’s corresponding WorldPop raster to capture the population density at every event location, in order to classify each event as urban, semi-urban, or rural, and to calculate the distance from each violent event to the nearest urban cell. Finally, the annual event data is used to calculate: (1) the density of the location where a violent event occurred, expressed as the number of people per square kilometre, (2) the classification of that event as urban, semi-urban or rural, and (3) the proximity of violent events to urban areas expressed in kilometres (Figure 3.3).
Figure 3.3. Measuring distances from violent events to urban areas
Mapping changing conflict dynamics
The report uses a geographic indicator called the Spatial Conflict Dynamic indicator (SCDi) that assesses the changing geography of violence, over space and through time (Walther et al., 2021[3]). The SCDi measures two connected but different spatial properties of violence: the intensity of conflict across a region, and the distribution of conflict locations relative to each other. The SCDi has been previously applied to all of North and West Africa (OECD/SWAC, 2020[13]; 2021[14]; 2022[15]) using a uniform grid of 50 by 50 kilometres to subdivide the study area. It has been calculated annually for each of these grid cells since 1997 and is made available to the public on the Mapping Territorial Transformations in Africa (MAPTA) platform run by the OECD Sahel and West Africa Club.2
Measuring the intensity of violence
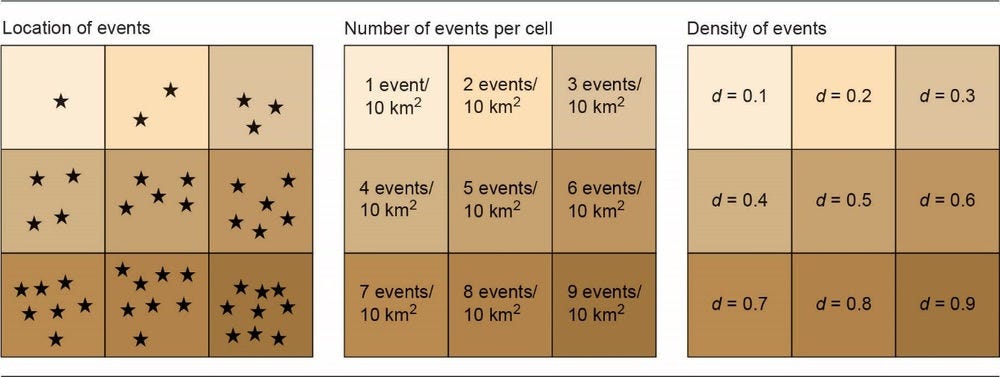
The first spatial property measured by the SCDi is conflict intensity (CI). The CI metric identifies the total number of events in a given zone, such as the 50 by 50 km grid described above, for a given duration of time, such as a year. This number of events is then divided by the area of the grid, to allow for comparisons between zones. The resulting CI metric has a lower threshold of 0 if there are no events within a given zone during a given year and no upper threshold. As the CI metric increases from 0, it reflects an increasing spatial intensity of violence within the footprint of a zone (Figure 3.4).
Using a 50 by 50 kilometre grid, most zones have a CI score of 0 in any given year, reflecting the absence of violent events. However, many zones are assigned a CI score greater than 0. In addition to calculating the raw CI score for each zone, the SCDi also classifies a zone as higher or lower than an expected CI value. The expected CI value for North and West Africa is called the CI “generational mean”, the 20-year average conflict intensity between 1997 and 2016. The CI generational mean is 0.0017 events per square kilometre, or four events for a 50 by 50 kilometre cell. In this report, then, a zone is classified as high intensity if four or more events occur in a grid within a given year, and as low intensity otherwise.
Figure 3.4. Density of violent events
Source: (OECD/SWAC, 2020[13]), The Geography of Conflict in North and West Africa, https://dx.doi.org/10.1787/02181039-en.
Figure 3.5 Identical density but different distribution of violent events
Source: (OECD/SWAC, 2020[13]), The Geography of Conflict in North and West Africa, https://dx.doi.org/10.1787/02181039-en.
Figure 3.6. Distribution of events as measured by the average nearest neighbour (ANN) ratio
Source: (OECD/SWAC, 2020[13]), The Geography of Conflict in North and West Africa, https://dx.doi.org/10.1787/02181039-en.
Measuring the concentration of violence
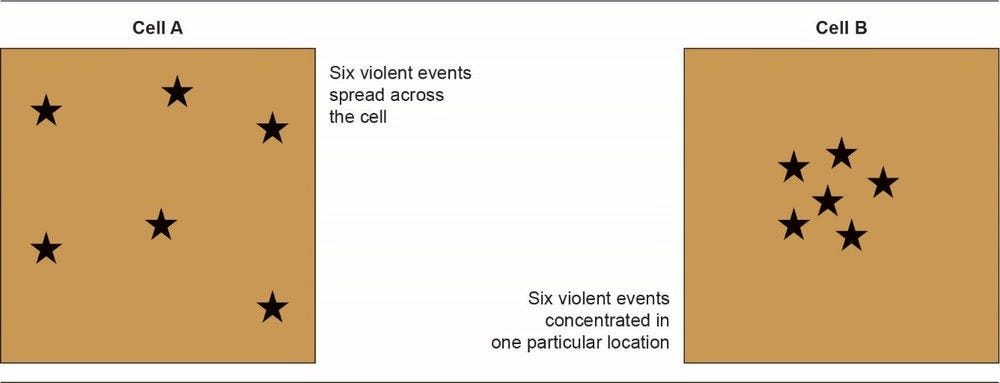
The second property measured by the SCDi is the distribution of conflict locations relative to each other within a given zone. This is called the conflict concentration (CC) metric. The CC metric divides the observed average distance between events in a given zone within a given year by the expected average distance if the events were randomly distributed throughout the zone. As presented in Figure 3.5, the patterning of events relative to each other is a different concern from conflict intensity: two zones may experience the same number of violent events but result in very different geographical patterns.
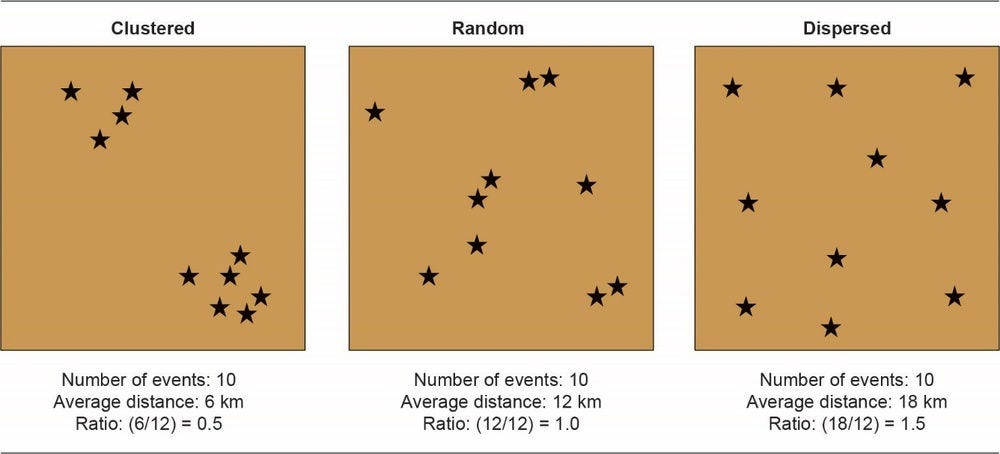
Like CI, the CC metric has a lower threshold of 0, with no conceptual upper threshold. A CC score of 0 would represent a series of events at the exact same location, an example of extreme geographic clustering of events. A CC score of 1 would represent a random pattern of event, or no detectible locational pattern. A CC score of more than 1 would represent dispersion of events from each other, farther apart than would be expected by chance. As shown in Figure 3.6, CC scores lower than 1 in a zone are classified as clustered and scores higher than 1 are classified as dispersed.
An average nearest neighbour (ANN) ratio is calculated to determine whether the patterns of violent events exhibit clustering or dispersion. The ANN ratio is calculated as the observed average distance among violent events in a given zone, divided by the expected average distance that would have been obtained if the events had been distributed randomly (ESRI, 2019[17]). ANN ratios smaller than 1 indicate clustering, while ratios greater than 1 indicate dispersion. For example, the distribution of events represented on the left-hand side of Figure 3.6 is clustered, compared with a random distribution of the same number of events, as shown by its ratio of 0.5, while the distribution on the right-hand side is dispersed, with a ratio of 1.5.
Types and conflict life cycles
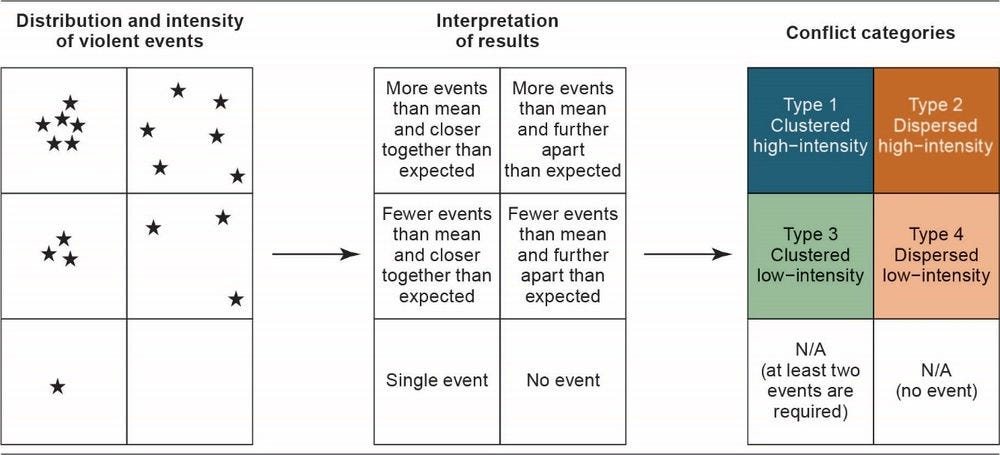
The SCDi combines intensity and spatial distribution to identify four different types of conflict based on whether violent events are dispersed or clustered, and are of high or low intensity (Figure 3.7).
The first type is typical of zones that have an above-average intensity and a clustered distribution of violent events, suggesting that violence is intensifying locally.
The second type are conflicts with a higher-than-average intensity and a dispersed distribution of events, indicating that the violence is accelerating.
The third type applies to zones where there are fewer violent activities and most of them take place near each other, possibly indicating a decreasing range of violent groups.
The fourth type, in which a lower-than-average intensity and a dispersed distribution of events are combined, suggests that a conflict is lingering. This situation may indicate that opponents are highly mobile or are unlikely to face protracted opposition in a given locality.
Figure 3.7. Using event distribution and intensity to identify conflict categories
These four types are indicative of potentially different stages in the overall lifecycle of a conflict (Walther et al., 2021[3]).
Although violence has been observed to both initiate and end from all of the SCDi typologies, the dispersed categories (Type 2 and 4) are most common either at the beginning or ending of a sequence of violence in a sub-zone. Further, dispersed conflicts are unlikely to persist compared with clustered conflicts and tend to dissipate quickly once they have emerged. This suggests that zones displaying these spatial typologies are either quite near the early stages of a conflict episode or the end. Finally, conflicts most commonly end by transitioning from clustered/low-intensity (Type 3) to no conflict in the following year (nearly 60% of observed cases). This suggests that violence is often concentrated even just before it ends.
Taken together, the four spatial categories reveal insights about the dynamics of the lifecycle of a typical conflict in North and West Africa. These are general trends, however, and not all sub-zones, places or localities will exhibit the same lifecycles between the SCDi categories. Nonetheless, a predominant pathway is suggested by the event data across the zones since the late 1990s (Walther et al., 2021[3]). Emerging conflicts tend to result in clustering of either type, dispersed conflicts tend to quickly change, clustered/high intensity are more persistent, and violence most commonly ends from the clustered/low-intensity forms.
References
[4] ACLED (2022), Armed Conflict Location & Event Data Project (database), https://acleddata.com.
[16] ACLED (2019), Armed Conflict Location and Event Dataset (ACLED) Codebook, https://acleddata.com.
[11] Dijkstra, L. et al. (2021), “Applying the Degree of Urbanisation to the globe: A new harmonised definition reveals a different picture of global urbanisation”, Journal of Urban Economics, Vol. 125/C, p. 103 312.
[17] ESRI (2019), How Average Nearest Neighbor Works, https://pro.arcgis.com/en/pro-app/tool-reference/spatialstatistics/h-how-average-nearest-neighbor-distance-spatial-st.htm.
[9] European Commission (2022), Global Human Settlement Layer (GHSL), https://ghsl.jrc.ec.europa.eu/.
[10] Oak Ridge National Laboratory (2022), LandScan (database), Oak Ridge, Tennessee, https://landscan.ornl.gov/about.
[15] OECD/SWAC (2022), Borders and Conflicts in North and West Africa, West African Studies, OECD Publishing, Paris, https://doi.org/10.1787/6da6d21e-en.
[14] OECD/SWAC (2021), Conflict Networks in North and West Africa, West African Studies, OECD Publishing, Paris, https://doi.org/10.1787/896e3eca-en.
[5] OECD/SWAC (2020), Africapolis (database), http://www.africapolis.org.
[1] OECD/SWAC (2020), Africa’s Urbanisation Dynamics 2020: Africapolis, Mapping a New Urban Geography, West African Studies, OECD Publishing, Paris, https://doi.org/10.1787/b6bccb81-en.
[13] OECD/SWAC (2020), The Geography of Conflict in North and West Africa, West African Studies, OECD Publishing, Paris, https://doi.org/10.1787/02181039-en.
[8] OECD/SWAC (2016), Urbanisation Dynamics in West Africa 1950–2010: Africapolis I, 2015 Update, West African Studies, OECD Publishing, Paris.
[18] OECD/UN ECA/AfDB (2022), Africa’s Urbanisation Dynamics 2022: The Economic Power of Africa’s Cities, West African Studies, OECD Publishing, Paris, https://doi.org/10.1787/3834ed5b-en.
[2] Radil, S. et al. (2022), “Urban-rural geographies of political violence in North and West Africa”, SSRN 4171240.
[19] Raleigh, C. et al. (2010), “Introducing ACLED: An Armed Conflict Location and Event Dataset”, Journal of Peace Research, Vol. 47/5, pp. 651–660, https://doi.org/10.1177/0022343310378914.
[12] UN (2020), Report of the Secretary-General on Implementation of the 2020 World Population and Housing Census Programme and the methodology for delineation of urban and rural areas for international statistical comparison purposes: Report of the Secretary-General, United Nations Statistical Commission, United Nations, New York, https://digitallibrary.un.org/record/3847372.
[3] Walther, O. et al. (2021), “Introducing the Spatial Conflict Dynamics indicator of political violence”, Terrorism and Political Violence, pp. 1-20, https://doi.org/10.1080/09546553.2021.1957846.
[6] WorldPop (2022), WorldPop (database), University of Southampton, https://www.worldpop.org.
[7] Yin, X. et al. (2021), “Which gridded population data product is better? Evidences from mainland Southeast Asia (MSEA)”, International Journal of Geo-Information, Vol. 10/10, 681, pp. 1-15.
Notes
← 2. Available at https://mapping-africa-transformations.org.
