Plastic leakage to the environment causes wide-ranging impacts on the environment and human health, and is a key concern for policy makers. With plastics use and waste projected to triple by 2060, this chapter explores the projected trends for leakage to the terrestrial and aquatic environments in the Baseline scenario, which assumes no new policy measures are taken. The chapter also quantifies projected trends in airborne microplastics pollution from tyre and brake wear.
Global Plastics Outlook
5. Projections of plastic leakage to the environment to 2060
Abstract
Key messages
The leakage of plastics into terrestrial and aquatic environments is substantial and increasing. In 2019, 22 million tonnes (Mt) of plastics leaked into the environment globally; the Baseline scenario projects this to double to 44 Mt by 2060. This projection is highly uncertain, with low and high estimates ranging from 34 to 55 Mt.
The share of leaked plastics from OECD countries halves to 6% by 2060, with projections suggesting that the share of OECD countries in macroplastic leakage will reduce from 11% in 2019 to 2% by 2060. However, their contribution to microplastic leakage remains high, despite falling from 35% in 2019 to 28% in 2060. In non-OECD countries, the combination of population and economic growth and less developed waste management systems are projected to drive substantial growth in the leakage of both macro- and microplastics, especially in Asia and Africa.
Mismanaged waste (waste not disposed of adequately) is by far the largest source of leaked macroplastics, accounting for 86% of all plastic leakage in 2019. Though it will remain the main source of leakage to 2060, leakage from marine activities and of microplastics are projected to grow quickly in the coming decades, highlighting the need to also address the sources of these flows.
The flow of plastics leaking from mismanaged waste into aquatic environments (streams, rivers, lakes and the ocean) is projected to increase by 91% to 2060, reaching 11.6 Mt per year in 2060 from 6.1 Mt per year in 2019. Other sources of leakage, including marine activities and microplastics, more than double. Although the upward trend is clear, there is substantial uncertainty around the magnitude of the leakage, which could range between 6.2 Mt and 16.8 Mt.
These continuous inflows of plastic waste drive up the accumulated stocks of plastics in aquatic environments to a staggering 493 Mt by 2060, more than three times from 2019 levels. As macroplastics break down into microplastics in the environment very slowly, the annual amount of microplastics generated by this degradation is limited to less than 1 Mt in 2060. However, the process will continue beyond 2060, implying a permanent inflow of microplastics into the seas and the ocean.
By 2060, 145 Mt of plastics will have accumulated in the ocean. The ocean is projected to receive an annual inflow of 4 Mt of mismanaged waste plastics from rivers and coastlines by 2060, more than double the inflows of 1.7 Mt in 2019. Ambitious policies with global reach will be needed to reduce the additional leakage to the ocean to zero as put forward by the G20 in the Osaka Blue Ocean Vision, and ultimately end plastic pollution, as articulated in the UNEA Resolution 5/14.
5.1. Plastic leakage the environment presents a wide range of environmental and human health hazards
Plastic leakage – i.e. the flows of plastics into the environment – and the accumulation of plastics in the environment are problems of increasing concern for ecosystems and human health. The presence of plastics has now been documented in all the major ocean basins, on beaches, in rivers and lakes, as well as in terrestrial and aerial environments (OECD, 2021[1]). Even pristine environments such as the Arctic and remote mountain areas have been found to be contaminated with plastics (Obbard et al., 2014[2]; Allen et al., 2019[3]).
The majority of plastic materials that enter the environment will persist for a long time. Large items (usually referred to as macroplastics), such as bottles or fishing nets (OECD, 2021[4]), can also slowly degrade and fragment into microplastics – i.e. particles, fragments or fibres smaller than 5 mm in diameter1 – and potentially into nanoplastics,2 amplifying the likelihood of exposure and risks for ecosystem and human health (Andrady, 2011[5]). Removing plastics from the environment may be difficult and costly (see Section 8.4.2 in Chapter 8), if not virtually impossible in certain cases (e.g. microplastics or debris in the deep ocean and sediments).
The impacts of marine plastic pollution on wildlife have been widely reported. Plastics harm many species (e.g. mussels, turtles, fish, sea birds, marine mammals) via ingestion or entanglement. Entangled organisms may be hindered in their ability to feed, breathe, move, and avoid predators, while ingestion of plastics can lead to suffocation, intestinal blockages, or starvation. At least 550 wildlife species are known to be affected by either entanglement in or ingestion of plastic debris, with negative implications for biodiversity, ecosystem health and the sustainability of fisheries (Kühn, Bravo Rebolledo and van Franeker, 2015[6]).
Owing to their small size, microplastics are particularly likely to be ingested by aquatic species, either directly or by feeding on contaminated species. Microplastics have been found in the digestive tracts of several marine and freshwater species (OECD, 2021[1]). Particle ingestion may result in physical injuries inducing inflammation and stress, obstruct feeding organs and reduce the feeding activity and efficiency (SAPEA, 2019[7]). Laboratory experiments have shown that exposure to microplastics may result in reduced feeding efficiency, starvation, reduced growth rates, physical deterioration, and increased mortality rates (Wright, Thompson and Galloway, 2013[8]). Humans may also be exposed to microplastics, for instance by consuming contaminated food and drinks or by inhalation.
There are also concerns that plastic materials may play a role in exposing wildlife and humans to suspected hazardous chemicals. The possible health effects of exposure to hazardous chemicals include carcinogenicity, reproductive health effects, developmental toxicity, and mutagenicity (causing genetic mutations). Certain additives used during production, such as Bisphenol A, polychlorinated biphenyls (PCBs), phthalates, and some brominated flame retardants are suspected endocrine disruptors, i.e. chemicals with thyroid-disrupting effects (WHO, 2019[9]). Plastics may also act as a sink and transportation media for chemicals and persistent organic pollutants (POPs) that accumulate on their surface while in the water. Generally, the exposure of organisms to these chemicals may vary widely, depending on concentrations of pollutants and local circumstances (GESAMP, 2015[10]).
Assessing the risks from plastic leakage for ecosystems and human health requires a better understanding of the current and projected levels of leakage. To date, estimates of the amounts of plastics that leak into the environment and spread to land, water and air have been based on substantial assumptions due to a lack of knowledge about elements that affect leakage, such as the mobility of leaked plastics, weather patterns and the rate of degradation. To improve the knowledge base, four research groups were mobilised as part of the OECD’s plastics work (see Box 5.1).
Box 5.1. How is plastic leakage quantified in the Global Plastics Outlook?
The OECD ENV-Linkages model is used in the analysis to create economic projections (Chapter 2) and link them to plastics use (Chapter 3) and waste, including a distinction between different waste management categories (Chapter 4). This information on economic growth, plastics use and waste from ENV-Linkages is then used as input for external models that calculate the leakage to the environment. The estimates of plastic leakage presented in this report combine the work of four research groups, each looking at complementary aspects:
experts from the Technical University of Denmark (DTU), who led the research underlying the Ryberg et al. (2019[11]) study, quantified plastic leakage to the environment;
experts from the University of Leeds, who contributed to Lau et al. (2020[12]), quantified macroplastic leakage to terrestrial and aquatic environments;
Laurent Lebreton, who contributed to the leakage estimations in Borrelle et al. (2020[13]), quantified plastic leakage to and mobility of plastics in aquatic environments;
Nikolaos Evangeliou from the Norwegian Institute for Air Research (NILU), who developed the Evangeliou et al. (2020[14]) study, quantified microplastics from brake and tyre wear that leak directly to the atmosphere.
In this Outlook, as well as in the previous Global Plastics Outlook: Economic Drivers, Environmental Impacts and Policy Options (2022[15]), the estimates for plastic leakage to the environment are produced by combining the estimates from DTU and Leeds University and providing a range (low, central and high estimates). DTU provides estimates for macroplastic leakage coming from mismanaged waste (municipal solid waste or MSW, non-MSW and litter) and marine activities, as well as microplastics. Leeds University provides estimates for leakage from mismanaged waste only. For mismanaged waste (representing the bulk of the leakage), the central estimates are calculated as the average of the two estimates provided by DTU and Leeds University. High and low then correspond to the higher and lower values between the values produced by DTU and Leeds University. For the leakage of marine activities and microplastics, the values of DTU are used as central estimates.
Aquatic leakage is quantified based on the central projection. In Section 5.3 on aquatic leakage, to account for uncertainties in estimating emissions at regional level, confidence intervals are given with low and high emission probability ranges derived from the midpoint emission estimate and respectively subtracting and adding the standard deviations of lower and higher country-scale emission probabilities as provided by Borrelle et al. (2020[13]) and weighted by country population size.
Annex A describes the approach used to estimate current leakage, which is also presented in the OECD Global Plastics Outlook: Economic Drivers, Environmental Impacts and Policy Options (2022[15]), and to provide projections for the future.
Although the combination of approaches draws on state-of-the-art expertise on this topic, the results should be interpreted with care as there is still significant uncertainty surrounding certain parameters used in the modelling.
5.2. Plastic leakage to the environment is projected to double by 2060
The global annual plastics leaked to the environment is projected to double, from 22 million tonnes (Mt) in 2019 to 44 Mt in 2060 (Figure 5.1) in the Baseline scenario. In this scenario, continued socio-economic developments and economic growth, including recovery from the COVID-19 pandemic (Chapter 2), lead to rapidly rising plastics use (Chapter 3) and plastic waste (Chapter 4). An important trend is that emerging and developing economies catch up with higher income countries.
The lack of robust knowledge surrounding certain critical factors, such as the share of mismanaged waste that is lost to the environment, means these estimates have wide uncertainty ranges depending on the assumptions employed, with the high estimate being almost 55 Mt and the low estimate 34 Mt in 2060 (16 Mt – 28 Mt in 2060). Despite the uncertainty, the projections show that in the Baseline scenario, plastic leakage will increase over time and add to the plastic stocks already accumulated in the environment. The rest of this section focuses on the central estimates in Figure 5.1.
Figure 5.1. All estimates agree that global plastic leakage is growing, though magnitudes vary
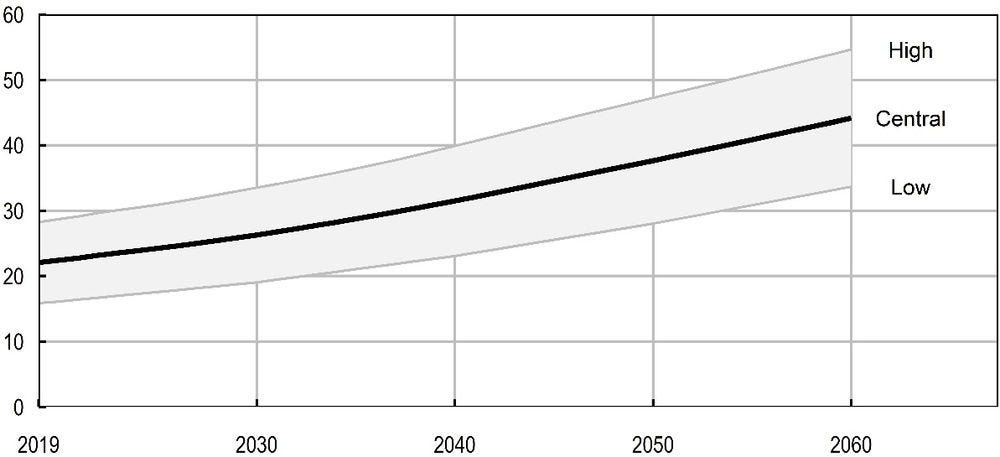
Source: OECD ENV-Linkages model, based on Ryberg et al. (2019[11]) (high estimate) and Cottom et al. (2022[16]) (low estimate).
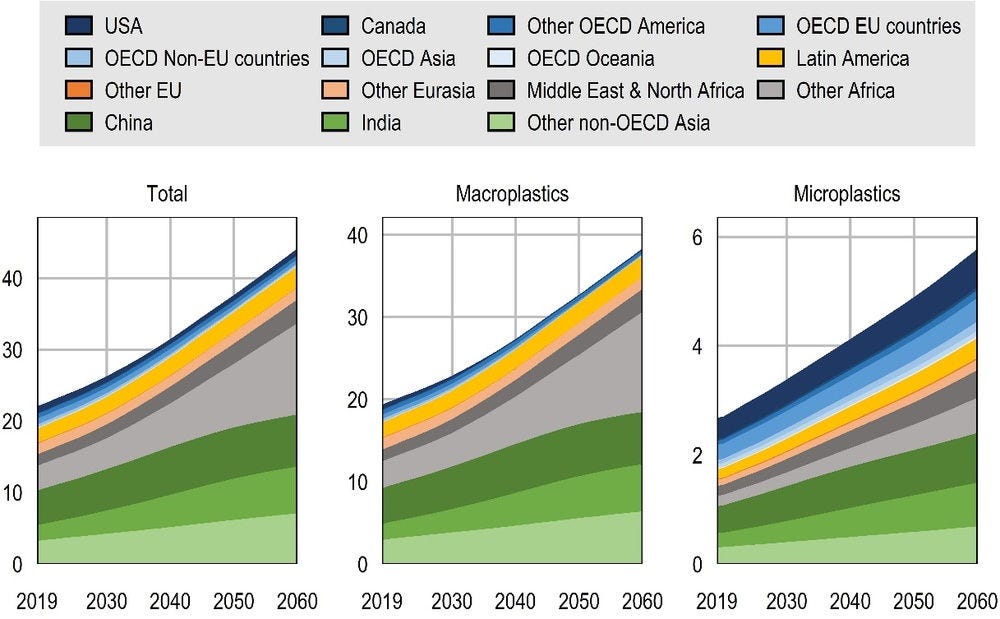
Leakage of both macroplastics and microplastics is projected to double between 2019 and 2060 (Figure 5.2). The annual leakage of macroplastics increases from 19.4 Mt in 2019 to 38.4 Mt in 2060, while the leakage of microplastics doubles, to reach 5.8 Mt in 2060.
Not all regions will see the same rates of increase. The global increase in plastic leakage is largely driven by non-OECD countries, following the increase in mismanaged waste discussed in Chapter 4. While OECD countries see a fall in annual plastic leakage, from 3.2 Mt in 2019 to 2.5 Mt in 2060, plastic leakage more than doubles in non-OECD countries, from 18.9 Mt to 41.6 Mt (Figure 5.2). The region with the highest increase in leakage is Sub-Saharan Africa (Other Africa), where waste management systems do not evolve quickly enough to match the socio-economic changes that drive plastics use and waste. Leakage also increases substantially in Asia, where the largest increase in the region is in India and Other non-OECD Asia.3
While the share of OECD countries in overall macroplastic leakage decreases, from 11% in 2019 to 2% in 2060, they continue to contribute a high share of leaked microplastics (28% in 2060, compared to 35% in 2019). Leakage of microplastics increases substantially both in OECD and non-OECD countries, suggesting that microplastic leakage is an increasingly important issue for the whole world.
Figure 5.2. Leaked macro- and microplastics will double, with regional differences
Source: OECD ENV-Linkages model, based on Ryberg et al. (2019[11]) and Cottom et al. (2022[16]).
Mismanaged waste is by far the main source of macroplastic leakage to the environment (OECD, 2022[15]), making up 99% of leaked macroplastics by 2060 (Figure 5.3), and mainly originating in non-OECD countries (Chapter 4). The annual leakage from mismanaged waste excluding litter in non-OECD countries doubles to 35.4 Mt in 2060, compared to 0.1 Mt in 2060 in OECD countries. Littering is the fastest growing source of macroplastic leakage and reaches an annual amount of over 2.3 Mt globally in 2060. Leakage from marine activities (mostly fishing nets, but also dolly ropes4) – the only source of macroplastic leakage included in the scope that does not originate from mismanaged waste – more than doubles globally to reach 0.6 Mt in 2060, 17% of which originates from OECD countries.
While macroplastic leakage to the environment can be reduced by focusing on mismanaged waste, the leakage of microplastics is a more pervasive and complex problem and it is increasing in all regions. The largest assessed sources of leaked microplastics in 2060 are wastewater sludge5 (30%), tyre abrasion (24%), and microplastic dust6 (19%):
Leakage of microplastics from waste water sludge is projected to more than double in OECD countries, from 0.4 Mt in 2019 to 0.9 Mt in 2060. However, it will quintuple in non-OECD countries, following the development of waste water treatment plants (WWTPs) in many countries, and it is projected to reach 0.8 Mt in 2060. Thus, while OECD countries represent 72% of the global leakage for this category in 2019, their share is projected to decrease to about half in 2060. While an increase in WWTPs will prevent the direct leakage of microplastics into rivers, the resulting sludge – containing microplastics and other chemicals – needs to be dealt with.7
Microplastic leakage from tyre and brake abrasion is projected to double globally, following a projected increase in road transport. In many non-OECD countries, this growth is stronger as economic development drives an increasing demand for transport (Chapter 3). In addition to leaking microplastics to terrestrial and aquatic environments, tyre and brake abrasion also emits microplastics to the air (see Section below).
Microplastic dust is projected to increase globally from 0.8 Mt a year in 2019 to 1.1 Mt in 2060. Over 90% of the leakage in this category (1 Mt) is projected to occur in non-OECD countries.
Figure 5.3. Plastic leakage comes from a wide range of sources

Note: The numbers on the right of each graph show the increase between 2019 and 2060. WW = waste water
Source: OECD ENV-Linkages model, based on Ryberg et al. (2019[11]) and Cottom et al. (2022[16]).
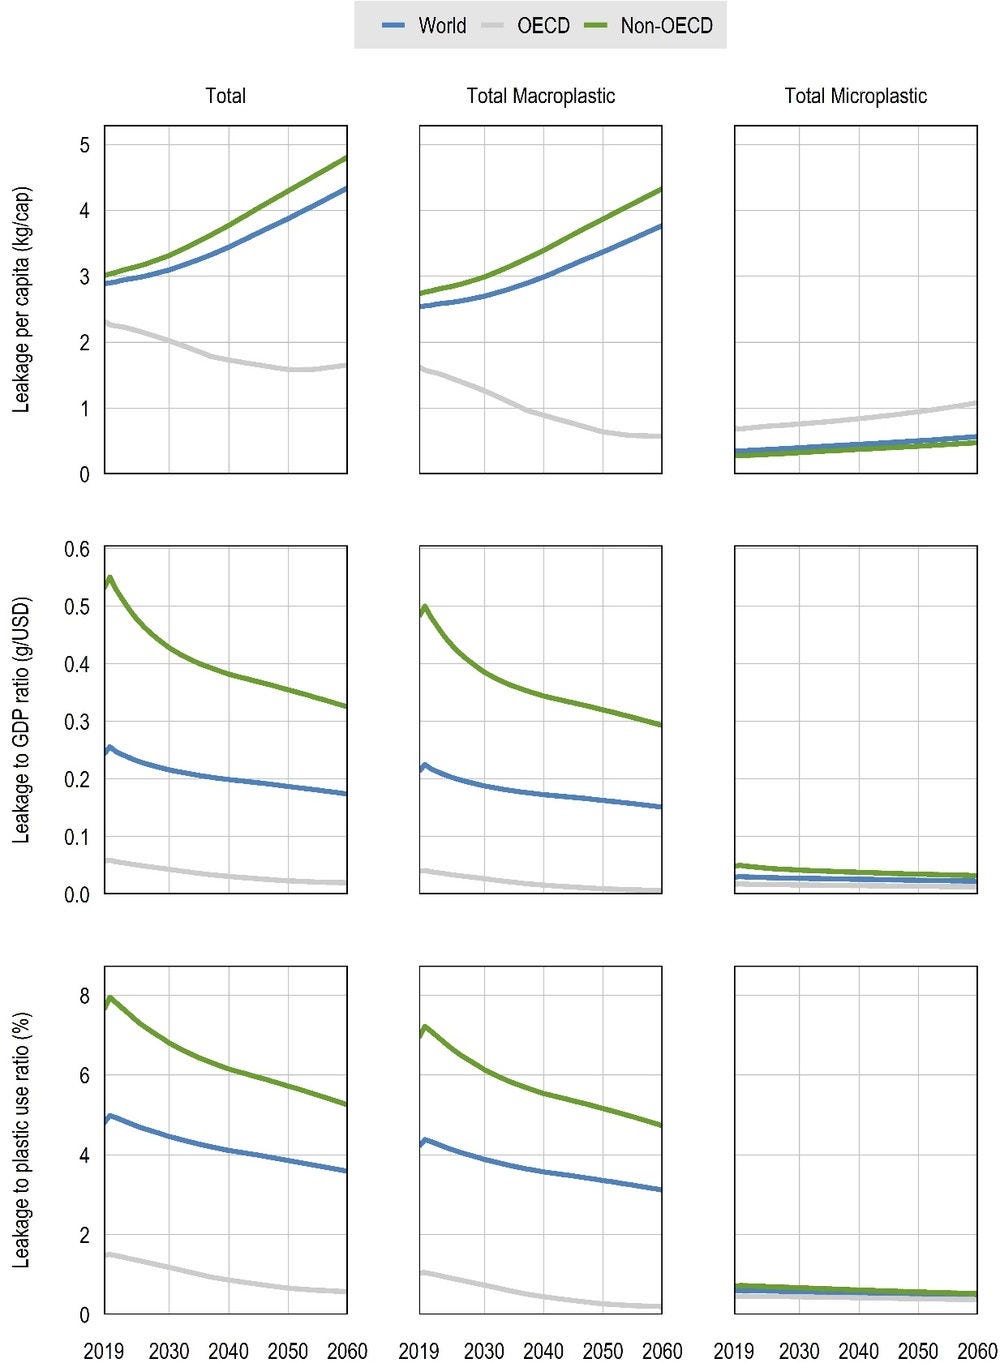
The changes in macro- and microplastics over time are strongly linked to socio-economic developments. As income and plastics use increase, plastic leakage per person increases steadily at the global level, from 2.9 kg/cap in 2019 to 4.3 kg/capita in 2060 (Figure 5.4). This is largely accounted for by growth in non-OECD countries, where plastic leakage per capita increases from 3 kg/cap in 2019 to 4.8 kg/cap in 2060. The profile of OECD countries is different: plastic leakage per capita initially decreases, from 2.3 kg/cap in 2019 to 1.6 kg/cap in 2050, before increasing again to reach 1.7 kg/cap in 2060. The decrease to 2050 stems from the sharp fall in macroplastic leakage following a near phasing out of mismanaged waste (while microplastic leakage keeps increasing). However, after 2050, the growth in macroplastic littering and microplastic leakage, driven by the effect of population growth and economic growth on plastics use, implies that total leakage stabilises and even increases slightly again to 2060. This evolution highlights that policy measures that aim at curbing plastic leakage to the environment need to go beyond waste management and also take into account the quantities of plastics produced and discarded.
As economies develop and improve their waste management systems, the ratio between plastic leakage and GDP decreases from 0.24 g/USD (grams per USD) in 2019 to 0.17 g/USD in 2060. Although the ratio is expected to decrease in all regions, in the absence of additional policy intervention non-OECD countries will not catch up with OECD countries as macroplastic leakage from mismanaged waste remains a major source of leakage in non-OECD countries. The OECD average more than halves, from 0.06 g/USD in 2019 to 0.02 g/USD in 2060, while the non-OECD average halves from 0.53 g/USD to 0.33 g/USD mainly driven by changes in macroplastic leakage. Microplastic leakage per dollar of output decreases slightly following the close link between microplastic leakage and plastics use, and the slowly decreasing plastics intensity of the economy (see Section 3.2.3 in Chapter 3).
As waste management systems improve, plastic leakage decouples from plastics use, as indicated by the leakage-to-plastics use ratio (Figure 5.4). Globally, the ratio decreases from 4.8% in 2019 to 3.6% in 2060. This ratio decreases in both OECD and non-OECD countries, despite a disparity in levels. The OECD ratio is projected to decrease the most, from 1.5% to 0.6%, with a near absence of mismanaged waste by the end of the projection horizon. In contrast, in non-OECD countries the ratio decreases, but from 7.6% to 5.3%. This underlines the importance of improving waste management practices all over the world and especially in low and middle-income countries.
Overall, the projections show that the dynamics of macro- and microplastic leakage change as economies develop and improve their waste management systems. Macroplastic leakage follows an “Environmental Kuznets Curve” (Grossman and Krueger, 1995[17]) (Figure 5.5, top panel): leakage initially rises but then starts falling at higher income levels. The growth in plastics use and waste generation initially dominates and causes leakage to grow. However, as countries develop further, there is greater demand for better waste management systems and more willingness to deal with visible environmental impacts, such as macroplastic leakage. Thus, they invest in better waste management infrastructure, leading to lower rates of mismanaged waste and therefore declining macroplastic leakage. Microplastic leakage is projected to increase with GDP per capita, regardless of the level or region (Figure 5.5, bottom panel), although some saturation occurs at higher levels of income. Microplastics are not as visible as macroplastics, and therefore initiatives to curb leakage are less likely to be promoted.
Figure 5.4. While plastic leakage per capita increases, leakage rates will decouple from GDP and plastics use levels
Source: OECD ENV-Linkages model, based on Ryberg et al. (2019[11]) and Cottom et al. (2022[16]).
Figure 5.5. Macroplastic and microplastic leakage show different trajectories when income per capita increases

Note: The data points for each colour represent the evolution of that region between 2019 and 2060, with the arrow pointing towards 2060.
Source: OECD ENV-Linkages model, based on Ryberg et al. (2019[11]) and Cottom et al. (2022[16]).
5.3. Plastic leakage into aquatic environments is projected to almost double by 2060
While some leaked plastics will remain on land (terrestrial leakage), others will reach aquatic environments: streams, rivers, lakes, seas and the ocean. As outlined in detail in Section 2.5.1 of the Global Plastics Outlook: Economic Drivers, Environmental Impacts and Policy Options (2022[15]), plastic aquatic environments is influenced by spatial elements, such as proximity of rivers and coasts, weather patterns and plastics’ characteristics (weight, flexibility). Some polymers and plastic products are more easily transported, and thus have a higher risk of ending up in an aquatic environment. Also, local elements such as the presence of dams affect the transport of plastics in rivers and the inflow into the ocean. This section focuses on the behaviour of macroplastics, starting from the leakage estimates for mismanaged and littered waste discussed in the previous section. Considering the multitude of elements to be taken into account and the uncertainty around these aspects, these estimations are only indicative and need to be interpreted with care.
Annual global plastic leakage into aquatic environments is projected to almost double, from 6.1 Mt in 2019 to 11.6 Mt in 2060 (“Central estimate” in Figure 5.6). The wide range, with a low estimate of 6.2 Mt and a high estimate of 16.8 Mt, emphasises the substantial uncertainty given the lack of empirical data. To further underline the uncertainty, the dots in Figure 5.6 represent estimates provided by Leeds University to check and corroborate the OECD methodology (Box 5.1) and leakage to water results. The numbers from Leeds University are lower than the OECD central estimate but fall within the uncertainty range at the lower end, starting from 4.1 Mt in 2019 to 8 Mt in 2060. Regardless of the size of the estimate, however, the trend indicates that the increasing use of plastics, only partly abated by the slow improvement of global waste management, will steadily drive up the annual amounts of plastics leaked to aquatic environments.
Figure 5.6. Global leakage to aquatic environments could at least double by 2060
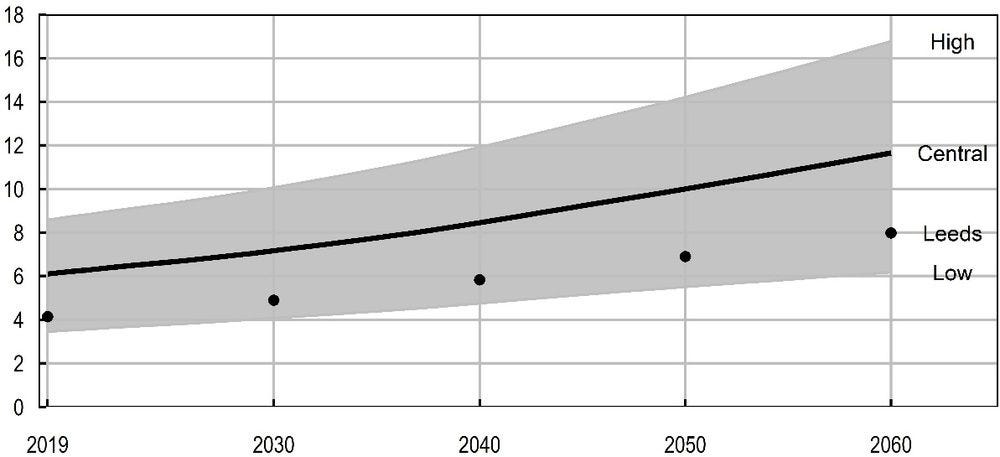
Note: High and low correspond to low and high emission probability ranges (see Box 5.1). The dots correspond to Leeds University estimates.
Source: OECD ENV-Linkages model, based on Lebreton and Andrady (2019[18]), Lebreton, Egger and Slat (2019[19]) and Cottom et al (2022[16]).
A few previous studies have also made projections about plastic leakage to water. Lau et al. (2020[12]) estimated that a business-as-usual scenario without any policy intervention after 2020 would lead to approximately 29 Mt of aquatic leakage annually in 2040. Borrelle et al. (2020[13]) estimated that, without any structural change or additional ambitious policies, between 20 and 90 Mt would enter aquatic environments by 2030. Although comparing these estimates with the OECD central estimate presented in Figure 5.6 is difficult due to different definitions, assumptions and methodologies, the OECD estimates of annual leakage to aquatic environments seem significantly lower.
A first reason for this difference is that ENV-Linkages estimates lower amounts of mismanaged waste (see Box 4.5 in Chapter 4). Lau et al. (2020[12]) estimate mismanaged waste in 2040 to be more than double the amount projected by ENV-Linkages for that same year (Table 4.3 in Chapter 4). This difference directly relates to the more detailed modelling of the evolution of waste management in ENV-Linkages (see Chapter 4). Less mismanaged waste means less leaked plastics. Secondly, ENV-Linkages builds on an in-depth analysis of the fate of mismanaged waste (OECD, 2022[15]) that splits the mismanaged waste into four categories: waste deposited in dumpsites, open burning, leakage to terrestrial environments and leakage to aquatic environments. The analysis suggests that only around 8% of mismanaged waste ultimately ends up in aquatic environments, which is lower than the 12% share assumed by Lau et al. (2020[12]). Thirdly, to estimate the leakage to water, ENV-Linkages focused on macroplastics owing to the importance of this category for leakage and the availability of exploratory models and data. Microplastics are not included in the scope, but are an emerging concern for which more research on risks and potential policy measures is needed. Clearly, adding microplastic leakage to the estimates for leakage to water would increase the amounts. Thus, the estimates put forward in this chapter are likely to be conservative.
Ultimately, the estimation of plastic leakage is secondary to the intrinsic message from all these studies: plastic leakage is a major environmental problem and is getting worse over time. The urgency with which policy makers and other societal decision makers must act is high.
Thanks to improvements in waste management, plastic leakage to aquatic environments is projected to decrease over time until 2060 in OECD countries (Figure 5.7).8 However, in absence of additional policies, aquatic leakage increases substantially in non-OECD countries. Plastic leakage to aquatic environments predominantly comes from non-OECD regions (Figure 5.7). The biggest contributors in 2019 were Asian countries, with the People’s Republic of China (hereafter ‘China’) emitting 1.3 Mt, followed by other emerging economies in Asia (Other non-OECD Asia) at 1 Mt. These countries are projected to be the second-largest contributor by 2060, with 2.4 Mt emissions per year while India and China follow, with a projected 2 and 1.7 Mt per year by 2060 respectively. Sub-Saharan African countries (Other Africa) were responsible for almost 0.8 Mt in 2019, but by 2060 are projected to top the chart, at 2.9 Mt per year. The rapid increase in plastic leakage from the African continent reflects population growth and economic development, combined with immature waste management systems.
Figure 5.7. By 2060 non-OECD countries will be the main source of plastic leakage into aquatic environments
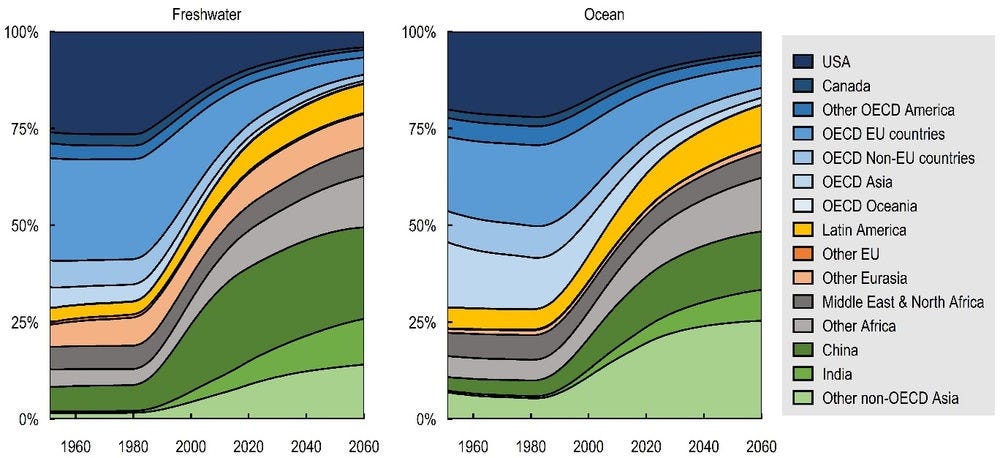
Projections for the coming decades suggest a clear geographical shift in the main regional sources of plastics in freshwater and marine environments (Figure 5.8). Advanced economies such as the United States and OECD Europe were primarily responsible for leaked plastics until the 1990s. Since 2000 the contribution of Asian and African countries has increased strongly, driven by growing plastic demand in developing economies. By 2060, over 66% of plastics accumulated in aquatic environments are projected to have come from four regions: Sub-Saharan Africa (Other Africa), as well as China, India and other developing Asian countries. By 2060, China is projected to be the biggest emitter of plastics to freshwater environments, while other emerging economies in Asia (Other non-OECD Asia) are the primary source of plastic leakage to marine environments. This difference can be explained by the greater probability of leaked plastics reaching the ocean from island nations, where populations are mostly coastal and the monsoon season implies a greater risk of direct emissions to the ocean.
Figure 5.8. Regional contributions to plastics leaking into aquatic environments shift over time
Once plastics reach an aquatic environment, their fates depend on their characteristics and on the environment itself. Only 5% of plastics leaking to aquatic environments arrive directly in the ocean from the coast (Figure 5.9). Most plastics leak into freshwaters, i.e. rivers and lakes. When plastics are denser than water, they tend to sink rapidly to the bottom (representing 50% of the total plastic leaked to aquatic environments). The remainder floats (either because they are less dense than water or their shape traps air) and can potentially be transported downstream (44% of the total plastic leaked to aquatic environments). For instance, applications like packaging, which use high amounts of light-weight polymers (e.g. PE and PP) and heavier polymers (e.g. PET) in less dense plastic products (like plastic bottles), are much more likely to contribute to the “plastic soup” in the ocean. Each of these flows into aquatic environments is projected to increase substantially by 2060.
Figure 5.9. Only a small share of leaked plastics reaches the ocean via the coast
Plastics have been accumulating in the aquatic environment since the onset of plastic mass production in the 1950s. By 2019, an estimated total of 140 Mt of plastics had found their way into the aquatic environment globally (Figure 5.10). Of this, only 22% had reached the ocean due to the large share of plastics that sinks to river or lake beds and the slow transport of floating plastics downstream. A much larger share (78%) was still in freshwater systems.9 With the Baseline scenario projecting a near doubling of plastic inputs to aquatic environments globally from 2019 to 2060, the outlook is bleak for these environments: a staggering 493 Mt of plastics will have accumulated by 2060, 29% of which will have reached the ocean.
Figure 5.10. There are more leaked plastics stored in freshwater systems than in the ocean
The slow rate at which plastics move through rivers means that accumulated plastics in rivers keep on flowing towards the ocean decades after they enter an aquatic environment. Moreover, part of the stock is slowly broken down to microplastics, which are more likely to be ingested by aquatic species, thus increasing the related environmental risks. Figure 5.11 shows some of the dynamics occurring in aquatic environments. The estimated total annual inflows of macroplastics into the ocean were 1.7 Mt in 2019; by 2060 they are projected to be 4.0 Mt. Degradation of macroplastics to microplastics is a slow process, estimated at 0.3 Mt annually in 2019, rising to 0.8 Mt in 2060, with most degradation occurring in the large, accumulated stocks in rivers. However, these dynamics are strongly influenced by local conditions such as weather patterns, river morphology and biological degradation processes. However, limited current understanding of these influences and capabilities makes it challenging to model the overall picture, so the errors in each of these numbers could be substantial. Nonetheless, it is clear that additional policies are needed to achieve the target of net-zero leakage to the ocean from the G20 as put forward by the Osaka Blue Ocean Vision, and to ultimately end plastic pollution, as articulated in the UNEA Resolution 5/14.
Figure 5.11. The flow of macroplastics into rivers and lakes is substantially larger than outflows to the ocean
5.4. The projected increase in transport will lead to more airborne microplastics
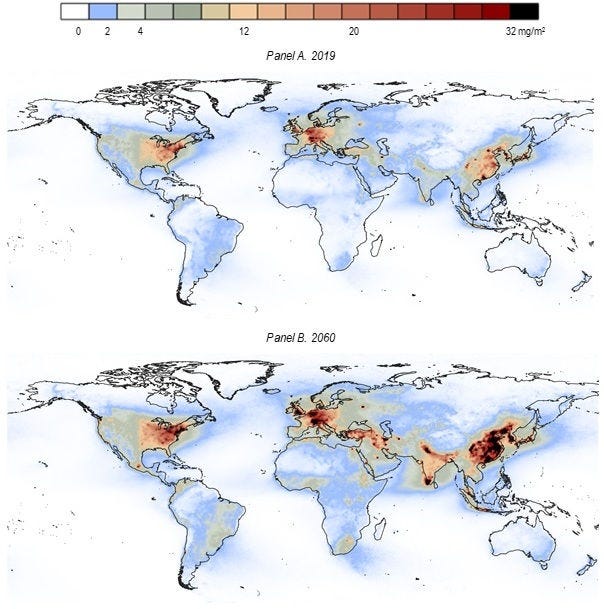
Some microplastics become airborne and can be transported long distances before being deposited on the land or in aquatic environments. Road transport, and in particular the wear of tyres and brake pads, is one of the main sources of aerial microplastic pollution, in the form of particulate matter (PM) (OECD, 2022[15]). Airborne emissions from road transport are mostly due to the abrasion of tyres, with emissions from tyres 16 times larger than emissions from brakes in 2019. However, brake abrasion is responsible for a larger share of fine particulate matter (PM2.5, i.e. particles with a diameter below 2.5 micrometres), which may have more severe health impacts (Evangeliou et al., 2020[14]). Road transport-related microplastics are emitted mainly in large urban agglomerations, such as the eastern part of North America, continental Europe and Northeast Asia.
The majority of airborne microplastic emissions tends to remain close to their source, where they increase the concentration levels of PM at ground level. This is the case for highly populated and industrialised areas in North America, Europe and East Asia. However, some particles can travel long distances and end up far beyond these source areas, depending on the location and atmospheric conditions. Microplastics can even reach fragile environments such as the Arctic (Figure 5.12), highlighting the global scale of the plastic challenge.
The increase in road transport projected to 2060 will lead to further growth in airborne microplastics, their deposition in the environment and impacts on air quality. In North America and Europe the depositions of microplastics are projected to steadily increase by 2060, while in China, depositions are projected to more than double, and in other emerging economies such as India, they are projected to nearly quadruple.
Figure 5.12. Deposition of airborne microplastics from tyre and brake abrasion will increase
References
[3] Allen, S. et al. (2019), “Atmospheric transport and deposition of microplastics in a remote mountain catchment”, Nature Geoscience, Vol. 12/5, pp. 339-344, https://doi.org/10.1038/s41561-019-0335-5.
[5] Andrady, A. (2011), “Microplastics in the marine environment”, Marine Pollution Bulletin, Vol. 62/8, pp. 1596-1605, https://doi.org/10.1016/j.marpolbul.2011.05.030.
[13] Borrelle, S. et al. (2020), “Predicted growth in plastic waste exceeds efforts to mitigate plastic pollution”, Science, Vol. 369/6510, pp. 1515-1518, https://doi.org/10.1126/science.aba3656.
[16] Cottom, J. et al. (2022), “Spatio-temporal quantification of plastic pollution origins and transportation (SPOT)” University of Leeds, UK, https://plasticpollution.leeds.ac.uk/toolkits/spot/.
[14] Evangeliou, N. et al. (2020), “Atmospheric transport is a major pathway of microplastics to remote regions”, Nature Communications, Vol. 11/1, https://doi.org/10.1038/s41467-020-17201-9.
[10] GESAMP (2015), Sources, fate and effects of microplastics in the marine environment: a global assessment, IMO/FAO/UNESCO-IOC/UNIDO/WMO/IAEA/UN/UNEP/UNDP Joint Group of Experts on the Scientific Aspects of Marine Environmental Protection), http://www.imo.org.
[17] Grossman, G. and A. Krueger (1995), “Economic Growth and the Environment”, The Quarterly Journal of Economics, Vol. 110/2, pp. 353-377, https://doi.org/10.2307/2118443.
[6] Kühn, S., E. Bravo Rebolledo and J. van Franeker (2015), “Deleterious Effects of Litter on Marine Life”, in Marine Anthropogenic Litter, Springer International Publishing, Cham, https://doi.org/10.1007/978-3-319-16510-3_4.
[12] Lau, W. et al. (2020), “Evaluating scenarios toward zero plastic pollution”, Science, p. eaba9475, https://doi.org/10.1126/science.aba9475.
[18] Lebreton, L. and A. Andrady (2019), “Future scenarios of global plastic waste generation and disposal”, Palgrave Communications, Vol. 5/1, p. 6, https://doi.org/10.1057/s41599-018-0212-7.
[19] Lebreton, L., M. Egger and B. Slat (2019), “A global mass budget for positively buoyant macroplastic debris in the ocean”, Scientific Reports, Vol. 9/1, p. 12922, https://doi.org/10.1038/s41598-019-49413-5.
[2] Obbard, R. et al. (2014), “Global warming releases microplastic legacy frozen in Arctic Sea ice”, Earth’s Future, Vol. 2/6, pp. 315-320, https://doi.org/10.1002/2014EF000240.
[15] OECD (2022), Global Plastics Outlook: Economic Drivers, Environmental Impacts and Policy Options, OECD Publishing, Paris, https://doi.org/10.1787/de747aef-en.
[1] OECD (2021), Policies to Reduce Microplastics Pollution in Water: Focus on Textiles and Tyres, OECD Publishing, Paris, https://doi.org/10.1787/7ec7e5ef-en.
[4] OECD (2021), “Towards G7 action to combat ghost fishing gear: A background report prepared for the 2021 G7 Presidency of the United Kingdom”, OECD Environment Policy Papers, No. 25, OECD Publishing, Paris, https://doi.org/10.1787/a4c86e42-en.
[11] Ryberg, M. et al. (2019), “Global environmental losses of plastics across their value chains”, Resources, Conservation and Recycling, Vol. 151, p. 104459, https://doi.org/10.1016/j.resconrec.2019.104459.
[7] SAPEA (2019), A scientific perspective on micro-plastics in nature and society, https://doi.org/10.26356/microplastics.
[9] WHO (2019), Microplastics in drinking water.
[8] Wright, S., R. Thompson and T. Galloway (2013), “The physical impacts of microplastics on marine organisms: A review”, Environmental Pollution, Vol. 178, pp. 483-492, https://doi.org/10.1016/j.envpol.2013.02.031.
Notes
← 1. Microplastics are sometimes split further into three categories: 1) primary microplastics, i.e. plastics that are by design smaller than 5 mm in diameter; 2) secondary microplastics generated from abrasion during the use of synthetic products, such as tyre wear particles; and 3) secondary microplastics that are formed by the fragmentation of macroplastics that have already leaked into the environment.
← 2. Nanoplastics are plastics with a size below 1 or 100 nanometre, depending on the definition used (OECD, 2021[1]).
← 3. See Table A A.2 in Annex A for a list of the regions used in ENV-Linkages.
← 4. Black, orange or blue polyethylene strings used in bottom trawling, a method of fishing that involves dragging heavy weighted nets across the sea floor.
← 5. Of the microplastics removed in wastewater treatment plants, a share may be reintroduced to the environment via the spreading of sewage sludge on agricultural fields. The relative importance of this pathway varies across countries, depending on the effectiveness of the wastewater treatment process at retaining microplastics and on the type of sludge disposal method. The remainder of the microplastics are disposed via incineration or landfilling, from which no losses to the environment are reported. Further details on the assumptions made on the fate of microplastics in wastewater are given in Annex B.
← 6. Microplastic dust refers to the unintentional and uncontrolled releases of microplastics throughout the lifespan of various products through abrasion, either by weathering or direct human activities. In this model, we accounted for five such sources: household textile dust, interior paints, exterior paints, exterior construction and demolition, and shoe sole abrasion. This is not an exhaustive list, but represent those microplastics dust sources for which there is sufficient literature.
← 7. Microplastics which end up in sewage waste water come from a variety of sources: tyre abrasion (24% of the total mass), microplastics dust (21%), artificial turf (20%), pellets from plastics production (16%), road markings (10%), and textile microfibres (5%).
← 8. Canada has made preliminary estimates for plastics production, waste and leakage available on request in November 2021. The information is available on https://www150.statcan.gc.ca/n1/daily-quotidien/211109/dq211109e-eng.htm. Though the results differ from the results from the OECD ENV-Linkages model for Canada, the differences are small overall, taking into account uncertainties for several key parameters.
← 9. Though it is important to note that as the model did not account for any removal mechanisms, a share of this accumulated waste could have in fact been recovered by now.

