Achieving the global ambition to reduce plastic leakage to zero requires a wide-ranging set of policies that tackles all drivers, including plastics use, waste management and leakage pathways. This chapter explores the Global Ambition policy scenario, in which a policy package is implemented to reduce plastic leakage to the environment to near zero by 2060. The package includes the same instruments as in the Regional Action policy scenario, but with more ambitious targets, and is implemented rapidly and globally.
Global Plastics Outlook
8. The Global Ambition policy scenario
Abstract
Key messages
Global implementation of ambitious circular policies to curb plastic leakage can reduce mismanaged plastic waste to almost zero by 2060 at an annual cost of less than 1% of global GDP. Early action in all countries is essential to achieve this.
Overall implementation costs of this Global Ambition policy package will be higher in non-OECD countries than in OECD countries. This demands supportive policies to bridge any financing gap.
Despite this ambitious circular plastics policy package, the use of plastics globally will still grow beyond 2019 levels, (827 Mt vs 460 Mt), as will plastic waste (679 Mt vs 353 Mt). However, this growth is much lower than in the Baseline scenario, making the proper treatment of all plastic waste more manageable. Furthermore, almost all the increase in demand for plastics can be met by recycled secondary plastics, which grow to 41% of total plastics production.
Such an ambitious policy package entails significantly improved treatment of plastic waste to boost recycling (to around 60% of all waste) and avoid mismanaged waste. The global decline in mismanaged waste is mostly driven by improvements in non-OECD countries, which accounted for almost 90% of global mismanaged waste in 2019. This share will increase even further by 2060 unless these ambitious global policies are implemented.
In this Global Action scenario, plastic leakage to the environment is projected to decrease to near zero levels by 2060, with annual leakage of plastics into the aquatic environment falling by 98% compared to the Baseline in 2060. However, in the interim stocks of plastics will continue to accumulate in the aquatic environment, reaching 300 Mt in 2060, which is slightly more than double the 2019 level.
Additional measures to clean up the remaining plastic leakage to the marine environment could remove all new marine plastics pollution; while the costs of this clean up are likely to be high, they are roughly three times smaller than the costs linked to the economic and environmental damage caused by plastic pollution. Waste treatment costs per tonne of plastics are substantially lower than for cleaning up, making prevention the most rational option.
8.1. The policy package in the Global Ambition scenario assumes immediate global action
Reducing plastic pollution, including avoiding leakage of plastics to the environment, requires shared objectives and co-ordinated efforts at the international level. As discussed in OECD (2022[1]), many policy measures and voluntary initiatives have emerged in recent years across countries as a response to an increasing awareness of the negative environmental impacts of the plastics lifecycle. However, these efforts are poorly co-ordinated and are unable to significantly alter trends in plastics production, waste generation and leakage (OECD, 2022[1]). The recent resolution adopted by the United Nations Environment Assembly (UNEA-5) is therefore an historical step. Entitled “End plastic pollution: Towards an international legally binding instrument”, it requests that an intergovernmental negotiation committee be convened to develop an international legally binding instrument to tackle plastic pollution, including in the marine environment. This ambitious resolution has been widely welcomed by OECD members and selected partner countries (OECD, 2022[2]).
Several international initiatives and commitments helped to pave the way for the UNEA 5.2 resolution. For example, the Osaka Blue Ocean Vision (OBOV), shared by G20 leaders at the 2019 Osaka Summit, aims to “reduce additional pollution by marine plastic litter to zero by 2050 through a comprehensive lifecycle approach” (Ministry of Foreign Affairs, Japan, 2019[3]). This includes reducing the discharge of mismanaged plastic litter by improving waste management and adopting innovative solutions, while still recognising the important role of plastics for society. In 2021, the G20 Heads of State reaffirmed their commitment to address marine plastic litter by strengthening existing instruments and developing a new global agreement or instrument (G20 Leaders, 2021[4]). Furthermore, the Sustainable Development Goals provide an important anchor for international policy action to delink economic growth and environmental degradation. Common targets and roadmaps for action on plastics have also been set at the regional level, such as in the South-East Asia region and in various regional seas conventions (ASEAN, 2021[5]; AOSIS, 2021[6]; COBSEA, 2019[7]; HELCOM, 2015[8]). As part of the European Green Deal, the European Union (EU) has set a 2030 target to reduce plastic litter at sea by 50%, and microplastic releases into the environment by 30% (European Commission, 2019[9]).
The Global Ambition scenario has similar ambitions – eliminating leakage of plastics to the environment as much as possible – but achieving the targets of all these initiatives and commitments is not guaranteed.1 While the Regional Action scenario (Chapter 7) embodies a set of policies that build on current efforts and commitments and that take countries’ different situations into account, the Global Ambition scenario is more ambitious, adopting a truly global approach to tackling the problem. While using the same policy toolkit, it is more stringent than the Regional Action scenario, assumes more rapid action and pursues similar levels of ambition for OECD and non-OECD countries alike.
The various policy instruments and their implementation in the model are grouped into the same three pillars as the Regional Action scenario, outlined in detail in Chapter 7 (see Section 7.1 for more details on the rationale for the policies in the different pillars and Table A B.1 in Annex B for a comparison of the stringency of the various policies between both policy scenarios):
Restrain plastics production and demand and enhance design for circularity:
A tax on plastics packaging, increasing linearly from 0 in 2021 to reach USD 1 000/tonne by 2030 globally, then doubling to USD 2 000/t by 2060.
A tax on the use of all other types of plastics, reaching USD 750/tonne by 2030 globally, then doubling to USD 1 500 / t by 2060.
Global policy instruments to increase circularity and encourage the more durable and repairable design of plastics. These policies are designed to achieve the following global targets: (i) extending product lifespans by 15% through greater durability; (ii) decreasing the demand for durable plastics by 10-20% by 2030, driven by products’ longer lifespans; (iii) achieving greater efficiency in plastics use by firms, matching the reduced household demand for durable plastics; and (iv) increasing the demand for repair services calibrated in such a way that the increased costs for repair services are as large as the avoided expenditures on durables, so that total expenditures are unaffected by the policy.
Enhance recycling:
Recycled content targets, with all countries achieving a 40% recycled content target by 2060. The modelling assumes this is achieved through combining a tax on primary plastics with a subsidy on secondary plastics.
Extended Producer Responsibility (EPR) implemented for packaging, electronics, motor vehicles and clothing in all countries. See Box 7.1 in Chapter 7 for a description of EPR and the modelling assumptions for this instrument.
Region-specific recycling rate targets; 60% by 2030 and 80% by 2060 for EU and the OECD Pacific region; 80% recycling by 2060 for other OECD countries and the People’s Republic of China (hereafter ‘China’); 60% by 2060 for the remaining countries. As with the EPR, the associated investment needs are included in the model.
Close leakage pathways:
Investment in mixed waste collection and sanitary landfills allows all countries to eliminate the mismanagement (e.g., dumping or burning waste in open pits) of all collected waste by 2060.
Policies to improve litter collection see collection rates increase more rapidly with income and reach 90% for high-income countries (versus 85% in the Baseline scenario). In addition, collection rates for low-income countries are increased from 65% to 75%.
8.2. Plastics use and waste are largely decoupled from economic growth in the Global Ambition scenario
8.2.1. The combined policies almost eliminate mismanaged waste by 2060
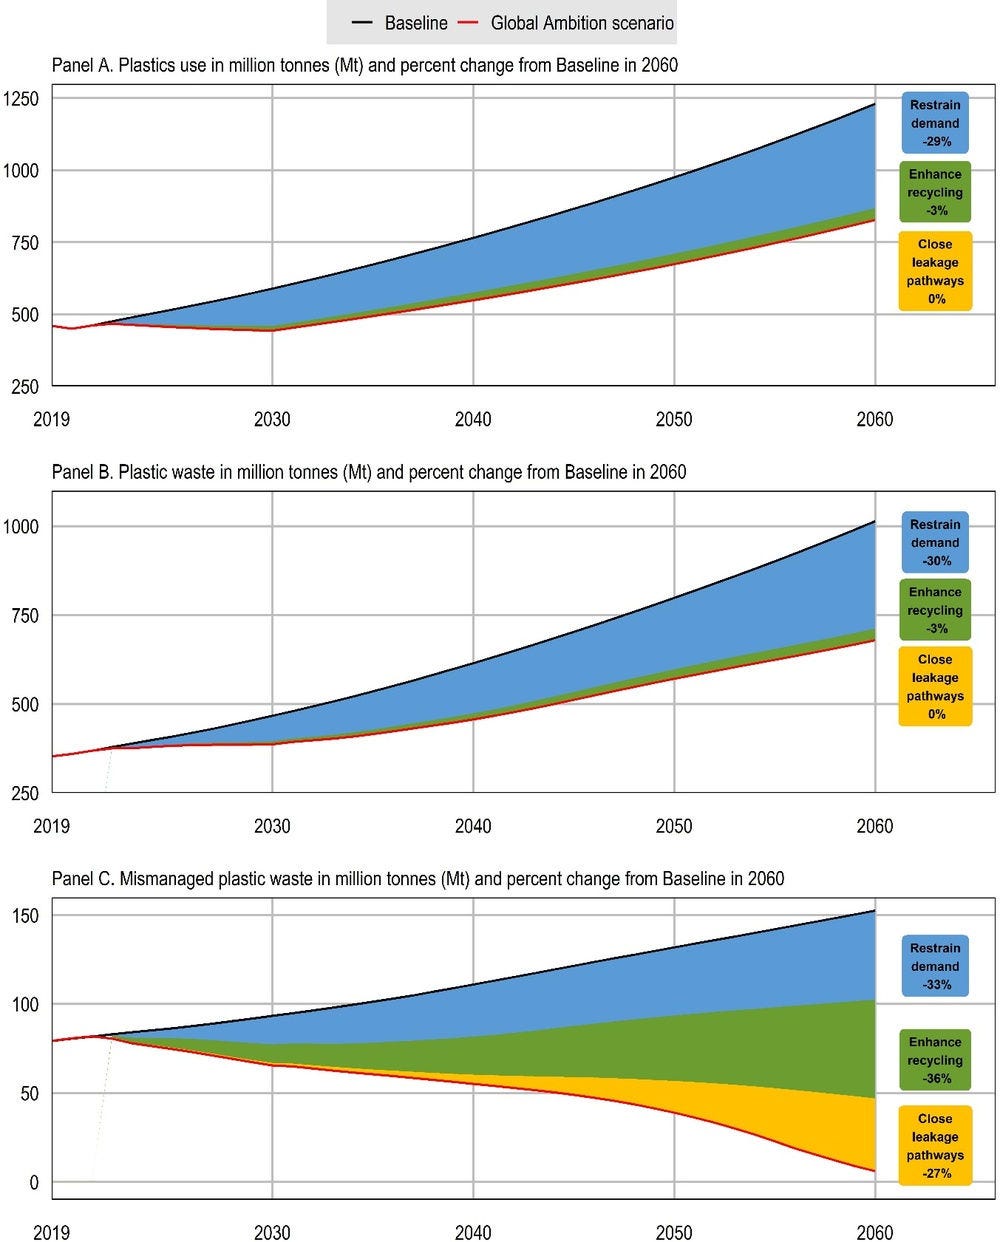
The Global Ambition policy package aims at reducing global plastics use substantially by 2030, and to increase policy ambition gradually to 2060. The scenario therefore delivers a sizable reduction in plastics production and use (Figure 8.1, Panel A). As in the more limited Regional Action scenario, the policies aiming to restrain demand are the most effective at reducing plastics use, cutting global use by one third (in comparison, the Regional Action scenario reduces plastics use by less than 20%). The rapid implementation of the policies to 2030 leads to an absolute decoupling of economic growth and plastics use, so that global plastics use in 2030 (443 Mt) is less than in 2019 (460 Mt), while GDP grows by more than 40% over the same timeframe. However, after 2030 plastics use starts to grow again as most policies reach their maximum levels but economic activity continues to grow. Even in this very ambitious scenario therefore, plastics use in 2060 is at 827 Mt projected to be 80% above 2019 levels and after 2050 continues to grow at 2% per year (while GDP growth gradually declines to 2.5% per year by 2060). This shows the significant dependence of the global economy on plastics, but it also underlines that relative decoupling of plastics use from economic growth is largely feasible.
As explained in earlier chapters, plastic waste trends largely follow plastics use, albeit with a delay (Figure 8.1, Panel B). In 2060, the Global Ambition scenario is projected to bring plastic waste down from 1 014 Mt in the Baseline scenario to 679 Mt, a reduction of 33%. Although the total reduction in 2060 is very similar for plastics use and waste, their time profile is different: the deviation from the Baseline projection is slower for waste, and thus total plastic waste in 2030 (387 Mt) is almost 10% above 2019 levels, while global plastics use decreases slightly over the same time period. This reflects the delayed effect of policies aimed at long-lived plastics applications. The delayed effects of the stringent policies on plastics use also imply that in the longer run (after 2050), annual growth in plastic waste is, at 1.8% per year, lower than growth in plastics use.
The continued increase of plastics use and waste in the long run, despite the highly stringent policy measures, highlights the economy’s significant dependence on plastics. Ambitious policies are therefore needed to avoid plastic waste from leaking to the environment. The Global Ambition scenario combines all three policy pillars to maximise the reduction in mismanaged waste: restraining demand to reduce the scale of waste that has to be treated; enhancing recycling to reduce the quantities of waste that have to be managed over time; and closing leakage pathways to ensure that the remaining waste is not mismanaged. Figure 8.1, Panel C shows how these three pillars combine to bring annual mismanaged waste flows down from 153 Mt in the Baseline scenario in 2060 to almost zero (6 Mt). The only leakage sources that remain in this scenario are those that are not captured by waste management systems – microplastics and uncollected litter – and which continue to leak into the environment.
Figure 8.1. Mismanaged waste is almost completely eliminated worldwide in the Global Ambition scenario
8.2.2. Sectors and regions vary in their reduction of plastics use
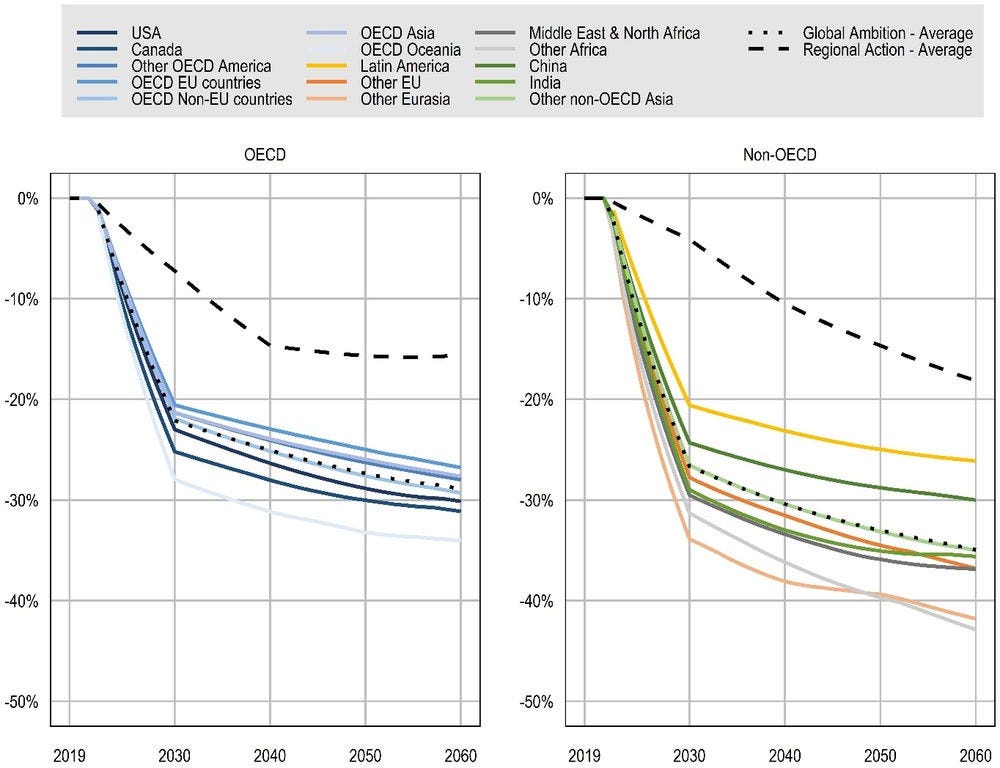
The substantial reduction in plastics use from Baseline levels is achieved in all regions in the Global Ambition scenario, but their levels of reduction vary (Figure 8.2). The global nature of the policy package ensures that low-cost opportunities to reduce plastics use are reaped everywhere and that plastics use reductions ramp up rapidly to 2030. Despite equal tax rates on plastics use being imposed globally, there are significant differences across regions in the resulting reductions of plastics use. In regions where the average plastics intensity of the economy is relatively high (cf. Chapter 3), a tax on every tonne of plastics input translates into a relatively large increase in production costs. This induces a stronger re-alignment of economic activities away from plastic-using sectors, especially in the Other Eurasia region (which includes the Russian Federation) and countries in Sub-Saharan Africa (Other Africa). Higher price increases lead to greater substitution of plastics by other materials in production, stronger shifts away from the sectors that use large amounts of plastics, and a shift towards more efficient foreign producers. While these all imply lower levels of plastics use, they also imply higher macroeconomic costs (see Section 8.4 below).
Figure 8.2. Regional reductions in plastics use to 2030 are substantial in the Global Ambition scenario
The stronger reductions in plastics use in the Global Ambition scenario compared to the Regional Action scenario occurs in all sectors, though not evenly (Figure 8.3). In both scenarios and in both OECD and non-OECD regions, the strongest reductions in plastics use are in the Business services sector, due to its sheer size and the fact that it is a major user of plastics. The degree of difference in ambition levels between the Regional Action and Global Ambition scenarios varies according to the policy instrument (see Annex B). For instance, the EPR scheme is extended to non-OECD countries in the Global Ambition scenario, leading to substantially larger plastics use reductions in the sectors concerned, especially motor vehicles. In OECD countries, the additional reductions can largely be attributed to the higher taxes on plastics use. The use of plastics in construction is reduced significantly in both OECD and non-OECD countries, driven by both higher tax rates and stronger ecodesign policies that reduce demand for construction.
Figure 8.3. A few sectors make up the bulk of plastics use reductions in the Global Ambition scenario
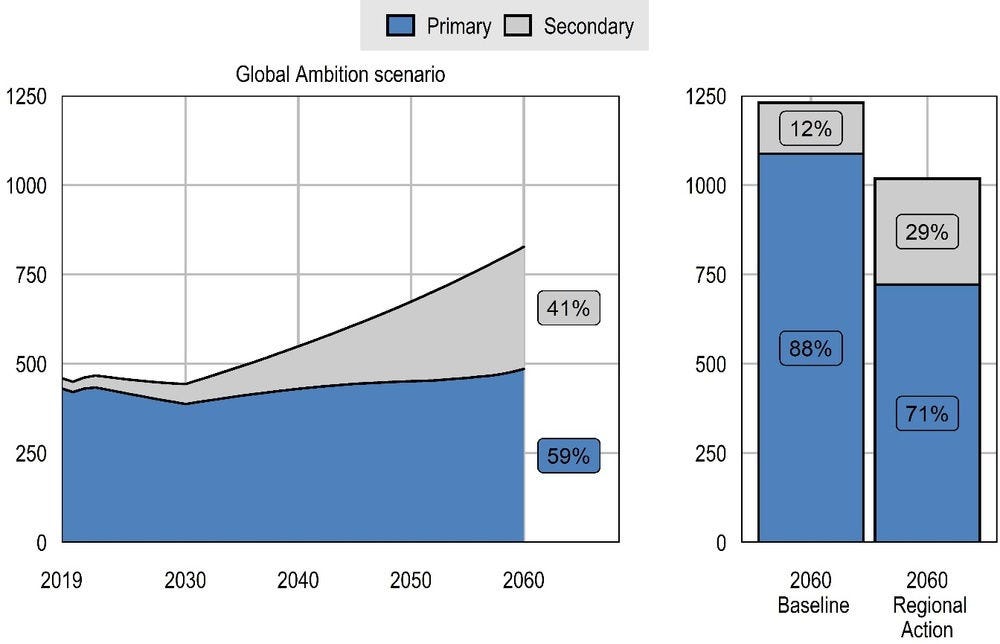
The policies in the Global Ambition scenario are just about strong enough to avoid any major increase in primary plastics use: the total increase in primary plastics production between 2019 and 2060 is projected to be 13%, all occurring after 2030 (Figure 8.4). This is the result of a combination of lower overall demand and the faster penetration of secondary plastics. The share of secondary plastics rises to 41% by 2060, substantially larger than the 12% in the Baseline and 29% in the Regional Action scenario. Compared to the Regional Action scenario, the increase in secondary production is much stronger in non-OECD countries in the Global Ambition scenario, as the recycled content targets are increased from 20% to 40%. For OECD countries, the amount of secondary plastics produced in 2060 (129 Mt) is smaller than in the Regional Action scenario (155 Mt), despite having the same recycled content targets (40% in both scenarios). This is explained by the lower level of total plastics produced in the more ambitious scenario: on the one hand there is less demand for plastics (311 Mt plastics use in OECD in the Global Ambition scenario vs. 369 Mt in the Regional Action scenario); and on the other, less waste is generated (253 Mt in Global Ambition vs 297 Mt in Regional Action), reducing the availability of plastic scrap from recycling (despite higher recycling rates, see Section 8.2.3).
Figure 8.4. Secondary plastics production can meet almost all demand growth in the Global Ambition scenario
8.2.3. The Global Ambition policies completely transform how waste is treated
The Global Ambition scenario is designed to prevent significant leakage of plastics to the environment by ensuring proper treatment of all plastic waste: all plastics are recycled where possible; when recycling is not possible they are either incinerated (and energy recovered) or landfilled in a sanitary manner. In this way, mismanaged waste is minimised and the only sources of leakage that remain are those that cannot be treated easily, such as microplastics and uncollected litter, accounting for 6 Mt globally in 2060. The result is that recycling rates more than triple globally (to 59% in 2060, from 17% in the Baseline), while mismanaged waste falls (Figure 8.5). As expected, the Restrain demand pillar is an effective way to reduce the scale of the plastic waste problem, while the Enhance recycling policies are key to increasing recycling rates. The Close leakage pathways policy reduces all mismanaged waste that is treated by the waste facilities to zero, leaving only uncollected (mismanaged) waste.
Figure 8.5. In the Global Ambition scenario recycling rates triple while mismanaged waste is almost completely eliminated

Note: The chart presents the cumulative impacts of the individual policy pillars, with the far-right column showing the entire Global Ambition scenario.
Source: OECD ENV-Linkages model.
The global decline in mismanaged waste is mostly driven by improvements in non-OECD countries, thanks to much more stringent policies in the Global Ambition scenario (Figure 8.6). These countries accounted for almost 90% of global mismanaged waste in 2019; and this share is projected to increase even further by 2060 in the Baseline scenario. By 2060, non-OECD countries reduce mismanaged waste to a residual 4.1 Mt in the Global Ambition scenario, 65.8 Mt less than in 2019. OECD countries already reduce mismanaged waste to near zero in the Regional Action scenario; the Global Ambition scenario reduces their mismanaged waste by another 7.5 Mt, leaving only 2.0 Mt.
Figure 8.6. Mismanaged waste gradually declines to almost zero in the Global Ambition scenario
8.3. The environmental benefits of the Global Ambition scenario are substantial
8.3.1. Leakage of both macro- and microplastics is curbed
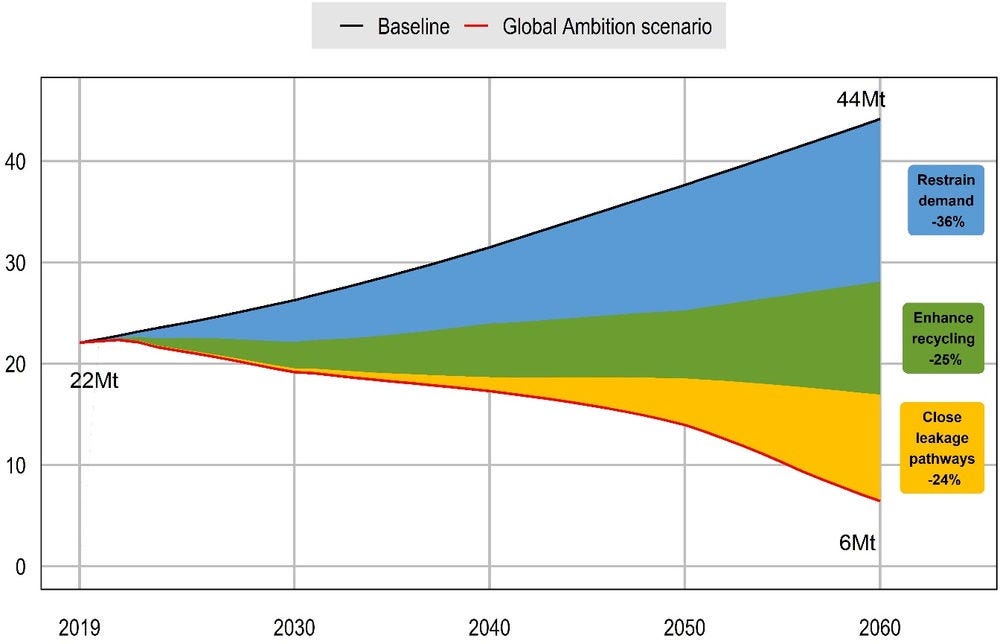
The implementation of the Global Ambition scenario is projected to substantially curb the leakage of plastics in the environment (Figure 8.7). By 2060, global plastic leakage to the environment is projected to decrease by 85% compared to the Baseline scenario, from 44.2 Mt to 6.4 Mt. This is an additional 30 percentage point decrease below the reductions projected for the Regional Action scenario in Chapter 7. Most of this additional decrease is driven by non-OECD countries, where the more ambitious policies implemented compared to the Regional Action scenario result in substantially lower losses to the environment, falling 89% below the Baseline levels in 2060, to 4.7 Mt (from 41.6 Mt in the Baseline scenario). These are well below the 2019 levels.
Figure 8.7. All pillars combined reduce plastic leakage to the environment dramatically
Source: OECD ENV-Linkages model, using the methodology adapted from Ryberg et al. (2019[10]) and Cottom et al. (2022[11]).
Across regions, the reductions in macroplastic leakage from the policy package dwarf those of microplastic leakage (Figure 8.8). This difference reflects the fact that the Global Ambition policy package primarily focuses on macroplastics. The Global Ambition scenario is projected to almost eliminate leakage of macroplastics into the environment, which falls by 97% in 2060 compared to the Baseline scenario.
Figure 8.8. Non-OECD countries account for the largest reductions in plastic leakage to 2060 in the Global Ambition scenario

Source: OECD ENV-Linkages model, using the methodology adapted from Ryberg et al. (2019[10]) and Cottom et al. (2022[11]).
In the Global Ambition scenario, losses of microplastics into the environment fall 9% below the Baseline scenario in 2060 (from 5.8 Mt in the Baseline scenario to 5.3 Mt in the Global Ambition scenario). These reductions are mostly driven by lower use of plastics in the economy overall. Furthermore, the reductions are evenly distributed across regions, with the largest reductions occurring in non-OECD countries, especially Other Africa and Other Eurasia (Figure 8.8, panel B).
Primary pellets,2 wastewater sludge and road markings account for the largest reductions in microplastic leakage (Figure 8.9). While both OECD and non-OECD regions stem losses from primary pellets, wastewater sludge is the largest source of leakage reductions in OECD countries.3 Eroded road markings are another important source for both OECD and non-OECD countries, but are not reduced by the policy package, explained above.
The reduction in macroplastic leakage stems from the decrease in mismanaged waste, as shown in Figure 8.9. As explained in Section 8.2.3, most sources of mismanaged waste are eliminated in the Global Ambition scenario by 2060.
Figure 8.9. The plastic leakage reductions in the Global Ambition scenario stem from different sources in OECD versus non-OECD countries

Note: scales differ for each panel. WW = wastewater.
Source: OECD ENV-Linkages model, using the methodology adapted from Ryberg et al. (2019[10]) and Cottom et al. (2022[11])
8.3.2. Leakage to aquatic environments is almost eliminated by 2060 in the Global Ambition scenario
The Global Ambition scenario is projected to almost eliminate global plastic leakage to aquatic environments by 2060, with a 98% reduction from the Baseline (Figure 8.10), from 11.6 Mt in the Baseline to 0.2 Mt. By comparison, the Regional Action scenario only achieves a 60% reduction from the Baseline, with substantial leakage remaining in non-OECD countries. Thus, the stronger policy action in the Global Ambition scenario drives an additional 38 percentage point decrease. The uncertainty surrounding this projection, as discussed in Chapter 5, is substantial (Box 8.1).
The scale of the effects varies across regions, with non-OECD countries experiencing the largest leakage declines. All non-OECD countries achieve substantial reductions compared to 2060 Baseline levels, and all reduce absolute levels below those of 2019. Small amounts of plastic leakage remain in Africa and non-OECD Asia.
Box 8.1. The reductions in leakage to aquatic environments are large, regardless of uncertainties
As highlighted in Chapter 5, there are significant uncertainties surrounding the projections of plastic leakage to aquatic environment. These uncertainties affect both the Baseline and policy scenarios. Therefore, the results in terms of percentage reduction from baseline are more robust than assessments of the absolute reductions in million tonnes (Table 8.1).
Table 8.1. The reduction in plastic leakage to aquatic environments in the Global Ambition scenario is substantial across a range of model assumptions
|
Global Ambition scenario compared to Baseline (percentage difference) |
||||
|---|---|---|---|---|
|
Estimate |
2030 |
2040 |
2050 |
2060 |
|
Central |
-30% |
-50% |
-70% |
-98% |
|
High |
-30% |
-50% |
-70% |
-98% |
|
Low |
-31% |
-50% |
-69% |
-98% |
|
Global Ambition scenario compared to Baseline (difference in Mt) |
||||
|
Estimate |
2030 |
2040 |
2050 |
2060 |
|
Central |
-2.2 |
-4.2 |
-7.0 |
-11.4 |
|
High |
-3.0 |
-6.0 |
-9.9 |
-16.5 |
|
Low |
-1.2 |
-2.4 |
-3.8 |
-6.0 |
Note: Each estimate for the Global Ambition scenario is compared to the corresponding estimate for the Baseline, using the same methodology as in Chapter 5, to quantify the uncertainty ranges.
Source: OECD ENV-Linkages model, based on (Lebreton and Andrady, 2019[12]).
The effect of the policies increases over time, but will still fail to totally eliminate the accumulation of plastics leaked to aquatic environments in the coming decades. While net inflows of plastic leakage decrease to near-zero levels by 2060, more than 60% of the plastic leakage flows projected in the Baseline will still take place, mostly in earlier decades, adding to the stocks of plastics already in rivers and the ocean: these continue to rise from 109 Mt in 2019 to 197 Mt in 2060 (+87 Mt) for rivers and lakes and from 30 Mt to 103 Mt (+73 Mt) in the ocean, respectively, in the Global Ambition scenario (Figure 8.11). The combined amount of plastics accumulating in rivers and the ocean between 2019 and 2060 is thus projected to equal 300 Mt, more than the 140 Mt estimated to be already present in 2019: even with ambitious global policy measures, the stocks of plastics more than double by 2060. In conclusion, while the Global Ambition scenario largely solves the long-term problem, as it almost eliminates the net inflows of plastics in 2060, in the interim clean-up solutions need to be implemented to deal with the plastics that have leaked to aquatic environments.
Figure 8.10. Plastic leakage to aquatic environments will be vastly reduced across all non-OECD regions in the Global Ambition scenario
Figure 8.11. Despite ambitious global action, stocks of plastics in aquatic environments still grow substantially
8.4. The macroeconomic impact is limited, though highest for non-OECD countries
8.4.1. The costs of global action are largely falling on non-OECD countries
The macroeconomic costs of the Global Ambition scenario are, as expected, higher than in the Regional Action scenario, but are still limited to less than 1% of Baseline GDP globally in 2060 (Figure 8.12). This equates to a value of around USD 3.4 trillion. While that is a large absolute number, it should be seen in the context of significant economic growth of more than 3% on average annually to 2060. The impact of the policy package on the economies of non-OECD countries is certainly not negligible and will require supportive policies to ensure the situation for vulnerable households is not exacerbated. Countries already use Official Development Assistance (ODA) to support action to address plastic leakage in developing countries, but the financial flows are a fraction of what is needed and additional sources of funding will be required (OECD, 2022[1]).
In the short run, the efficiency gains induced by the policy package, and the shifts in comparative advantage, may increase economic activity in some countries, notably China. These shifts are driven by the policies for ecodesign in the “restrain demand” pillar, which reduce plastics use in manufacturing of durable commodities, while simultaneously boosting demand for repair activities. In some regions, this boosts economic growth. Furthermore, as prices of plastics-intensive commodities do not increase equally across countries, comparative advantages start to shift, leading to gains in some regions and losses in others.
Figure 8.12. The additional costs of Global Ambition are concentrated in non-OECD countries
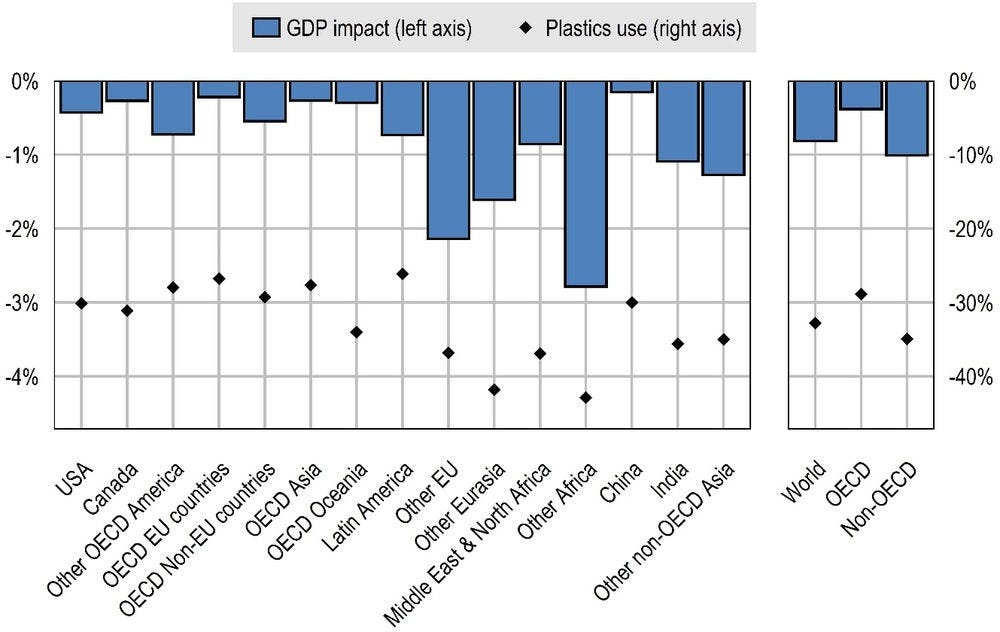
The regional economic implications of the Global Ambition scenario are uneven: costs are very limited in China and the OECD EU countries, but higher for the non-OECD EU countries and Sub-Saharan Africa (Other Africa) (Figure 8.13). The largest costs are projected for Sub-Saharan Africa, where GDP declines 2.8% below the Baseline, not least because substantial investments in improved waste management must be made to achieve the ambitious policy targets.
Given the complexity of the policy package, in which seven policy instruments all interact, along with interactions between sectors and regions, the regional costs cannot be attributed to one single cause. They are driven by a mixture of domestic policy costs from the fiscal instruments and regulations; investment in waste systems; induced effects on demand for goods and services, as relative prices shift and income levels change; and competitiveness changes between competitors in different countries and related changes in exchange rates. All relative prices change and regional and global economies find new equilibria in sectoral and regional demand and supply.
Figure 8.13. The effects on regional GDP of the Global Ambition scenario are strongest outside of OECD
8.4.2. Though expensive, cleaning up plastic leakage is worthwhile given the high costs of environmental damage it causes
The analysis in this chapter has shown that mismanaged waste streams can be reduced to nearly zero by implementing a broad and ambitious policy package (Section 8.2). Even so, substantial amounts of plastics will continue to leak into the environment up until 2060, further adding to existing stocks of plastics in the aquatic environment (Section 8.3).
These residual flows of leaked plastics, and the stock of plastics already in rivers and the ocean, can in principle be cleaned up. The environmental benefits of clean-up activities are clear, and the damage avoided could be substantial, including in monetary terms. One recent study estimates the economic impacts of marine pollution at between USD 3 300 and USD 33 000 per tonne per year, based on ecosystem damage alone (Beaumont et al., 2019[13]). Another study, reported in OECD (2021[14]), estimates that even removing less than 10% of the derelict pots and traps in major crustacean fisheries could result in USD 831 million annual savings globally (Scheld, Bilkovic and Havens, 2016[15]).4
Technological developments in recent years have made the option to remove plastics from the environment more attainable, even if the costs remain substantial. One study estimates current expenditures on cleaning up to be about USD 2 bn globally, based on costs of cleaning up plastics pollution that range from USD 0.01 to USD 2.51 per capita per region (Deloitte, 2019[16]). The literature on the costs of cleaning up marine plastics pollution provides a wide range of estimates, but can provide insights into the size of the challenge (Table 8.2).
Table 8.2. Estimates of clean-up costs vary widely
|
Clean-up scope |
Clean-up cost |
Country scope |
Source |
|---|---|---|---|
|
Beach litter |
EUR 121/t |
United Kingdom |
|
|
Beach litter |
EUR 1 877/t |
Netherlands and Belgium |
|
|
Derelict fishing gear |
USD 25 000/t |
North-West Hawaiian Islands |
|
|
Shoreline cleaning / Marine debris |
USD 1 300/t |
Korea |
|
|
Shoreline cleaning / Marine debris |
Mechanical: USD 1 100 – 11 400/t Manual: USD 2 200 – 22 800/t |
France |
|
|
Shoreline cleaning / Marine debris |
USD 2 339/t (Direct costs only: USD 1 766/t) |
Southeast Alaska |
|
|
Shoreline cleaning / Marine debris |
USD 8 900/t |
Aldabra Atoll (a remote small island) |
While these clean-up costs are substantial, they represent on average around one-third of the estimated damage costs cited above. Thus, as clean-up activities will create a net benefit to society, it makes economic sense to scale them up.
More importantly, not taking policy action would lead to significantly higher leakage levels to the environment, implying much higher clean-up costs. Having to clean up the full stock of 145 Mt plastics in the aquatic environment in the Baseline scenario, at costs of more than USD 1 000 per tonne, would be much more costly. Considering that waste treatment costs range from less than USD 100 per tonne for landfilling to less than USD 300 per tonne for recycling (Table 7.1 in Chapter 7), they are an order of magnitude lower, prevention is clearly more economically rational than cleaning up afterwards.
To conclude, more ambitious policies that prevent plastic leakage are much more cost-effective than allowing plastics to leak to the environment, but cleaning up is still more cost-effective than allowing plastics to pollute natural environments.
References
[6] AOSIS (2021), Alliance of Small Island States Leaders’ Declaration.
[5] ASEAN (2021), ASEAN Regional Action Plan for Combating Marine Debris in the ASEAN Member States (2021 – 2025), https://asean.org/book/asean-regional-action-plan-for-combating-marine-debris-in-the-asean-member-states-2021-2025-2/.
[13] Beaumont, N. et al. (2019), “Global ecological, social and economic impacts of marine plastic”, Marine Pollution Bulletin, Vol. 142, pp. 189-195, https://doi.org/10.1016/j.marpolbul.2019.03.022.
[22] Burt, A. et al. (2020), “The costs of removing the unsanctioned import of marine plastic litter to small island states”, Scientific Reports, Vol. 10/1, https://doi.org/10.1038/s41598-020-71444-6.
[7] COBSEA (2019), Regional Action Plan on Marine Litter 2019 (RAP MAL), https://www.unep.org/cobsea/resources/policy-and-strategy/cobsea-regional-action-plan-marine-litter-2019-rap-mali.
[11] Cottom, J. et al. (2022), “Spatio-temporal quantification of plastic pollution origins and transportation (SPOT)” University of Leeds, UK, https://plasticpollution.leeds.ac.uk/toolkits/spot/.
[16] Deloitte (2019), The price tag of plastic pollution. An economic assessment of river plastic, https://www2.deloitte.com/content/dam/Deloitte/nl/Documents/strategy-analytics-and-ma/deloitte-nl-strategy-analytics-and-ma-the-price-tag-of-plastic-pollution.pdf.
[9] European Commission (2019), The European Green Deal, European Commission, Brussels, https://eur-lex.europa.eu/legal-content/EN/TXT/?qid=1576150542719&uri=COM%3A2019%3A640%3AFIN (accessed on 20 November 2020).
[4] G20 Leaders (2021), G20 Rome Leaders’ Declaration, https://www.consilium.europa.eu/media/52730/g20-leaders-declaration-final.pdf (accessed on 29 April 2022).
[8] HELCOM (2015), Marine litter action plan, https://helcom.fi/media/publications/Regional-Action-Plan-for-Marine-Litter.pdf.
[19] Hwang, S. and J. Ko (2007), Achievement and progress of marine litter retrieval project in near coast of Korea - based on activities of Korea Fisheries Infrastructure Promotion Association, Presentation to Regional Workshop on Marine Litter, Rhizao, China, June 2007. North West Pacific Action Plan.
[20] Kalaydjian, R. et al. (2006), , Marine Economics Department, IFREMER, Paris, France.
[12] Lebreton, L. and A. Andrady (2019), “Future scenarios of global plastic waste generation and disposal”, Palgrave Communications, Vol. 5/1, p. 6, https://doi.org/10.1057/s41599-018-0212-7.
[21] McIlgorm, A., H. Campbell and M. Rule (2009), Understanding the economic benefits and costs of controlling marine debris in the APEC region (MRC 02/2007). A report to the Asia-Pacific Economic Cooperation Marine Resource Conservation Working Group, National Marine Science Centre (University of New England and Southern Cross University), Coffs Harbour.
[3] Ministry of Foreign Affairs, Japan (2019), “G20 Osaka Leaders Declaration”, G20 2019 Japan, https://www.mofa.go.jp/policy/economy/g20_summit/osaka19/en/documents/final_g20_osaka_leaders_declaration.html (accessed on 29 April 2022).
[17] Mouat, J., R. Lopez Lazano and H. Bateson (2010), Economic Impacts of Marine Litter, Kommunernes International Miljøorganisation [Local Authorities International Environmental Organisation], http://www.kimointernational.org/wp/wp-content/uploads/2017/09/KIMO_Economic-Impacts-of-Marine-Litter.pdf.
[2] OECD (2022), “Declaration on a Resilient and Healthy Environment for All”, OECD/LEGAL/0468, https://legalinstruments.oecd.org/en/instruments/OECD-LEGAL-0468 (accessed on 11 April 2022).
[1] OECD (2022), Global Plastics Outlook: Economic Drivers, Environmental Impacts and Policy Options, OECD Publishing, Paris, https://doi.org/10.1787/de747aef-en.
[14] OECD (2021), “Towards G7 action to combat ghost fishing gear: A background report prepared for the 2021 G7 Presidency of the United Kingdom”, OECD Environment Policy Papers, No. 25, OECD Publishing, Paris, https://doi.org/10.1787/a4c86e42-en.
[18] Raaymakers, S. (2007), The Problem of Derelict Fishing Gear: Global Review and Proposals for Action Food and Agricultural Organisation.
[10] Ryberg, M. et al. (2019), “Global environmental losses of plastics across their value chains”, Resources, Conservation and Recycling, Vol. 151, p. 104459, https://doi.org/10.1016/j.resconrec.2019.104459.
[15] Scheld, A., D. Bilkovic and K. Havens (2016), “The Dilemma of Derelict Gear”, Scientific Reports, Vol. 6/19671, https://doi.org/10.1038/srep19671.
Notes
← 1. One key difference is that the Global Ambition scenario targets policy implementation to 2060, whereas OBOV aims for 2050.
← 2. Small blocks of polymers ready for conversion into the production of primary plastics, and that can be spilled accidentally during production, transport or storage.
← 3. Wastewater treatment plants filter out plastics from sewage water and concentrate them in the resulting sludge. Since sludge is commonly used as compost on agricultural fields in many countries, some of the microplastics captured during wastewater treatment may end up in the environment. As countries become richer, they invest more in wastewater treatment. That means that while fewer microplastics from other sources are released into water, more microplastics end up in the resulting wastewater sludge. This sludge is sometimes spread on land, which means that more sludge also means more leakage.
← 4. Derelict fishing gear is a major source of marine debris which has been charged with damaging sensitive habitats, creating navigational hazards, as well as reducing populations of target and non-target species.
