OECD Economic Surveys: Korea 2018

Key policy insights
Abstract
Korea’s transformation from one of the poorest countries in the world in the 1950s to a major industrial power and member of the OECD was exceptionally rapid, reflecting good policies, notably sound fiscal and monetary policy, high levels of investment in human and physical capital and an outward orientation that increased its share of world trade. Per capita income increased from 6% of the OECD average in 1970 to 89% in 2017 (Figure 1). Rapid development has been export-led, with large business groups, known as chaebols, making Korea the world’s sixth-largest exporter. However, the traditional growth model seems to be losing effectiveness, as income growth has slowed toward the OECD average. Korea’s low level of labour productivity, at 46% below the top half of OECD countries, suggests scope for continued convergence. Low labour productivity is offset by very long working hours, at the expense of well-being and female employment. The decline in the working-age population beginning in 2017 year will put downward pressure on per capita income growth.
Figure 1. Korea’s per capita income is converging to the most advanced countries1
OECD area’s per capita income in 2017 = 100
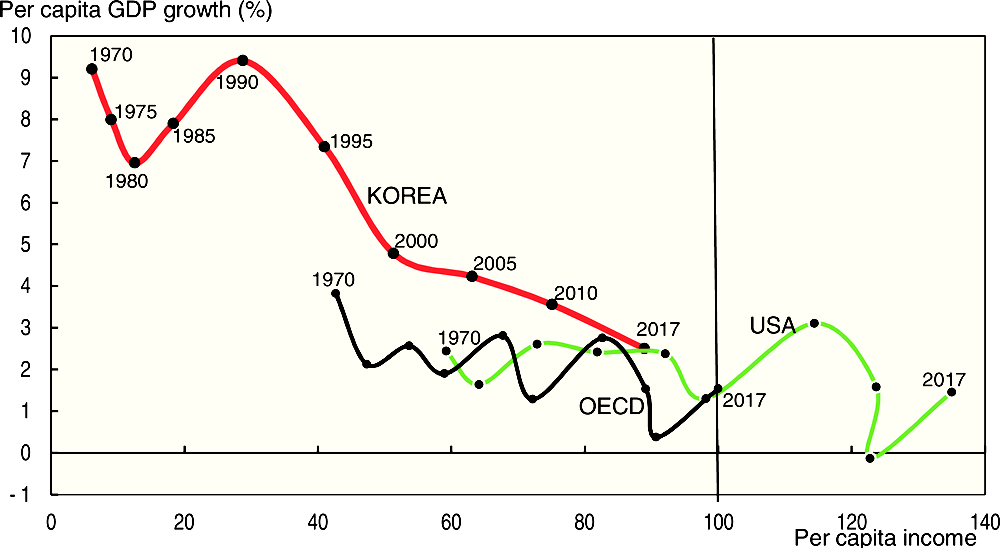
1. The figure shows per capita income (at 2017 purchasing power exchange rates) as a share of the OECD average in 2017, which is set at 100, for Korea, the United States and the OECD. Data are shown at five-year intervals from 1970 to 2010 and in 2017.
Source: OECD Economic Outlook: Statistics and Projections (database).
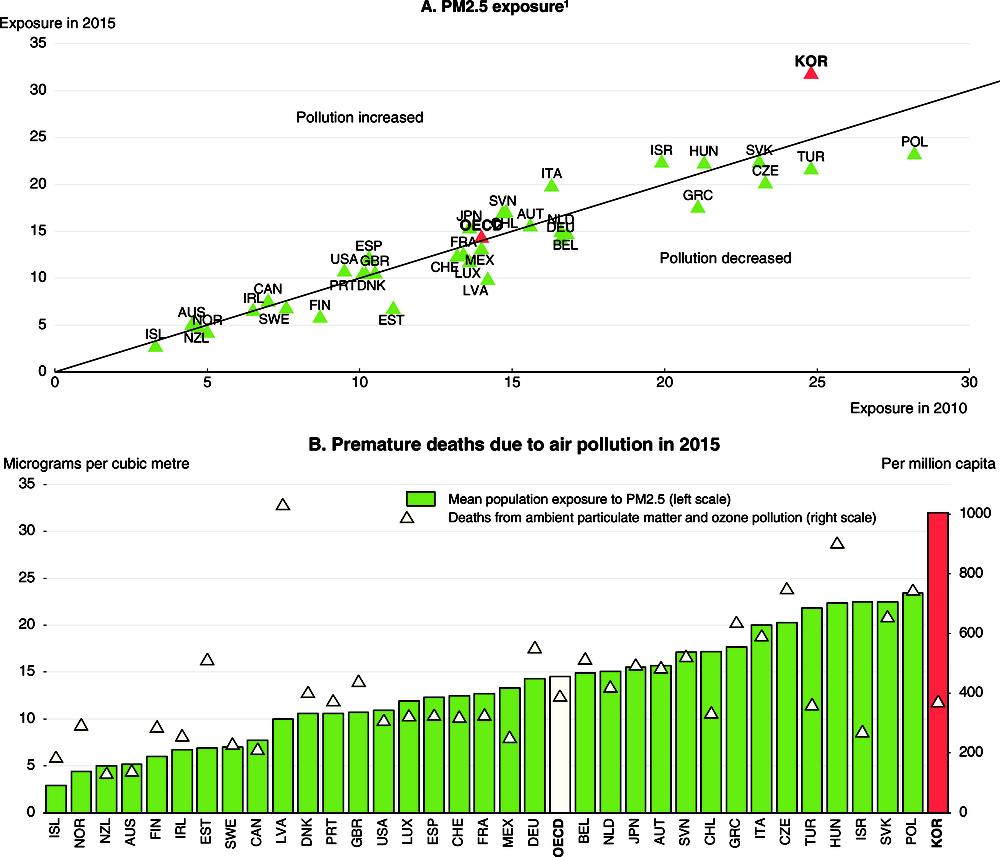
While growth typically decelerates during economic development, the rapidity of the slowdown calls into question the viability of Korea’s traditional model. Export volume growth has declined from an annual rate of 11.4% over 2001-11 to 2.6% over 2011-17, lagging behind global trade. Moreover, the spillover effect from exports to domestic demand and employment has weakened, as large firms have become increasingly internationalised and are focusing on more capital and technology-intensive products. The traditional model has also led to polarisation between large companies and small and medium-sized enterprises (SMEs) and between the manufacturing and service sectors. Indeed, labour productivity in SMEs in manufacturing has fallen to only a third of that in large companies, despite extensive government assistance to small firms. Korea’s emphasis on manufacturing has also contributed to rising greenhouse gas emissions and high levels of pollution. Indeed, air pollution is a major health concern (OECD, 2017e).
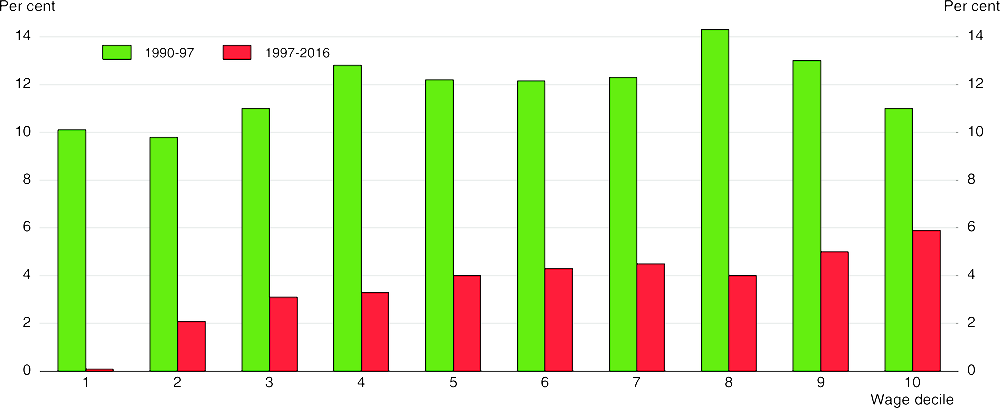
The polarisation has resulted in rising relative poverty and income inequality in Korea, which stood out for its low degree of inequality during its high growth era from 1961 to 1996 (OECD, 2013a). Workers in the bottom 10% of the wage distribution have experienced virtually no wage growth during the past 20 years (Figure 2). While similar trends are seen in some other OECD countries, it was exacerbated by rising labour market dualism and stagnant productivity in SMEs. By 2015, the income share of the top 10% was 4.4 times higher than that of the bottom 10%, the 12th highest ratio in the OECD area.
Figure 2. Wage inequality has increased during the past two decades
Nominal wage growth per year by decile
The government aims to achieve “income-led growth” driven by job creation: “We need an economic paradigm shift from the idea that jobs are created as the result of growth to the idea that growth occurs when jobs increase” (Korea.net, 2017). In order to get quick results, “the public sector needs to make the first move”. In addition to expanding public employment, household income is to be boosted by a sharp rise in the minimum wage and increased social spending. The President has placed reform of the large business groups at the forefront of his agenda to create a “fair economy”. The government also aims to make SMEs a driver of innovation by promoting the fourth industrial revolution and nurturing innovative start-ups. Achieving the government’s objective of maintaining output growth at around its current pace of 3% requires boosting productivity growth. Korea’s large investments in education and R&D, which is the second highest in the OECD area as a share of GDP, suggest significant potential for higher productivity.
Against this backdrop, the main messages of this Economic Survey are:
Korea needs to shift from its traditional growth model to a more balanced approach that promotes inclusive growth through reforms to raise productivity in both the large business groups and SMEs.
Labour market reforms to raise the employment of women, youth and older persons and to break down labour market dualism are key to enhancing well-being and social inclusion, while mitigating the impact of rapid population ageing.
Addressing environmental problems and promoting green growth is essential to improve health and well-being, as well as to ensure the sustainability of growth.
Recent macroeconomic developments and short-term prospects
Korea has experienced slow and unbalanced growth during the past few years
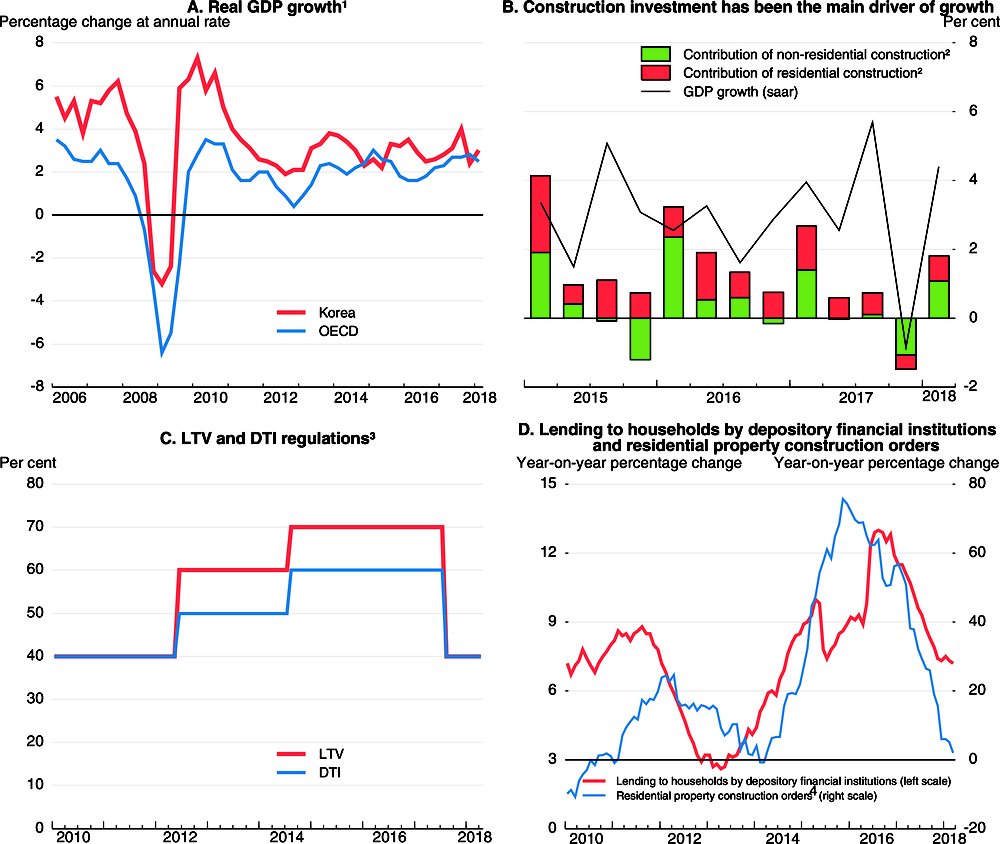
Between the final quarter of 2014 and mid-2017, annualised GDP growth was 3.0% (Figure 3), with construction investment accounting for more than half of output gains (Panel B). Construction was driven by residential investment, which soared at a 23% annualised rate over that period, fuelled by the easing of regulations on mortgage lending (Panel C). Rising lending to households (Panel D) boosted household debt, which reached 180% of household disposable income in 2016 (see below). The household saving rate climbed from less than 4% of household income in 2012 to around 9% in 2015-16, as consumers coped with higher debt levels and the need to prepare for retirement. The rising saving rate has constrained private consumption, which has lagged output growth each year since 2006.
Figure 3. Output growth has been led by the construction sector
1. Three-quarter moving average.
2. Contribution to GDP growth in percentage points.
3. The loan-to-value (LTV) ratio restricts the size of a housing loan to a certain percentage of the value of the property securing the loan. The debt-to-income (DTI) ratio shows borrowers’ monthly debt burden relative to monthly pay. An increase in the LTV and DTI ratios encourages mortgage lending. The ratios in the figure are those applied to bank loans for properties in the Seoul region, including “speculative districts”.
4. A 24-month moving average.
Source: OECD Economic Outlook: Statistics and Projections (database); Financial Supervisory Commission; Bank of Korea.
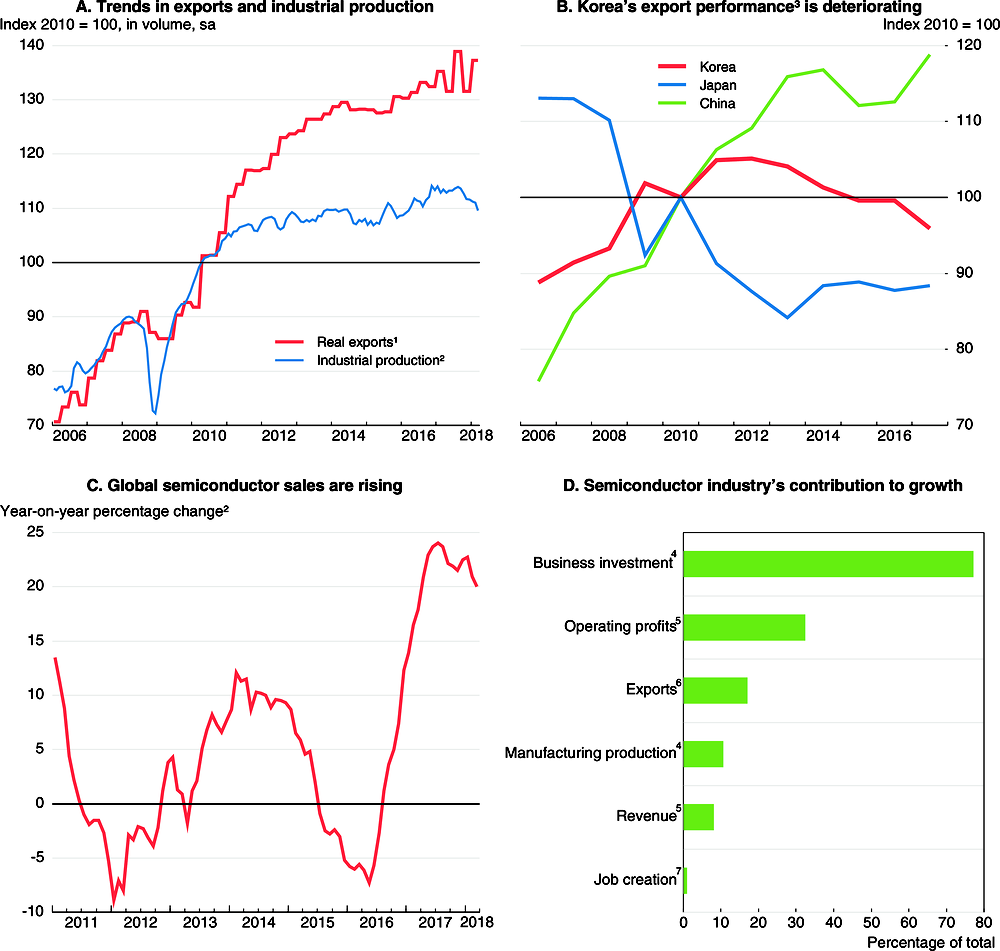
Exports, which account for about half of GDP, were also sluggish between the final quarter of 2014 and mid-2017, expanding at a rate of only 1.0% (Figure 4). Korea’s export performance (in volume terms) has deteriorated since its peak in 2012 (Panel B). Sluggish exports reflect a 2.2% drop (USD value terms) over 2014-17 in shipments to China, Korea’s largest trading partner. China’s decision in 2016 to cut imports of Korean products and to ban Chinese tour groups from visiting Korea in retaliation for Korea’s decision to deploy a missile defence system contributed to the fall in China’s share of Korean exports from its 2015 peak (Table 1). Meanwhile, the export shares of Vietnam and Hong Kong, China increased.
Figure 4. Export growth is led by key industries, notably semiconductors
1. Goods and services on a national accounts basis in volume terms.
2. Three-month moving average.
3. Growth in exports relative to the growth of the country’s export market, which is calculated as the weighted average of import growth in Korea’s 53 major trading partners. Export performance improves if Korea’s export growth exceeds import growth in its 53 trading partners.
4. January to August 2017.
5. In the manufacturing sector in the first half of 2017.
6. Share of exports in USD value in 2017.
7. In the first half of 2017.
Source: Statistics Korea; Bank of Korea; OECD Economic Outlook: Statistics and Projections (database); World Semi-Conductor Statistics; Nomura Global Economics.
Output growth rebounded in mid-2017, aided by the pick-up in global trade, and fiscal stimulus. The rebound in world sales of semiconductors (Figure 4, Panel C) played a key role, as Korea held 58% of the global memory market in 2016. In 2017, Korea’s semiconductor exports jumped 57% (year-on-year, customs basis), representing 17.1% of total exports (Table 1, Panel B). The semiconductor industry accounted for one-third of operating profits in manufacturing and over three-quarters of total business investment during the first eight months of 2017 (Figure 4, Panel D). However, the export boom in this highly automated industry had a limited impact on employment, accounting for only 1% of job creation during the first half of 2017. Other products that increased their share of Korean exports in 2017 include petroleum products and ships (Table 1, Panel B). However, cars and car parts and wireless communication equipment saw significant declines. The booming semiconductor industry is masking weakness in other areas of the economy. Indeed, the manufacturing operation ratio fell from 74.5% in 2015 to 71.9% in 2017, well below its historical average of 80%.
Table 1. Korea’s top export markets and products
A. Percentage of total exports of goods by country
|
2014 on a value-added basis |
2014 |
2015 |
2016 |
2017 |
Change since 2014 |
|
|---|---|---|---|---|---|---|
|
China |
21.7 |
25.4 |
26.0 |
25.1 |
24.8 |
-0.6 |
|
United States |
16.7 |
12.3 |
13.3 |
13.4 |
12.0 |
-0.3 |
|
Vietnam |
1.6 |
3.9 |
5.3 |
6.6 |
8.3 |
4.4 |
|
Hong Kong, China |
0.9 |
4.8 |
5.8 |
6.6 |
6.8 |
2.0 |
|
Japan |
6.7 |
5.6 |
4.9 |
4.9 |
4.7 |
-0.9 |
|
Australia |
1.7 |
1.8 |
2.1 |
1.5 |
3.5 |
1.7 |
|
India |
2.7 |
2.2 |
2.3 |
2.3 |
2.6 |
0.4 |
|
Chinese Taipei |
1.6 |
2.6 |
2.3 |
2.5 |
2.6 |
0.0 |
|
Singapore |
0.6 |
4.1 |
2.8 |
2.5 |
2.0 |
-2.1 |
|
Mexico |
1.5 |
1.9 |
2.1 |
2.0 |
1.9 |
0.0 |
|
Total |
56.8 |
64.6 |
66.7 |
67.4 |
69.2 |
4.6 |
B. Percentage of total exports of goods by product
|
2014 |
2015 |
2016 |
2017 |
Change since 2014 |
|
|---|---|---|---|---|---|
|
Semiconductors |
10.9 |
11.9 |
12.6 |
17.1 |
6.2 |
|
Ships |
7.0 |
7.6 |
6.9 |
7.4 |
0.4 |
|
Cars |
8.5 |
8.6 |
8.1 |
7.3 |
-1.2 |
|
Petroleum products |
8.9 |
6.1 |
5.3 |
6.1 |
-2.8 |
|
Flat displays and sensors |
5.8 |
5.7 |
5.1 |
4.8 |
-1.0 |
|
Car parts |
4.9 |
5.1 |
5.2 |
4.0 |
-0.9 |
|
Wireless communication equipment |
5.2 |
6.2 |
6.0 |
3.9 |
-1.3 |
|
Synthetic resin |
3.8 |
3.5 |
3.5 |
3.6 |
-0.2 |
|
Flat-rolled steel products |
3.3 |
3.1 |
3.1 |
3.2 |
-0.2 |
|
Computers |
1.3 |
1.5 |
1.7 |
1.6 |
0.3 |
|
Total |
59.6 |
59.4 |
57.5 |
58.9 |
-0.7 |
Source: Korea International Trade Association; OECD calculations.
In July 2017, the government introduced a KRW 11 trillion (0.6% of annual GDP) supplementary budget that was nearly as large as the one in 2016. The budget focused on social welfare. Around 70% of the budget was spent in the third quarter of 2017, boosting output growth to 5.7% at a seasonally-adjusted annual rate, the fastest since 2010, in that quarter.
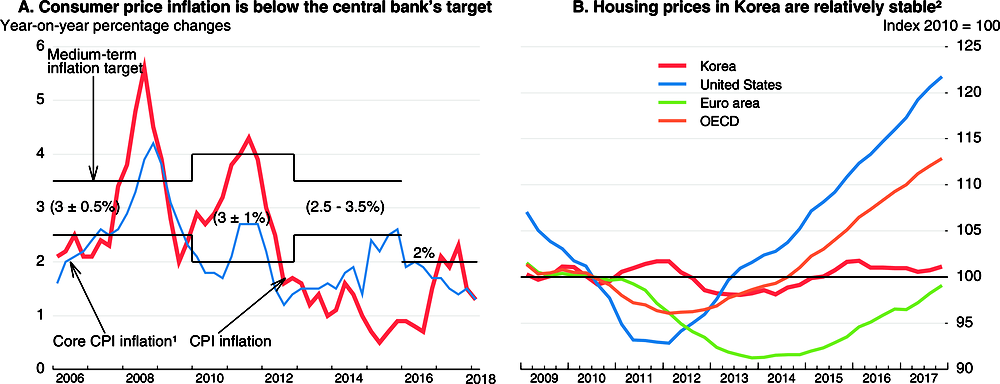
Consumer price inflation has picked up from less than 1% in 2015 and most of 2016 to 1.9% in 2017, close to the Bank of Korea’s 2% inflation target (Figure 5). Inflation was underpinned by higher oil prices and double-digit increases in the price of agricultural products in the summer of 2017 due to weather conditions. Core inflation, which excludes food and energy, remains well below 2%. Housing prices are rising slowly, at less than a 1% annual rate (adjusted for inflation) since the end of 2013, in contrast to sizeable increases elsewhere in the OECD area, including the United States and the euro area (Panel B).
Figure 5. Consumer price inflation has picked up while housing prices are relatively steady
1. Excludes food and energy. The central bank target is for CPI inflation.
2. Adjusted for consumer price inflation.
Source: OECD Economic Outlook: Statistics and Projections (database).
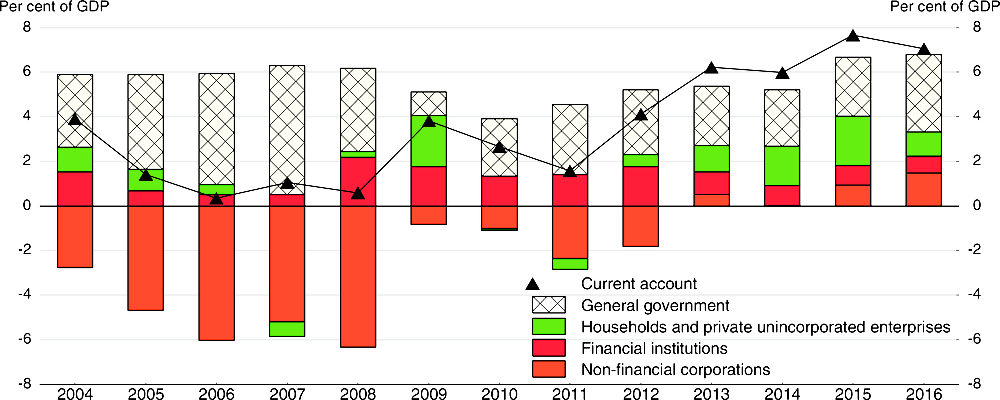
Korea’s current account surplus, at USD 78 billion in 2017, is one of the largest in the world. It jumped from 1.6% of GDP in 2011 to 7.7% in 2015 (Figure 6), before narrowing to 5.1% in 2017. Although large surpluses are less concerning than deficits, they generate large exposures to credit, currency and interest-rate risk (OECD, 2017d).
Figure 6. Korea’s current account surplus is explained by trends in the saving-investment balance
The rise in Korea’s current account surplus from less than 2% of GDP on average over 2001-11 to 6.0% over 2012-17 reflects several factors. First, the saving-investment balance shifted from a deficit to a surplus in the non-financial corporate sector, reflecting a drop in domestic investment as firms have become more cautious. Nevertheless, business investment in Korea as a share of GDP remains one of the highest in the OECD. Second, the saving-investment balance in the household sector has increased, as the large share of the population in their prime saving years prepare for retirement. High household debt is also contributing on this score. Another factor affecting private-sector saving is the drop in oil prices, which contributed to the fall in the oil import bill from 7% of GDP in 2012 to 2.9% in 2016. The rise in oil prices in 2017 contributed to a fall in the current account surplus. Third, the national savings-investment balance is also due to a government surplus – averaging 1.7% of GDP over 2012-17 – reflecting preparation for an aged society and the potential cost of reunification with North Korea (Annex A1).
Korea’s large and persistent current account surplus equals the saving-investment imbalance (Han and Shin, 2016). Policies that boost domestic demand through macroeconomic stimulus and structural reforms would tend to reduce the surplus. In particular, strengthening the social safety net would decrease precautionary saving by households. Such measures would have positive spillovers on the world economy and help reduce global imbalances.
Prospects and risks
Despite the fall in output in the final quarter of 2017, economic growth is projected to remain near 3%, in line with Korea’s potential rate, over 2018-19 (Table 2), as sustained growth of world trade boosts exports. Domestic demand will be slowed by a decline in construction investment, as construction orders have been shrinking (year-on-year) since mid-2017. The sharp drop in housing starts in 2017 and the decline in the provision of land by public institutions for housing implies a marked slowdown in residential construction in 2018-19 (J. Oh, 2017). In addition, loan-to-value and debt-to-income ratios were tightened in August 2017 (Figure 3, Panel C). However, the planned increase in public employment and social welfare spending (see below), as well as achieving the government’s target of raising the minimum wage by 54% by 2022 are expected to support household income and private consumption, offsetting the deceleration in construction investment.
Table 2. Macroeconomic indicators and projections
Annual percentage change unless specified otherwise, volumes at 2010 prices
|
Per cent of 2014 GDP in current prices |
2015 |
2016 |
2017 |
2018 |
2019 |
|
|---|---|---|---|---|---|---|
|
GDP |
100.0 |
2.8 |
2.9 |
3.1 |
3.0 |
3.0 |
|
Private consumption |
50.3 |
2.2 |
2.5 |
2.6 |
2.9 |
2.7 |
|
Government consumption |
15.1 |
3.0 |
4.5 |
3.4 |
6.0 |
3.9 |
|
Gross fixed capital formation |
29.2 |
5.1 |
5.6 |
8.6 |
4.0 |
2.3 |
|
Housing |
4.2 |
18.9 |
20.3 |
14.9 |
4.0 |
0.6 |
|
Business |
20.6 |
2.4 |
1.9 |
7.7 |
1.7 |
2.7 |
|
Government |
4.3 |
4.3 |
7.3 |
5.6 |
3.4 |
2.3 |
|
Final domestic demand |
94.6 |
3.2 |
3.8 |
4.7 |
3.8 |
2.7 |
|
Stockbuilding1 |
0.1 |
0.7 |
0.0 |
0.4 |
0.2 |
0.0 |
|
Total domestic demand |
94.7 |
3.9 |
3.8 |
5.1 |
3.9 |
2.7 |
|
Exports of goods and services |
50.3 |
-0.1 |
2.6 |
1.9 |
3.5 |
4.3 |
|
Imports of goods and services |
45.0 |
2.1 |
4.7 |
7.0 |
5.5 |
3.7 |
|
Net exports1 |
5.3 |
-1.0 |
-0.7 |
-1.7 |
-0.6 |
0.4 |
|
Nominal GDP growth |
5.3 |
5.0 |
5.4 |
4.0 |
5.4 |
|
|
Potential GDP |
3.3 |
3.2 |
3.2 |
3.2 |
3.1 |
|
|
Output gap2 |
-1.1 |
-1.4 |
-1.5 |
-1.7 |
-1.7 |
|
|
Employment |
1.3 |
1.1 |
1.2 |
0.9 |
1.0 |
|
|
Unemployment rate3 |
3.6 |
3.7 |
3.7 |
3.8 |
3.7 |
|
|
GDP deflator |
2.4 |
2.0 |
2.3 |
1.0 |
2.3 |
|
|
Consumer price index (CPI) |
0.7 |
1.0 |
1.9 |
1.6 |
2.0 |
|
|
Core CPI4 |
2.4 |
1.9 |
1.5 |
1.5 |
2.0 |
|
|
Household saving rate5 |
9.3 |
8.7 |
8.9 |
8.9 |
8.9 |
|
|
Export performance |
-1.6 |
0.0 |
-3.7 |
-1.6 |
-0.5 |
|
|
Current account balance6 |
7.7 |
7.0 |
5.1 |
4.0 |
4.5 |
|
|
-3.0 |
-2.4 |
-1.7 |
-1.6 |
-1.8 |
||
|
Central government spending growth8 |
8.1 |
3.6 |
2.9 |
4.6 |
5.7 |
|
|
General government fiscal balance6 |
1.3 |
2.4 |
2.8 |
2.1 |
1.9 |
|
|
1.7 |
2.9 |
3.4 |
2.8 |
2.6 |
||
|
1.7 |
2.6 |
3.0 |
2.2 |
2.1 |
||
|
General government gross debt6 |
45.7 |
45.1 |
44.5 |
44.2 |
44.5 |
|
|
Three-month money market rate |
1.8 |
1.5 |
1.4 |
1.7 |
2.0 |
|
|
Ten-year government bond yield |
2.3 |
1.7 |
2.3 |
2.8 |
3.1 |
1. Contributions to changes in real GDP (percentage of real GDP in previous year).
2. As a percentage of potential GDP.
3. As a percentage of the labour force.
4. Excludes food and energy. The central bank target is for CPI inflation.
5. As a percentage of disposable income.
6. As a percentage of GDP.
7. Consolidated central government budget, excluding the social security surplus, on a GFS basis.
8. Including supplementary budgets. Figures for 2017-19 are the targets in the government’s Medium-term Fiscal Management Plan for 2017-21.
Source: OECD (2018), OECD Economic Outlook, (May), OECD Publishing, Paris.
Korea, the world’s fifth largest oil importer, is affected by the price of oil, which is assumed to rise from USD 54 (Brent) in 2017 to around USD 70 in 2018-19. However, Korea is less vulnerable than in the past thanks to its increased energy efficiency. Indeed, energy intensity (the ratio of energy consumption to real GDP) has fallen by nearly a quarter since 1997. Still, the higher oil price in 2018 could boost consumer price inflation by 0.4 percentage points, though the negative impact on output will be limited by increased demand for Korean exports in oil-exporting countries.
External risks are greater than domestic risks. The dependence on growth in semiconductors and a few other key industries makes the economy vulnerable to shocks. In addition, slower demand from China, Korea’s major trading partner, in the context of China’s on-shoring strategy, could have a negative impact. A broader-based export recovery that extends beyond key industries would reduce the risks to growth. Positive results from government measures to promote innovation would lead to faster output growth. However, a rise in wage costs driven by hikes in the minimum wage, to the extent that they are enforced, could weaken Korea’s competitiveness if not accompanied by productivity gains. Compliance with the minimum wage in Korea has been weak, given lax enforcement and a lack of penalties for violations (OECD, 2016). However, Korea has been strengthening the inspection of firms since 2015 to ensure compliance with the minimum wage. In 2016, the government estimated that 1.1 million employees (7.3% of the total) were paid less than the minimum wage.
Another downside risk is sluggish business investment following the hike in corporate taxes (see below), higher wages that weaken the profitability of smaller firms and the uncertainty created by the government’s pledge to reform the large conglomerates that play a key economic role. The numerous housing-related measures could turn the deceleration of housing investment into a decline. In addition to these risks, Korea’s exposure to large potential shocks remains high (Table 3).
Table 3. Possible shocks to the Korean economy
|
Vulnerability |
Possible outcome |
|---|---|
|
A further run-up in household debt |
Rising household debt in the context of rising interest rates could sharply boost the number of delinquent borrowers, with negative effects on banks’ balance sheets. |
|
Rise in protectionism |
With exports accounting for half of GDP and Korea increasingly prominent in global value chains, increased trade barriers would undermine Korea’s leading industries. |
|
Intensified geo-political tension in the Korean peninsula |
Increasingly stringent sanctions could prompt political unrest in North Korea. Financial market turbulence in South Korea and capital outflows could cause a sharp depreciation of the won and declines in world equity markets. |
Fiscal and financial policies to promote stability and well-being
Fiscal policy has scope to play a bigger role, while preparing for future challenges
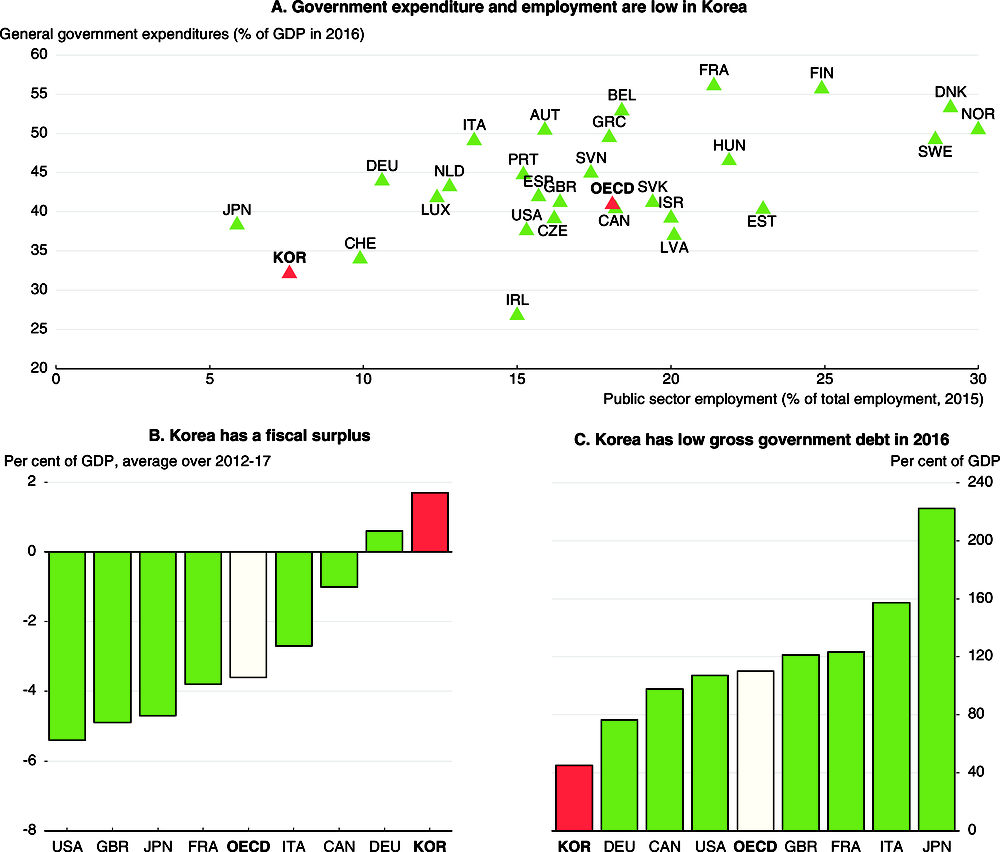
Korea’s fiscal situation stands out in a number of ways, reflecting its adherence to balanced government budgets since the 1980s:
Government expenditure and employment are low and stable: general government spending was 32.4% of GDP in 2016, the same as in 2011 and well below the 40% in the OECD area (Figure 7). Public employment was the second lowest in the OECD at 8% of total employment in 2015.
Korea’s fiscal balance is consistently in surplus: the general government budget has averaged a surplus of 1.7% of GDP since 2012, compared to a 3.6% deficit in the OECD area (Panel B).
Gross government debt is low: at 45.1% of GDP in 2016, Korea’s gross debt was less than half of the 110% average in the OECD (Panel C).
The government is a net creditor: Korea is one of seven OECD countries in which the government holds more assets than liabilities, reflecting the reserves of the National Pension Service (NPS), which have reached 30% of GDP. NPS pension payments amount to only 1% of GDP, given Korea’s young population and the relatively recent establishment of the NPS in 1988.
Figure 7. Government spending, employment and debt are low in Korea
The composition of Korea’s government spending also differs from OECD averages. The share devoted to investment in 2016 was 16%, the highest in the OECD. Budgets have favoured economic activities, which accounted for 16.2% of government expenditures in 2015, compared to 9.3% in the OECD area (Table 4). The high share reflects the government’s active role in industrial policy. While Korea’s spending on education is relatively high, outlays for social protection (20.1% of total spending) are far below the OECD area (32.5%). In addition, health spending is low, reflecting Korea’s young population.
Table 4. Government spending in Korea is relatively large in economic affairs
The ten first-level categories under the International Classification of the Functions of Government in 2015
|
Social protection |
Health |
General public services |
Education |
Economic actvities1 |
Defence |
Public order and safety |
Housing and community amenities |
Recreation, culture and religion |
Environmental protection |
|
|---|---|---|---|---|---|---|---|---|---|---|
|
France |
43.1 |
14.3 |
11.0 |
9.6 |
10.0 |
3.1 |
2.9 |
1.9 |
2.3 |
1.8 |
|
Germany |
43.1 |
16.3 |
13.5 |
9.6 |
7.1 |
2.3 |
3.6 |
0.9 |
2.3 |
1.4 |
|
Italy |
42.5 |
14.1 |
16.6 |
7.9 |
8.1 |
2.4 |
3.7 |
1.2 |
1.5 |
1.9 |
|
Japan |
40.7 |
19.4 |
10.4 |
7.9 |
9.5 |
2.3 |
3.2 |
1.7 |
0.9 |
2.5 |
|
Korea |
20.1 |
12.8 |
15.8 |
16.2 |
16.2 |
7.6 |
4.1 |
2.5 |
2.3 |
2.4 |
|
United Kingdom |
38.4 |
17.8 |
10.6 |
12.0 |
7.1 |
5.0 |
4.7 |
1.1 |
1.5 |
1.8 |
|
United States |
20.8 |
24.2 |
13.8 |
16.2 |
8.7 |
8.8 |
5.4 |
1.4 |
0.7 |
0.0 |
|
OECD |
32.5 |
18.7 |
13.2 |
12.6 |
9.3 |
5.1 |
4.3 |
1.4 |
1.5 |
1.3 |
1. Includes R&D, general economic, commercial and labour affairs and specific sectors, such as agriculture, forestry, fishing and hunting; fuel and energy; mining, manufacturing, construction, transport and communications.
Source: OECD (2017b).
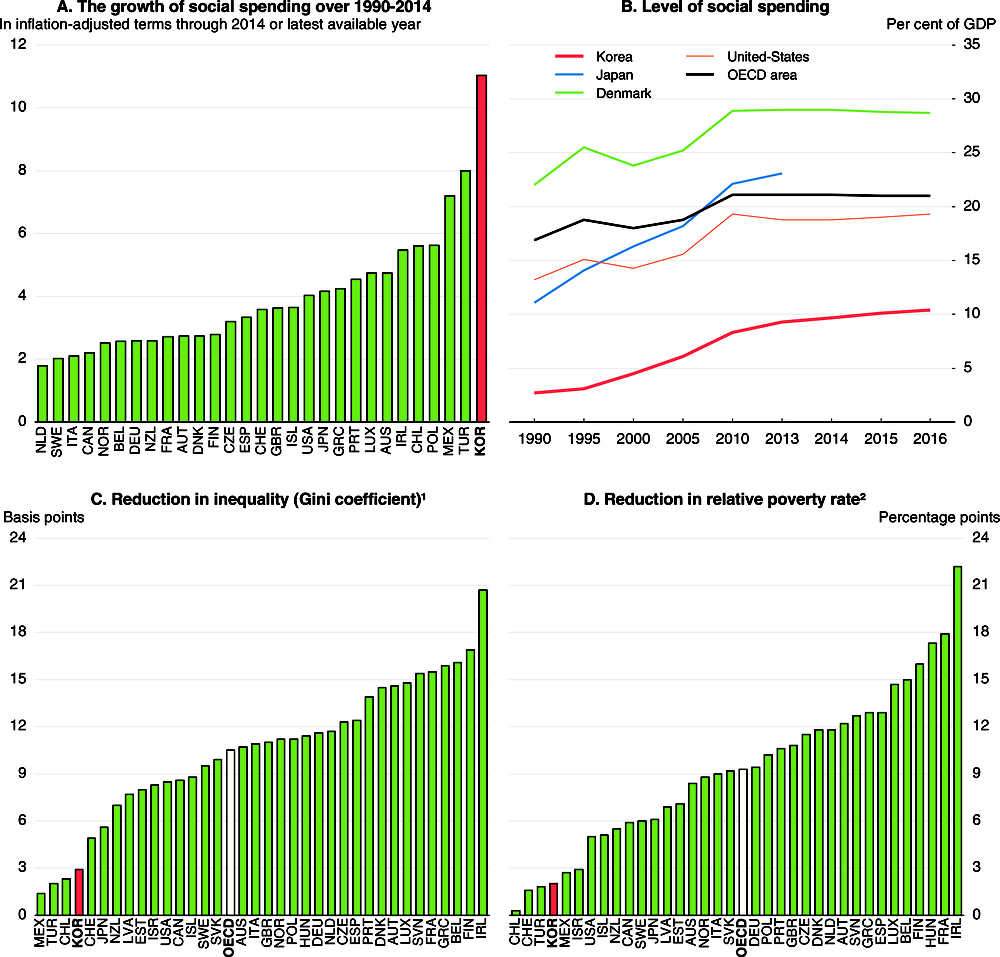
Public social spending has risen at an 11% annual rate (adjusted for inflation) since 1990, the fastest in the OECD area (Figure 8). Still, its share of GDP (10.4%) in 2016 was only half the OECD average (Panel B), in part due to Korea’s relatively young population. Given the low level of social spending, the redistributive impact of the tax and transfer system on income inequality (Panel C) and relative poverty (Panel D) is one of the weakest in the OECD, although it has increased in recent years. Moreover, the progressivity of the tax and benefit system is weak, as a relatively large share of benefits go to middle and high-income households (OECD, 2016).
Figure 8. Public social spending in Korea is rising rapidly from a low base
1. The change in the Gini coefficient after taxes and transfers in 2015 or latest year. The Gini coefficient can range from 0 (perfect equality) to 1 (perfect inequality).
2. The change in the relative poverty rate after taxes and transfers in 2015 or latest year. The relative poverty rate is the percentage of households whose income is less than half of the median income.
Source: OECD Income Distribution and Poverty (database); OECD Social Expenditure Statistics (database).
The 2017-21 Fiscal Management Plan
The government implemented supplementary budgets in 2016 and 2017 to support economic growth (Table 5). In early 2018, it launched another supplementary budget that increases subsidies for SMEs that hire young workers (under age 34) and provides more personal income tax deductions for youths employed by SMEs. The 2017-21 Fiscal Management Plan (Table 6) announced in August 2017 sets spending growth at an annual rate of 5.1% over the five-year period (including the 2017 supplementary budget), compared to a projected annual rise in nominal GDP of 5½ per cent over 2017-19 (Table 2). Allowing government spending to rise as a share of GDP would be appropriate given the upward pressure on spending from population ageing over the medium and long term.
Table 5. Past recommendations on fiscal policy
|
Main recent OECD recommendations |
Action taken since the 2016 Survey or planned |
|---|---|
|
Use fiscal policy to sustain growth in 2016-17, while setting policy in a framework that ensures Korea’s long-run fiscal sustainability. |
Supplementary budgets were implemented in 2016, 2017 and 2018. The 2017-21 Fiscal Management Plan raised spending growth to an average annual rate of 5.1%. |
B. Government fiscal balance and gross debt (as a percentage of GDP)
1. The years 2017 and 2018 are based on budgets passed by the National Assembly (including the supplementary budget). If the 2017 supplementary budget were excluded, the annual growth rates of revenue and spending over 2017-21 would be 5.5% and 5.8%, respectively.
2. Central government. OECD projections, which are on a general government basis, are shown in Table 2.
Source: Ministry of Strategy and Finance.
Korea’s fiscal policy has long aimed to balance the consolidated central government budget excluding the social security surplus. The new Plan falls short of that objective, as it projects that the deficit by that measure will edge up from 1.7% of GDP in 2017 to 2.1% in 2021 (Table 6). However, the overall consolidated central government budget would remain in surplus and gross government debt would remain steady relative to GDP. On a general government basis, the OECD projects that the fiscal surplus will remain around 2% of GDP through 2019 (Table 2). Allowing some narrowing of the surplus by allowing somewhat faster spending growth would help sustain output growth in the face of any shocks.
The new Fiscal Management Plan also shifts spending priorities from economic activities to social welfare. The government has launched four major initiatives that are estimated to cost 178 trillion won (around 2% of annual GDP) over its five-year term, including the plan to increase public employment and social spending (Table 7). Social welfare spending is set to rise at a 9.3% annual rate over 2017-21, boosting its share of total spending to 28.7% (Panel B). Social spending will be boosted in part by new subsidies, such as KRW 100 000 (USD 93) per month for parents with a child up to age five and KRW 300 000 per month for unemployed young people. Expenditures on employment are set to rise at a 14.5% annual rate over 2017-21. Expanding the social safety net would facilitate increased labour market flexibility (see below). In contrast, spending on economic activities will fall. In particular, infrastructure investment is set to drop from 5.5% of total spending to 3.2% over 2017-21 while R&D outlays will decline from 4.9% to 4.0%. While greater social spending is needed to promote inclusive growth, it is important not to neglect spending programmes that support Korea’s growth potential.
Table 7. Spending priorities are shifting from economic affairs to social welfare
A. Spending on major government initiatives (trillion won and per cent)1
|
Initiatives: to be carried out through 100 policy tasks |
Spending over 2018-22 |
Average per year |
Per cent of 2017 GDP |
|---|---|---|---|
|
An economy pursuing co-prosperity: Increase in public employment (810 000 jobs); support subsistence-type businesses; fourth Industrial Revolution; R&D in SMEs |
42.3 |
8.5 |
0.5 |
|
A nation taking responsibility for individual lives: Introduce a child allowance and raise the Basic Pension; improve education; resolve the non-regular worker issue |
77.4 |
15.5 |
0.9 |
|
Well-balanced development across every region: Greater local government autonomy; a system for balanced regional development; stabilise rice price |
7.0 |
1.4 |
0.1 |
|
A Korean peninsula of peace and prosperity: Ability to respond to threats such as North Korea’s nuclear weapons; create new economic map of Korean peninsula |
8.4 |
1.7 |
0.1 |
|
Funding transferred to local government and future projects. |
42.9 |
8.5 |
0.5 |
|
Total |
178.0 |
35.6 |
2.1 |
B. Share of spending by category and average annual growth rate of nominal expenditures, 2017-21
|
2017 |
2018 |
2019 |
2020 |
2021 |
Annual average growth rate over 2017-21 (%) |
|
|---|---|---|---|---|---|---|
|
Social welfare |
25.1 |
26.0 |
27.0 |
27.7 |
28.7 |
9.3 |
|
Employment |
4.6 |
5.5 |
5.6 |
5.9 |
6.3 |
14.5 |
|
Health |
2.6 |
2.5 |
2.6 |
2.6 |
2.6 |
5.8 |
|
Education |
14.3 |
14.3 |
14.3 |
14.3 |
14.3 |
7.0 |
|
Culture, sports and tourism |
1.7 |
1.5 |
1.4 |
1.4 |
1.3 |
-1.0 |
|
R&D |
4.9 |
4.6 |
4.3 |
4.2 |
4.0 |
0.7 |
|
Industry, SMEs and energy |
4.0 |
3.7 |
3.5 |
3.2 |
3.0 |
-1.5 |
|
Infrastructure investment |
5.5 |
4.1 |
3.8 |
3.5 |
3.2 |
-7.5 |
|
Agriculture, forestry, fishery and food |
4.9 |
4.6 |
4.3 |
4.1 |
3.8 |
-0.5 |
|
Environment |
1.7 |
1.6 |
1.5 |
1.4 |
1.3 |
-1.6 |
|
National defence |
10.1 |
10.0 |
10.0 |
10.0 |
10.1 |
5.8 |
|
Diplomacy and reunification |
1.1 |
1.1 |
1.1 |
1.0 |
1.0 |
2.3 |
|
Social order and safety |
4.5 |
4.4 |
4.2 |
4.0 |
3.9 |
1.9 |
|
Public administration and local government |
15.8 |
16.2 |
16.4 |
16.3 |
16.2 |
6.5 |
|
Total expenditure |
100.0 |
100.0 |
100.0 |
100.0 |
100.0 |
5.1 |
1. Spending on these initiatives totalled KRW 81.2 trillion (4.7% of GDP) in 2017. The additional KRW 35.6 trillion spending on average over 2018-22 will be in addition to the base of KRW 81.2 trillion.
Source: Ministry of Strategy and Finance.
Increasing public employment
The new government has set a target of creating 814 000 public-sector jobs by 2021, which would increase public employment by about 34% over four years. Around 340 000 of the jobs are to be in social services, thus supporting the government’s emphasis on social welfare spending. Another 300 000 jobs will be created by shortening working hours in the public sector and direct employment of indirectly hired workers. In addition to new jobs, the government plans to convert 205 000 non-regular workers in the public sector to permanent status. Additional employment should focus on areas where public services fall short of citizen expectations. For example, the share of the public that expressed satisfaction with the education system in 2016 in Korea was the seventh lowest in the OECD area (Figure 9), despite the country’s outstanding performance on the OECD’s PISA test of 15-year-olds. While this reflects some dissatisfaction with standardised teaching methods focusing on rote learning, smaller class sizes could allow a more creative approach tailored to individual student needs. Indeed, average class size at the lower secondary level in Korea in 2015 was the fourth highest in the OECD at 30, well above the OECD average of 23 (OECD, 2017a).
Figure 9. Citizen satisfaction with the education system and the schools is relatively low in Korea
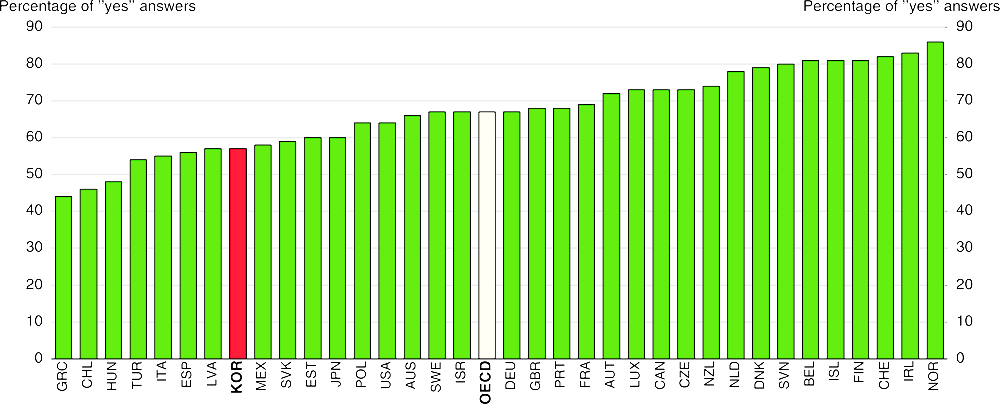
Note: Data refer to the percentage of “yes” answers to the question: “In the city or area where you live, are you satisfied with the educational system or the schools?” in 2016.
Source: OECD (2017b).
Another government objective is to create jobs for young people, as they face greater risk of unemployment. During the second half of 2017, the unemployment rate for the 15 to 24 age group was around 9%, compared to a national rate of 3.4%. In 2016, young people (18-34) accounted for 9% of central government employment, half of the 18% OECD average (OECD, 2017b).
While public employment in Korea is exceptionally low compared to other OECD countries, job creation in the public sector should respond to clearly defined needs. The benefits of the planned 34% increase in public employment should be weighed against the long-term cost. Such an increase could have negative implications for labour shortages, in the context of Korea’s falling working-age population, and wage pressures. The permanent increase in public employment will tend to ratchet up government spending and make it harder to cope with the costs of population ageing. Moreover, expanded public employment should be accompanied by measures to facilitate job creation in the private sector, in part to reduce the serious labour shortages in SMEs (Chapter 2). Addressing the labour market mismatch problem is one priority in this regard (2016 OECD Economic Survey of Korea).
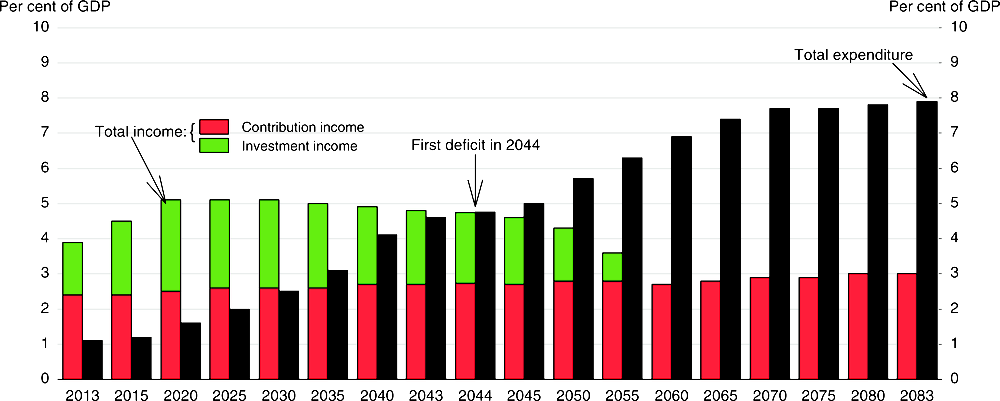
The government projects that under the current framework public social spending will reach 25.8% of GDP by 2060, exceeding the current OECD average of 21% (Figure 8, Panel B). In particular, pension outlays by the NPS are expected to rise by nearly 7% of GDP by 2060 under its current parameters (Figure 10). The large surplus generated by the NPS, currently around 3½ per cent of GDP on a general government basis, is keeping the budget in surplus and building up government assets. The shift in the NPS balance to a deficit of around 4% of GDP by 2060 will have serious implications for fiscal sustainability in Korea. In the absence of revenue increases, rising spending on pensions and health and long-term care would eliminate the government’s net asset surplus, currently around 42% of GDP, by 2040. Government net financial liabilities would rise to close to 200% of GDP by 2060 (Annex A2).
Figure 10. Spending by the public pension system is projected to rise rapidly
Given the long-term fiscal challenges facing Korea, maintaining a sound fiscal position is a priority, which implies raising government revenue in line with expenditures. One way to finance rising spending is to raise the NPS contribution rate, which has remained at 9% since 1998, well below the 20% OECD average. A rate of 14.1% would be sufficient to keep the NPS in balance through 2083, assuming the replacement rate is cut to 40% as planned and the pension eligibility age is hiked from 61 to 65 by 2033. While there is no scope to further reduce the already low replacement rate, the eligibility age could be raised above 65, as in a number of OECD countries. Other revenue sources are needed to finance rising expenditure, notably health and long-term care.
How to finance the growth in public spending
To help finance its four major national agendas, which will cost around 2% of annual GDP over 2018-21, the government announced higher tax rates in August 2017:
The personal income tax rate for those with taxable income exceeding KRW 500 million (USD 463 000) was raised from 40% to 42%, with those in the new bracket of KRW 300-500 million subject to a 40% rate. This change is expected to generate KRW 1.0 trillion (0.06% of GDP) each year.
The corporate income tax (CIT) rate for firms with taxable income above KRW 300 billion (USD 278 million) was raised slightly to 25%. This is expected to generate KRW 2.3 trillion (0.1% of GDP) of revenue each year. Rates for firms earning less are unchanged: 22% on earnings of KRW 20-300 billion, 20% on earnings of KRW 200 million to KRW 20 billion and 10% up to KRW 200 million (USD 185 000).
Given the limited revenue gains from the higher tax rates, the macroeconomic impact will be limited and most of the increased spending will be financed by cutting other expenditures, as noted above.
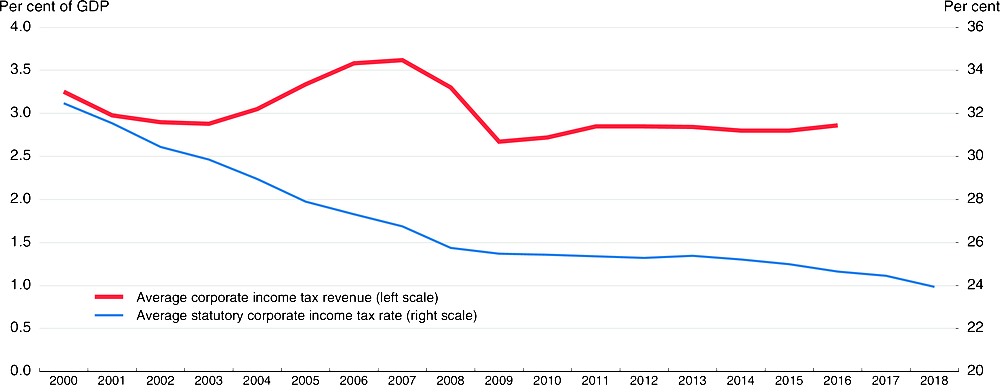
In 2016, Korea’s CIT generated revenue of 3.6% of GDP, exceeding the OECD average of 2.9% (Figure 11). Korea’s CIT tax increase, which seeks to promote more inclusive growth, comes at a time of intensified international competition to lower corporate tax rates. Six OECD countries cut their standard CIT rate in 2016, followed by seven countries in both 2017 and 2018. This continues the downward trend in the average CIT rate in the OECD from 32.5% in 2000 to 23.9% in 2018.
Figure 11. Corporate income tax rates in the OECD area are falling while revenue has stabilised
The international trend of falling CIT rates is a response to weak investment, which also depends on a wide range of other factors (OECD, 2017g). While 25% is close to the OECD average, it is above other Asian economies such as Hong Kong, China (16.5%) and Singapore and Chinese Taipei (both 17.0%). High CIT rates tend to discourage business investment, FDI inflows and firm creation (Brys et al., 2016). An OECD study of 34 member countries over 1980-2014 found that cutting the CIT rate and lowering the tax wedge on personal income boosted output per capita (Akgun et al., 2017). Another OECD study ranked CIT as the most damaging to economic growth compared to taxes on property, goods and services, such as the value-added tax (VAT) (Figure 12), and personal income (OECD, 2010).
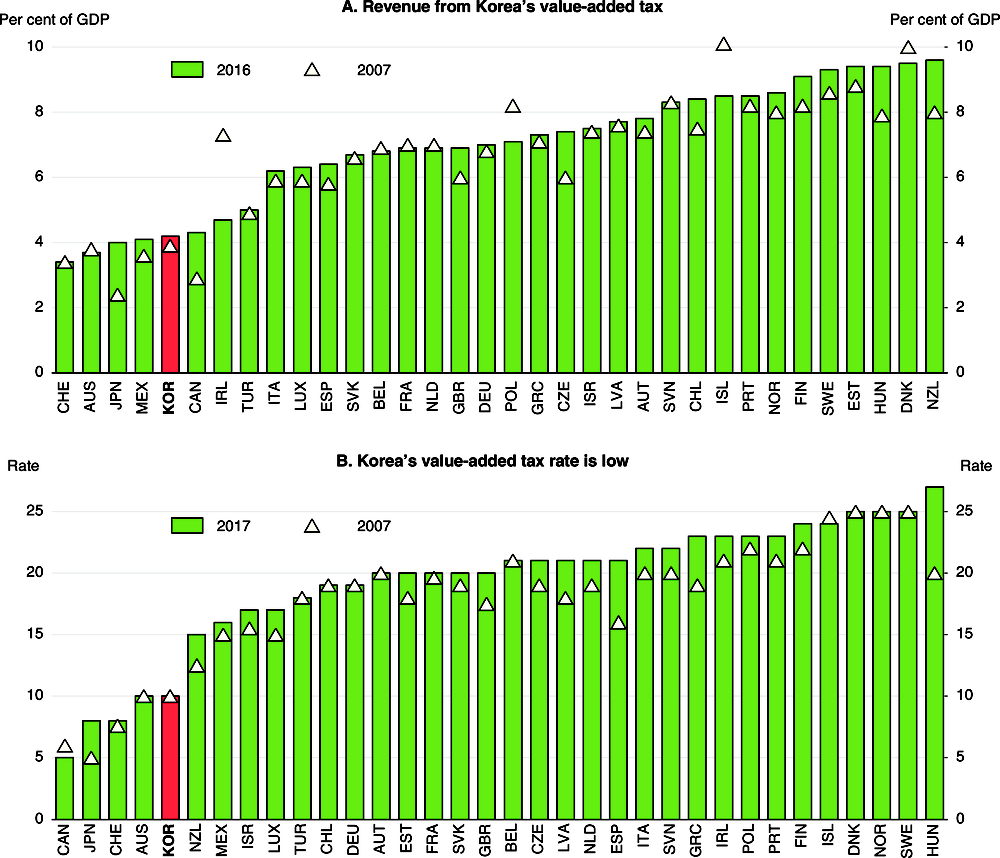
Figure 12. The value-added tax in Korea generates relatively little revenue, reflecting its low rate
The impact of the increase in Korea’s CIT is limited by the fact that it applies only to the largest 77 companies. Nevertheless, they accounted for 30.5% of net profits and 39.0% of CIT paid in 2016. Moreover, it will impact other firms, notably the subcontractors of firms subject to the higher tax, given their generally weak bargaining power relative to large firms (Chang and Woo, 2015). The CIT increase is accompanied by a cut in R&D investment tax credits for large firms. In addition, the tax scheme to encourage large firms to invest and increase wage and dividend payments has been modified. Under an “investment and mutual growth promotion tax system” that took effect in 2018, large firms that do not meet certain thresholds for investment, wage payments and spending aimed at promoting mutual growth with SMEs are subject to a 20% tax on their earnings.
A more efficient way to raise revenue is to increase indirect taxes, notably the VAT (Jones, 2009). While Korea’s CIT revenue is above the OECD average, its VAT revenue was 4% of GDP in 2016, the fifth lowest in the OECD (Figure 12). The average VAT rate in the OECD surpassed 19% in 2017, while Korea’s has remained at 10% since its introduction in 1977, leaving it the fourth lowest in the OECD (Panel B). Countries are increasingly relying on the VAT to make their tax mix more growth friendly and foster job creation.
Although the VAT is often viewed as regressive, this is only true if VAT payments are measured relative to current income. Regressivity may be small if VAT payments are measured relative to lifetime income, as individuals tend to smooth consumption over their lifetime, resulting in a large share of VAT payment when they are young and old and earn less income (OECD/Korea Institute of Public Finance, 2014). Moreover, as noted, the VAT is less detrimental to growth than direct taxes, so the output gains from relying more on a VAT can be used to compensate losers so as to avoid negative distributional effects through targeted measures, including an expanded earned income tax credit. It is important, though, to maintain one standard VAT rate. The VAT is also a stable revenue source and spreads the tax burden across generations.
Monetary and exchange rate policy
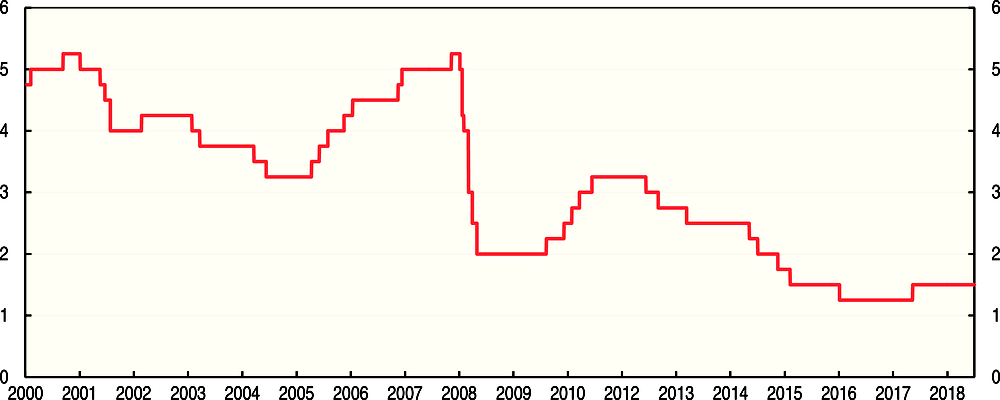
The Bank of Korea’s easing cycle, which began in July 2012, ended in November 2017 when it raised its policy interest rate from a record low 1¼ per cent to 1½ per cent (Figure 13). The hike was based on the view that the global economic recovery is continuing and the domestic economy shows solid growth. In its November statement, the central bank promised to continue to support the recovery of economic growth and to stabilise inflation at the target level over the medium term (Bank of Korea, 2017). Consumer price inflation is running below the 2% inflation target (Figure 5), suggesting that monetary policy accommodation can be withdrawn gradually. As the central bank states, monetary decisions need to take into account risks to financial stability, including those stemming from household debt and capital flows. This also suggests a gradual withdrawal of monetary accommodation to slow the rise in mortgage lending and household debt (see below) and limit interest rate differentials as US monetary policy tightens. The central bank should also take account of the uptick in global inflation pressures and the impact of the large hike in the minimum wage.
Figure 13. Korea’s cycle of monetary easing has ended
The Bank of Korea’s policy interest rate
Monetary policy also needs to take into account exchange rate developments. During the past two years, the won has appreciated by 12% relative to the dollar and 5% in real effective terms (Figure 14). Korea’s foreign exchange policy, which focuses on smoothing excessive volatility, has been classified as “floating” since 2009 by the IMF. Maintaining a flexible exchange rate is essential as a buffer against external shocks.
Figure 14. The won has been relatively stable during the past few years
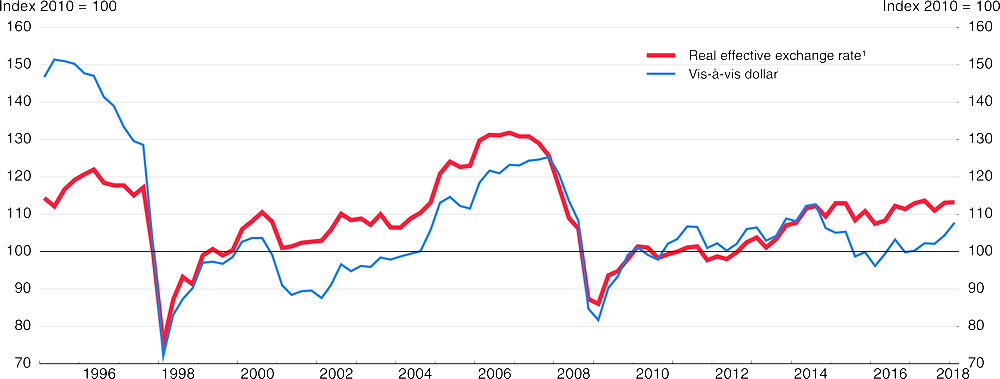
1. Trade-weighted, vis-à-vis 53 trading partners, calculated using consumer prices.
Source: OECD Economic Outlook: Statistics and Projections (database); Bank of Korea.
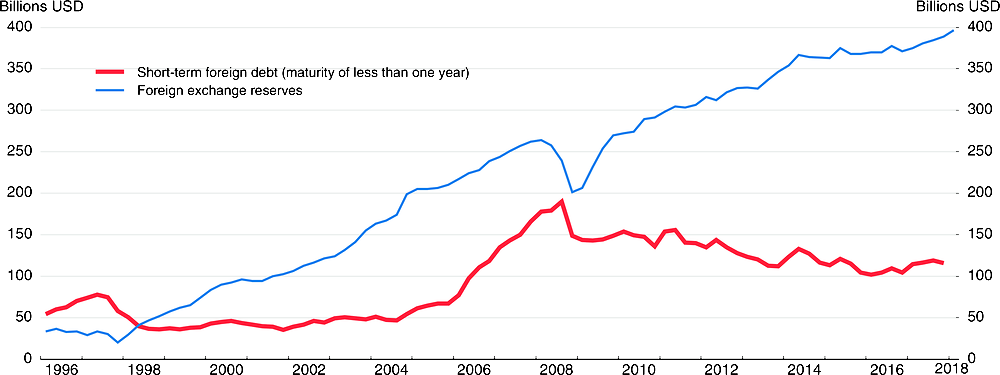
Korea is sensitive to external shocks, which caused capital flight and rapid currency depreciation in 1997 and 2008. However, Korea now appears much more resilient as its short-term foreign debt fell from USD 190 billion in September 2008 to USD 116 billion at end-2017 (Figure 15). Meanwhile, foreign exchange reserves rose from USD 240 billion to USD 397 billion in March 2018, equivalent to 24% of annual GDP, the ninth largest in the world and more than three times short-term foreign debt. This helps protect Korea against future crises and reduces the cost of foreign borrowing. However, reserves also have significant fiscal costs and entail foreign exchange risk. Swap agreements, which played a key role in resolving Korea’s foreign-exchange shortage in 2008, can supplement foreign exchange reserves. Korea maintains swap agreements with a number of countries, including China, Canada, Australia and Switzerland.
Figure 15. Foreign exchange reserves are three times higher than short-term foreign debt
Household debt and financial stability
While government and corporate debt are low by international standards, household debt rose from 124% of net household disposable income in 2002 to 180% in 2016 (Figure 16) and increased further in 2017. The level is well above the 132% OECD average (Panel B), which increased more modestly from 105% in 2002. Faster growth of household debt is associated with a greater probability of banking crises (OECD, 2017c). In Korea, though, the risks are mitigated by a number of factors:
The delinquency rate for household loans by banks fell from 0.8% in 2012 to 0.25% in 2017. With a capital adequacy ratio of 15.4% in September 2017, banks have capacity to absorb an increase in the delinquency rate.
With mortgage debt accounting for 53.2% of household debt in June 2017 (Panel C), rising debt has been accompanied by an increase in household assets.
Around 70% of household debt is held by the top 40% of income earners (Ministry of Strategy and Finance, 2017).
The soundness of mortgage debt has improved with the rise in the share of fixed-rate loans and amortised loans (rather than interest-only loans) to nearly half (Panel D).
Non-banks, accounting for 35.7% of household debt at end-2017, have been subjected to strengthened regulation (e.g. higher capital adequacy requirements for savings banks and provisioning requirements for several categories of institutions).
However, a possible weakening of the debt repayment capacities of some vulnerable borrowers and valuation losses on asset holdings during the phase of rising interest rates is a concern.
The government classifies 54% of household debt as safe (group A in Panel F of Figure 16), as it is held by households with a debt-to-asset ratio of less than 100% and debt service payments of less than 40% of income. For this group, the median debt service payment is 10.3% of income. Around 7% of household debt is held by group C, whose debt-to-asset ratio surpasses 100% and debt service payments exceed 40% of income. Households in group C, with a median debt service payment of 68.6% of their income, are at a high risk of default. Moreover, nearly three-quarters of them have more than one debt. Between these two extremes is group B; households whose debt-to-asset ratio or debt service ratio points to a risk of default. The median debt service payment of group B, which holds the remaining 39% of household debt, is high at 58%. Their financial situation is also precarious in the face of the expected upward trend in interest rates. Achieving the government’s dual objectives of slowing mortgage lending and avoiding a contraction in residential investment is a challenge.
Figure 16. High household debt is a concern in Korea
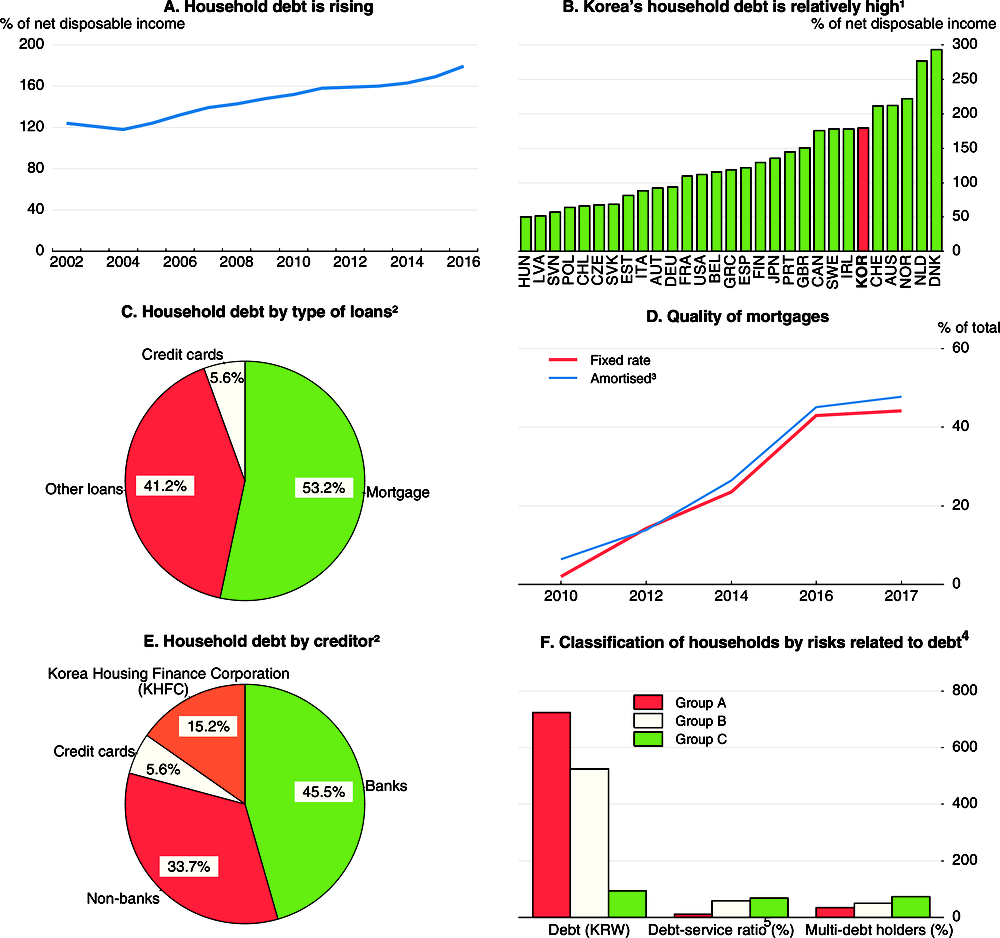
1. In 2016.
2. End-June 2017.
3. Instalment loans gradually reduce the principal outstanding. Most mortgages have been interest only, with the principal paid at maturity.
4. The government classification of households by risk factors related to household debt.
5. Total debt payments (interest and principle) as a share of gross income.
Source: OECD Economic Outlook: Statistics and Projections (database); Ministry of Strategy and Finance; Nomura Global Economics.
The measures to tighten mortgage lending (Figure 3, Panel C) have helped slow the growth of lending to households by depository institutions (banks, mutual credit co‐operatives, savings banks, etc.) from 11.9% at end-2016 to 7.3% at end-2017 (Panel D). In October 2017, the government announced a comprehensive strategy to address household debt. The objective is to slow household debt growth over the next five years to below the 8.2% average over 2005-14. Given that nominal GDP growth is projected to stay around 5%, the government target implies that the ratio of household debt to income will continue to rise.
To achieve its target, the government recently tightened rules on lending to owners of more than one home by changing the debt-to-income rule to include the principal paid on mortgages of existing homes, making it more difficult for owners of multiple homes to receive mortgages. In addition to slowing the growth of household debt, this would further the government goal of preventing house price increases in “speculation areas”. In addition, the government will introduce a new regulation, the “debt-service ratio”, which caps borrowers’ overall debt burden from all of their loans to their income. This regulation will apply to banks beginning in the final quarter of 2018 and be gradually extended to the non-banking sector. Finally, the government expects that its policies to raise household income (see above) will improve households’ ability to repay debt (Ministry of Strategy and Finance, 2017).
Addressing the household debt problem is also critical for social cohesion in Korea, as it excludes a large number of persons from access to credit, making it difficult for them to improve their economic condition (Jones and Kim, 2014). The government strategy includes tailored assistance for households facing debt problems: i) borrowers who pay their debt on schedule but feel financially distressed can apply to have their loans pre-emptively restructured to reduce their debt repayment; ii) the statutory limit on interest rates on overdue interest payments will be reduced to ease the burden on delinquent borrowers and support the recovery of their credit ratings; and iii) for borrowers with no repayment ability, the government will focus on writing off small and long-overdue debt and helping them file for personal rehabilitation or bankruptcy. The measures to assist households that are delinquent in repaying debt will promote more inclusive growth by restoring their access to financial markets. It is important to encourage the take-up of these measures, as some delinquent borrowers prefer to remain delinquent. At the same time, debt restructuring carries a risk of moral hazard.
The increase in credit to the household sector that has fuelled the run-up in household debt is the most serious macro-financial vulnerability in Korea, while credit growth to the corporate sector has been less buoyant (Figure 17). Trends in asset markets are diverging: while price-to-income and price-to-rent ratios for housing have fallen, real stock prices have risen to record highs. Fiscal and external macro-financial vulnerabilities are very low.
Figure 17. Evolution of macro-financial vulnerabilities
Index scale of -1 to 1 from lowest to greatest potential vulnerability, where 0 refers to long-term average, calculated for the period since 2000; the red line is for 2007 and the blue line for 2017Q4
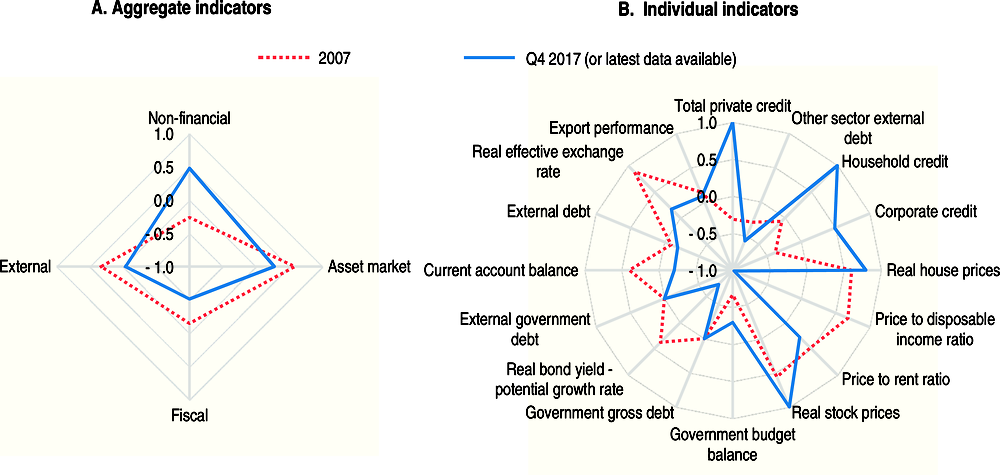
Note: Each aggregate macro-financial vulnerability dimension is calculated by aggregating (simple average) four normalised individual indicators from the OECD Resilience Database. Individual indicators are normalised to range between -1 and 1, where -1 to 0 represents deviations with the observation being below long-term average [positive deviation=>less vulnerability], 0 refers to long-term average and 0 to 1 refers to deviations where the observation is above long-term average [negative deviation=>more vulnerability]. Non-financial dimensions include: total private credit (% of gross national income [GNI]), other sector external debt (% of GNI), household credit (% of GNI), and corporate credit (% of GNI). Asset market dimensions include: real house prices, price-to-income ratio, price-to-rent ratio and real stock prices. Fiscal dimensions include: government budget balance (% of GNI) (inverted), government gross debt (% of GNI), real bond yield – potential growth rate, and external government debt. External dimensions include: current account balance (inverted), external bank debt (% of GNI), real effective exchange rate, and export performance.
Source: Calculations based on OECD Resilience Database.
The hike in the minimum wage
One factor that will influence household income is the hike in the minimum wage, which is set each year by the Minimum Wage Council composed of representatives of workers, employers and the public interest. Korea raised its minimum wage from 29% of the median wage in 2000 to 50%, in 2016, matching the OECD average (Figure 18). In mid-2017, the Council decided to raise it by 16.4% in 2018. If the minimum wage is raised further to KRW 10 000 (USD 9.26), as originally envisaged by the new government, the cumulative increase from its 2017 level would amount to 54%. The increase in the minimum wage is aimed at addressing worsening income inequality, guaranteeing a decent living for low‐income workers and realising income-led growth. The government will provide compensation to firms with less than 30 workers by covering the difference between the 2018 minimum wage hike and the average rise in the minimum wage growth rate over the past five years (7.4%), and subsidising social insurance premiums. In addition, it will provide cuts in credit card fees and reduce the burden of the VAT for small firms to cushion the impact of the minimum wage hike. Companies with 30 or more workers will also be provided with “job stability funds” if they employ certain types of employees, such as security guards or janitors. Overall, the government has prepared 76 compensation measures to cushion the impact of the minimum wage hike. Close monitoring will be required to assess their full effect.
Figure 18. Minimum wage as a percentage of the median wage in 2016
There is some concern that the rapid increase in the minimum wage may be particularly detrimental to weak firms and reduce employment for low-skilled workers. At this point, it is difficult to judge the impact of the minimum wage hike. One study found that a minimum wage hike does not affect overall employment significantly (Lee, 2008). However, a recent study of Korea’s labour market estimated that a 1% increase in the minimum wage would result in a 0.14 percentage-point reduction in the employment rate (Lee and Hwang, 2016).
The increase in the minimum wage is also intended to reduce inequality. A public research institute found that a minimum wage hike was correlated with a decrease in the number of working poor (Yun et al., 2015) and two other studies suggest that a minimum wage hike reduces wage inequality among workers in the middle and low-wage categories, thereby reducing income inequality (Sung, 2014; S. Oh, 2017). However, research by another public research institute shows that measures that target low-income households, such as the earned income tax credit, are more effective in reducing poverty than policies that target low-income workers, such as the minimum wage (Yun, 2016a).
Addressing longer-run challenges to well-being
Korea scores highly on a number of well-being indicators, including education and skills, housing affordability and long-term unemployment, but subjective well-being is well below the OECD average (Figure 19). Moreover, Korea ranks poorly in the categories of income, employment, work-life balance, job stress and perceived health. Well-being could be improved through reforms to remove obstacles to labour participation by women and to break down labour market dualism, which is discussed below. In addition, the high rate of relative poverty among older persons should be addressed. Korea also ranks below the OECD average for environmental quality, which is discussed in the final section.
Figure 19. Well-being indicators suggest room for improvement in Korea
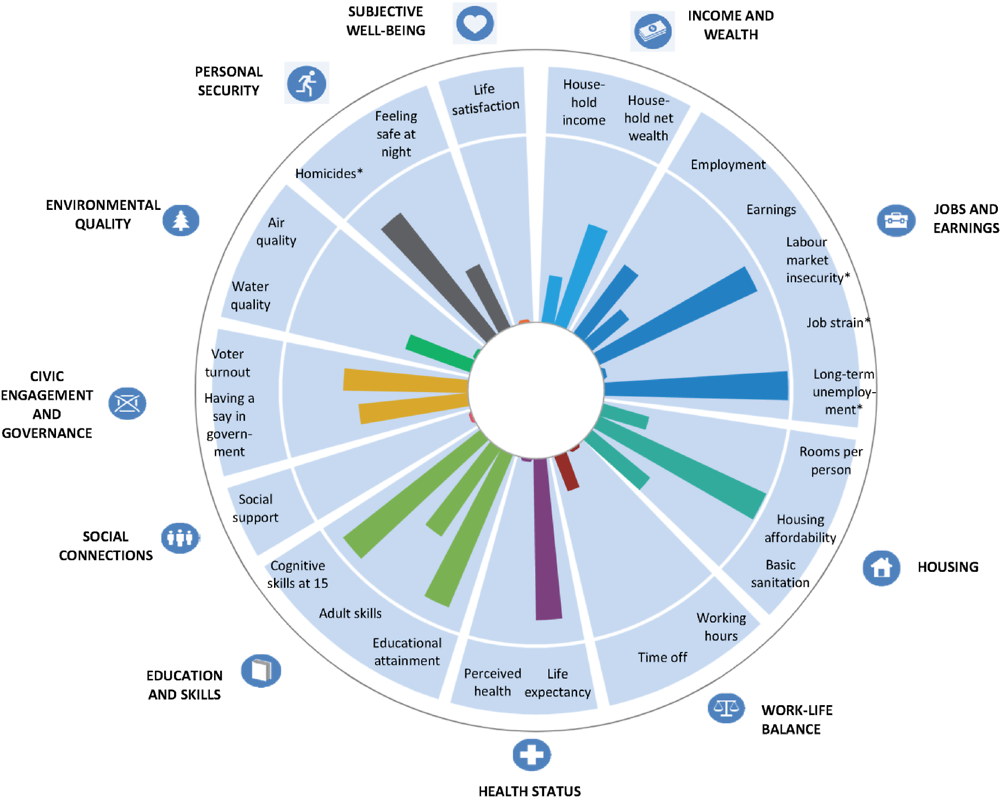
Note: This chart shows Korea’s relative strengths and weaknesses in well-being when compared with other OECD countries. For both positive and negative indicators (such as homicides, marked with an “*”), longer bars always indicate better outcomes (i.e. higher well-being), whereas shorter bars always indicate worse outcomes (i.e. lower well-being).
Source: OECD Better Life Index, www.oecdbetterlifeindex.org.
In addition to improving well-being, achieving inclusive growth requires reducing the large productivity gaps between large firms and SMEs and between the manufacturing and service sectors. Indeed, the dispersion between productivity in firms at the 90th and 50th percentiles in the OECD area is positively correlated with the dispersion in average wage income (Figure 20). The dispersion of productivity in Korea is the second highest in the OECD and the dispersion of wage income is the highest, boosted as well by labour market dualism.
Figure 20. Labour income inequality is positively correlated with productivity disparities between firms
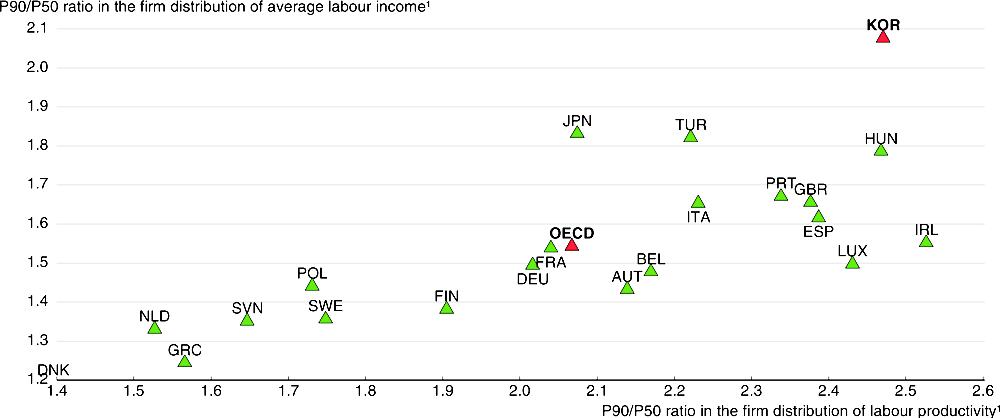
1. This figure compares the labour productivity and labour income at a firm at the 90th percentile to one at the 50th percentile.
Source: OECD (2016).
Expanding employment opportunities for women
Korea’s employment rate rose from 64.6% in 2013 to 66.6% in 2017, approaching the OECD average, though falling short of the 70% target set in 2013 (Table 8). Low employment rates for women and youth are offset by high rates for adults (30-54) and older persons. However, close to a third of older workers are forced to accept involuntary early retirement prior to reaching the statutory retirement age and are thus pushed into self-employment. The employment rate of women in 2016 was 20 percentage points below the employment rate of Korean men, the fourth-largest gap in the OECD, reflecting the large share of women who leave the labour force when they have children. Further advancing gender equality is an important priority.
Table 8. The employment rate in Korea is rising1
|
2000 |
2013 |
2015 |
2016 |
2017 |
2017 target |
Gap |
OECD average (2016) |
|
|---|---|---|---|---|---|---|---|---|
|
Total2 |
61.5 |
64.6 |
65.9 |
66.1 |
66.6 |
70.0 |
-3.4 |
67.0 |
|
Women2 |
50.1 |
54.0 |
55.7 |
56.1 |
56.9 |
61.3 |
-4.4 |
59.4 |
|
Youth (15 to 29) |
43.4 |
39.5 |
41.2 |
41.7 |
42.1 |
46.6 |
-4.5 |
51.4 |
|
Adults (30 to 54) |
73.8 |
76.0 |
77.1 |
77.2 |
77.6 |
81.2 |
-3.6 |
76.9 |
|
Older persons (55 to 64) |
57.9 |
64.3 |
66.0 |
66.2 |
67.5 |
69.3 |
-1.8 |
59.2 |
1. The roadmap to a 70% employment rate was set in 2013. Raising the employment rate is an important objective of the current government, though it no longer focuses on the 70% target.
2. For the working-age population (15-64).
Source: Government of Korea; OECD Employment and Labour Market Statistics (database).
Past Korea Surveys have stressed the importance of expanding maternity and parental leave (Table 9). All women are guaranteed 90 days of paid maternity leave, with all or part of the benefit paid by the Employment Insurance System (EIS). The number of women taking maternity leave edged up from 21% of the number of babies born in 2013 to 22% in 2016 (Figure 21), but remains low due to opposition from firms concerned about filling temporary vacancies (Yoon, 2014). The number of new mothers taking maternity leave is below the share of new mothers who are employed at the time of giving birth (2016 OECD Economic Survey of Korea). Further efforts to ensure the right of all new mothers to take maternity leave, particularly those who are non-regular workers or employed in SMEs, through enhanced enforcement are thus a priority. Expanding the coverage of the EIS would also help.
Table 9. Past recommendations to increase labour force participation
|
Main recent OECD recommendations |
Action taken since the 2016 Survey or planned |
|---|---|
|
Increase the take-up of maternity and parental leave systems by enforcing compliance and raising the benefit level for parental leave. |
The government is linking data on health and employment insurance and investigating firms suspected of not allowing maternity leave. The “paternity leave bonus scheme” was extended in 2016 and the ceiling on support was raised for fathers with more than two children. |
|
Enhance childcare quality by making accreditation mandatory and strengthening competition. |
The government plans to raise the share of children enrolled in public childcare centres (12.1% in 2016) and on-site childcare centres (3.6%) to more than 40% by 2022. A bill to make the evaluation of childcare centres mandatory is pending. |
|
Encourage better work-life balance, in part by expanding flexibility in working hours and reducing them. |
The government aims to reduce annual working hours to 1 800 by cutting the statutory limit on weekly working hours from 68 to 52. Firms that cut working time without reducing wages will get special treatment in government contracts. The government will enact a law to require workers to leave work on schedule and ban weekend work. |
|
Reduce labour market mismatch for young people by expanding Meister schools and the Work-Study Dual System, thereby enhancing links between schools and firms, and basing curriculum on the National Competency Standards (NCS). |
The government aims to increase the share of high school students in vocational schools to 29% by 2022. Their curriculum has been modified to reflect NCS. The Meister School and Work-Study Dual Systems were expanded in 2016-17. |
|
Extend the limit on fixed-term contracts from two years to four. |
No action taken or planned. |
|
Increase the coverage and the generosity of the Earned Income Tax Credit to reduce poverty and strengthen work incentives. |
The ceiling on EITC payments has been raised from KRW 2.1 million per year to KRW 2.5 million (USD 2 240). Eligibility criteria were eased by allowing single persons in their 30s to receive the EITC and raising the limit on assets from KRW 140 million to KRW 200 million. |
Since 2011, parents in two-income households are each entitled to one year of leave or reduced working time. The share of parents taking the leave rose from 16% to 22% over 2013-16. The increase was driven by fathers, who accounted for 8.5% of the total number of parents taking leave in 2016, compared to only 3.3% in 2013, reflecting the “paternity leave bonus scheme” introduced in 2014.
Figure 21. Trends in maternity and parental leave
As a per cent of the number of births each year
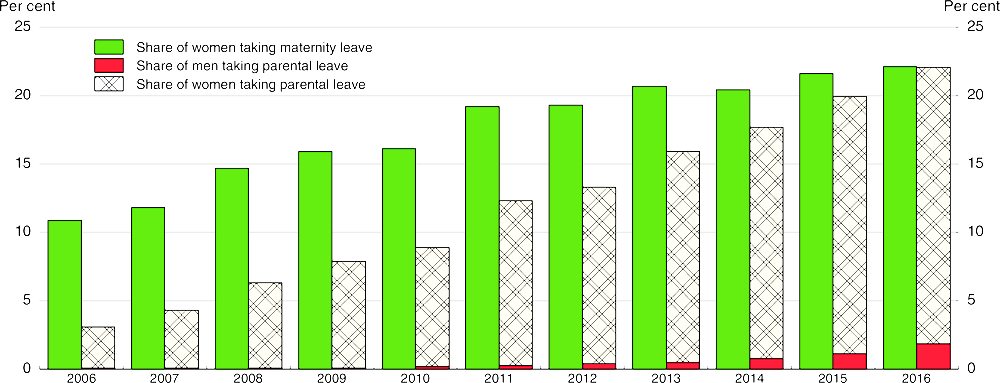
Note: Workers on maternity or childcare leave exclude public officials, teachers and other workers not belonging to the Employment Insurance System.
Source: Ministry of Employment and Labour; Statistics Korea.
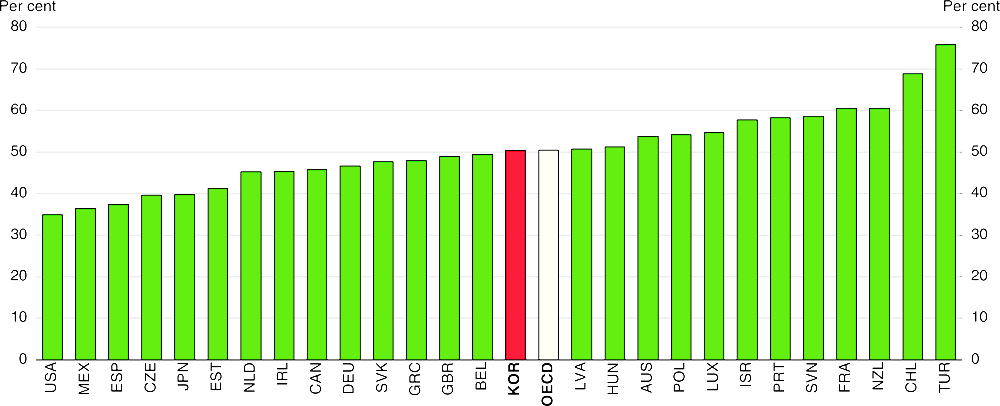
The withdrawal of women from the labour force following childbirth lasts about ten years on average (Hong and Lee, 2014). In 2016, the median female wage was 37% below the male median, a small improvement from 2000 when it was 40% below. Korea’s gender wage gap, the largest in the OECD area, is far above the 14% OECD average (Figure 22). Given the close link between seniority and wages, any absence from the labour market has a strong impact on earnings. The gender wage gap for young women (aged 25-29) is close to the OECD average of around 10%, but reaches 42%, for the 40-44 age group, compared to the OECD average of 24%. The gap is also explained by women’s concentration in low-paid non-regular jobs and under-representation in high-level positions. In the central government, women accounted for only 6% of senior management positions in 2015, far below the OECD average of 32% (Panel B).
Figure 22. Korean women face low wages and hold few managerial positions
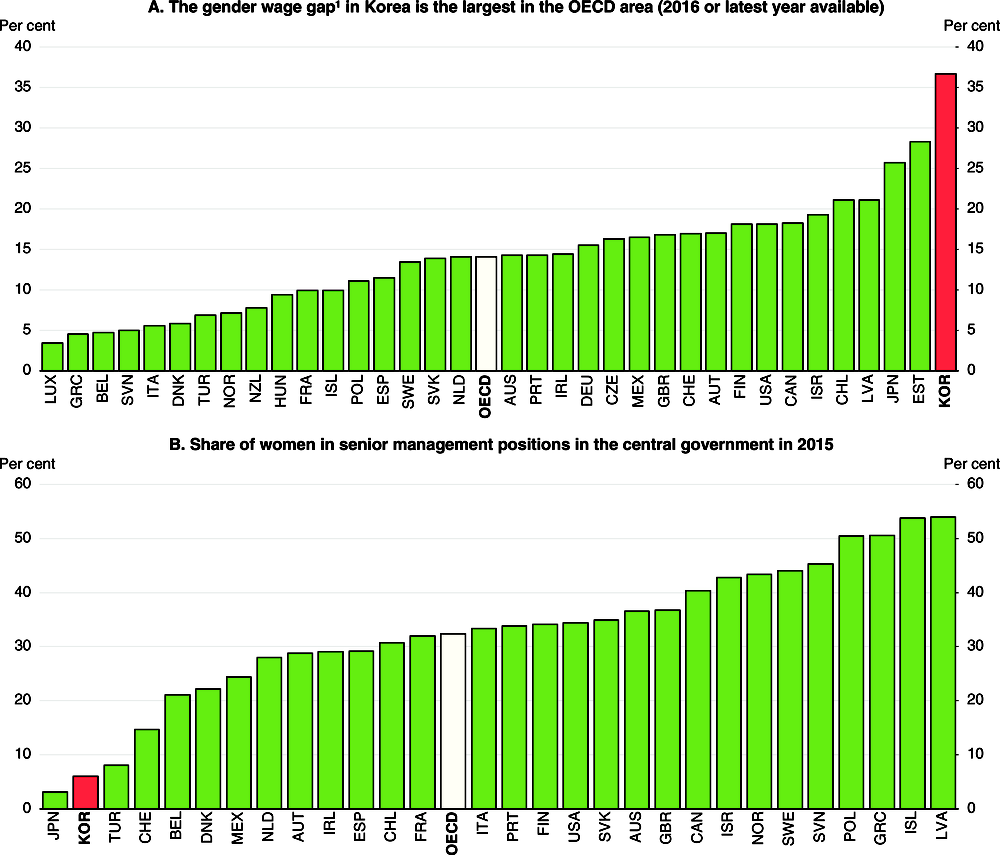
1. The difference between median earnings of men and women relative to median earnings of men, full-time employees.
Source: OECD Earnings Distribution (database).
The large gender wage gap discourages women, particularly those with higher education, from working. Indeed, the employment rate of women with a tertiary education is the lowest in the OECD, while the rate of those with less than a high school education is above the OECD average. Reforming the wage system to emphasise performance and job categories – rather than seniority – would narrow the gender wage gap.
Working time in Korea was the second longest in the OECD in 2016 at 2 052 hours per year, 20% above the OECD average, with adverse implications for labour participation, the quality of life, the fertility rate and productivity. Korea’s labour inputs (relative to population) are the second highest in the OECD while labour productivity per hour of work is 46% below the top half of the OECD (Figure 23). The reduction in the standard workweek from 44 hours to 40 over 2004-11 was estimated to increase annual output per worker by 1.5% at manufacturing firms due to improved efficiency of production processes, implying that working hours were inefficiently long before the reduction (Park and Park, 2016).
Figure 23. Korea has low productivity and high labour inputs
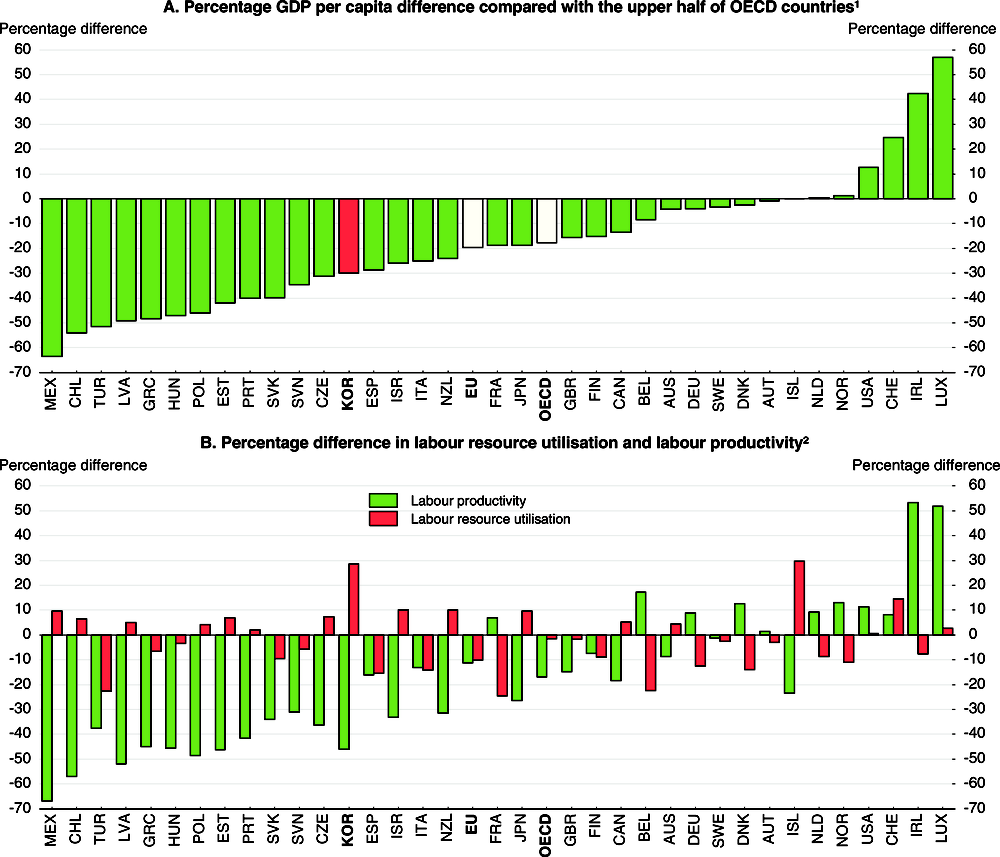
1. In 2016. Compared to the weighted average using population weights of the 17 OECD countries with the highest GDP per capita based on purchasing power parities (PPPs).
2. In 2016. Labour resource utilisation is measured as the total number of hours worked per capita.
Source: OECD National Accounts Statistics (database); OECD Productivity Statistics (database); OECD Employment and Labour Market Statistics (database); OECD Economic Outlook: Statistics and Projections (database).
The government aims to reduce working time to around 1 800 hours per year by 2022, which requires addressing the underlying causes of long hours. First, firms prefer to meet increased demand through overtime and hiring non-regular employees to avoid the high costs of dismissing regular workers. Second, workers are attracted by the 50% wage premium for overtime. Reducing the premium would likely reduce working hours. Working time is longest in SMEs, which face labour shortages, making it important to resolve the labour mismatch problem (see below). In sum, the tradition of long working hours should be replaced by a productive work culture.
Reducing the gender-wage gap, reducing working hours and ensuring the rights of all women to take maternity leave and parents to take parental leave are essential for inclusive growth. Expanding female employment would also help offset the impact of population ageing, which is projected to be the fastest in the OECD (Figure 24), reflecting the extraordinarily low fertility rate and longer life expectancy. If participation rates were to remain at their current levels for each age group and gender, the labour force would peak at 27.9 million in 2022 and then fall by 20%, to around 22.2 million, by mid-century (Panel B). In contrast, if the female participation rate for each age cohort were to rise to the rate for men by 2050, the labour force would only fall to 26.0 million, 17% higher than in the case of unchanged participation rates. Greater labour force participation by women and older persons (see below) would help support growth potential.
Figure 24. Korea’s population ageing will be the fastest in the OECD, leading to a shrinking labour force
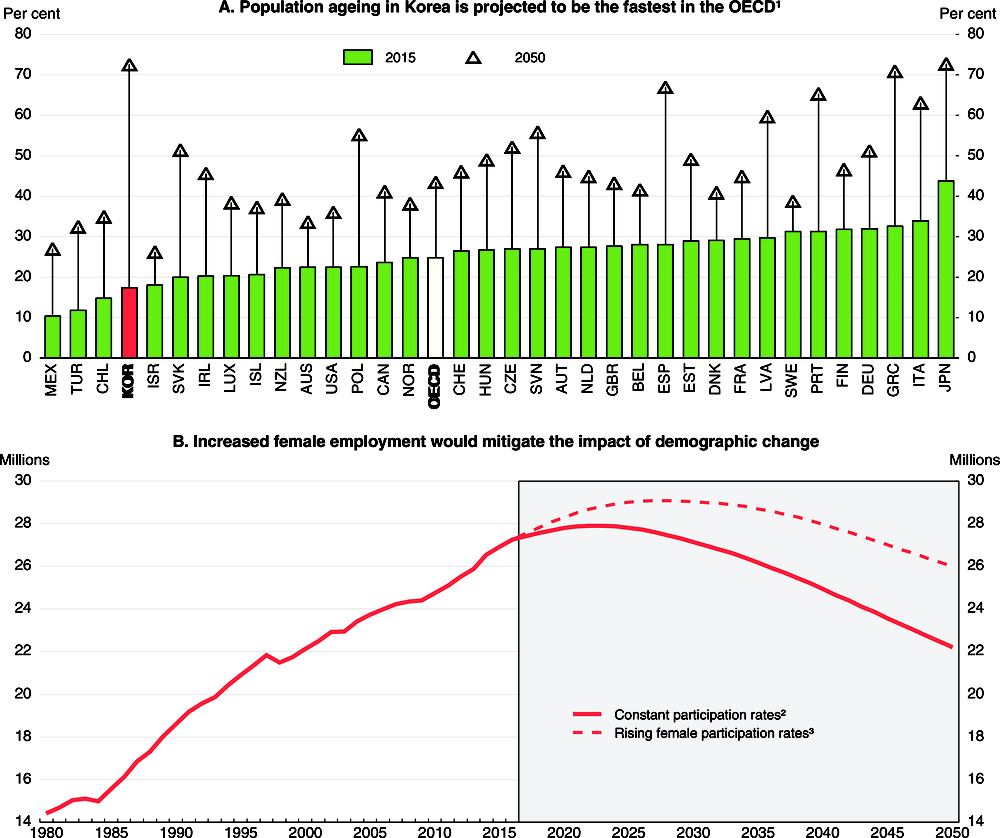
1. Population aged 65 and over as a per cent of the population aged 15 to 64.
2. The participation rates for men and women are assumed to remain at their current levels for each age group.
3. Female participation rates are assumed to reach current male rates in each age group by 2050.
Source: Statistics Korea, Population Projection for Korea (2015) and Economically Active Population Survey; OECD Demography and Population (database); OECD calculations.
Breaking down labour market dualism
Korea’s labour market is segmented between regular workers and non-regular workers, such as fixed-term, part-time and dispatched workers, who account for one-third of employees (Table 10). Non-regular workers earn one-third less than regular workers on an hourly basis, even though the skills of temporary workers match those of permanent prime-age workers on average (OECD, 2016). Dualism has a number of negative consequences:
It is a major source of income inequality and poverty. Wage dispersion in Korea is the second highest in the OECD and almost a quarter of full-time workers in 2016 earned less than two-thirds of the median wage (Figure 25).
Dualism is an important cause of gender inequality, as 41.1% of female employees were non-regular in 2016 compared to only 26.4% for men (Figure 26).
The income gap is further widened as non-regular workers have less access to social insurance and company-based benefits (Table 11).
Dualism increases temporary employment, thereby discouraging firm-based training. The share of temporary employees was 22% in 2016, the fifth highest in the OECD and more than double the OECD average. Non-regular workers, a third of employees, are offered only 1.8% of the training opportunities provided via employers (Yun, 2016b).
The segmentation between regular and non-regular employment limits social mobility. Temporary and part-time workers in Korea are less likely to move to a regular job during the following year than unemployed people with similar characteristics (OECD, 2015a), reflecting the stigma of non-regular employment.
Dualism has important equity implications for future generations, as spending on education in non-regular households is only about half of that of regular households (2016 OECD Economic Survey of Korea).
Table 10. Non-regular workers account for about a third of employees and earn much less
A. Employed persons by status
|
Year |
Wage workers |
Non-regular workers |
Of which1 |
||||||
|---|---|---|---|---|---|---|---|---|---|
|
Contingent (temporary) workers |
Part-time workers |
Atypical workers |
|||||||
|
Fixed-term workers |
Open-ended contract workers2 |
Dispatched |
Others |
||||||
|
Thousand |
Thousand |
% |
Thousand |
% |
% |
% |
% |
% |
|
|
2007 |
15 882 |
5 703 |
35.9 |
2 531 |
44.4 |
17.8 |
21.1 |
3.1 |
35.7 |
|
2009 |
16 479 |
5 754 |
34.9 |
2 815 |
48.9 |
12.0 |
24.8 |
2.9 |
36.8 |
|
2011 |
17 510 |
5 995 |
34.2 |
2 668 |
44.5 |
12.9 |
28.4 |
3.3 |
37.2 |
|
2014 |
18 776 |
6 077 |
32.4 |
2 749 |
45.2 |
12.5 |
33.4 |
3.2 |
31.6 |
|
2016 |
19 627 |
6 444 |
32.8 |
2 930 |
45.5 |
11.3 |
38.5 |
3.1 |
31.4 |
|
2017 |
19 883 |
6 542 |
32.9 |
2 925 |
44.7 |
12.0 |
40.7 |
2.8 |
29.2 |
B. Hourly wages of non-regular workers relative to regular workers (regular workers = 100)
|
Year |
Regular workers |
Non-regular workers |
Of which1 |
||||
|---|---|---|---|---|---|---|---|
|
Contingent (temporary) workers |
Part-time workers |
Atypical workers |
|||||
|
Fixed-term workers |
Open-ended contract workers2 |
Dispatched |
Others |
||||
|
2007 |
100.0 |
56.5 |
64.4 |
58.0 |
47.1 |
46.9 |
n.a. |
|
2009 |
100.0 |
56.3 |
65.5 |
53.2 |
46.8 |
47.9 |
n.a. |
|
2011 |
100.0 |
61.3 |
69.4 |
51.8 |
53.9 |
51.9 |
n.a. |
|
2014 |
100.0 |
62.2 |
64.4 |
53.8 |
63.0 |
49.7 |
n.a. |
|
2016 |
100.0 |
66.3 |
66.0 |
49.2 |
61.9 |
52.2 |
n.a. |
1. The sum of the categories of non-regular workers exceeds 100% due to double-counting.
2. Workers whose employment contract term is not fixed but whose employment can continue through repeated renewals of the contract or is not expected to continue due to involuntary reasons.
Source: Statistics Korea; Ministry of Employment and Labour.
In addition to promoting social inclusion, enhancing labour market flexibility would boost economic growth by helping Korea achieve the fourth industrial revolution (Chapter 2). Moreover, employment protection reduces FDI inflows and the expansion of foreign firms in Korea (Cho, 2016). Relaxing employment protection has been found to result in greater job reallocation across sectors, which leads to higher productivity (Cournède et al., 2016).
The emphasis on protecting jobs has failed to deliver employment stability and income security for a large share of the labour force. Breaking down dualism requires reducing incentives that encourage firms to hire non-regular workers: i) enhancing employment flexibility and avoiding the cost of laying off regular workers; and ii) reducing labour costs. Hiring a non-regular worker cuts a firm’s social contributions by 8-9% compared to a regular worker covered by the three major social insurance programmes. Past Korea Surveys have recommended a comprehensive strategy to break down dualism by relaxing employment protection for regular workers and making it more transparent and increasing social insurance coverage and training for non-regular workers (Table 12).
Figure 25. Korea has wide wage dispersion and a high share of low-wage workers
In 2016 or latest year available1
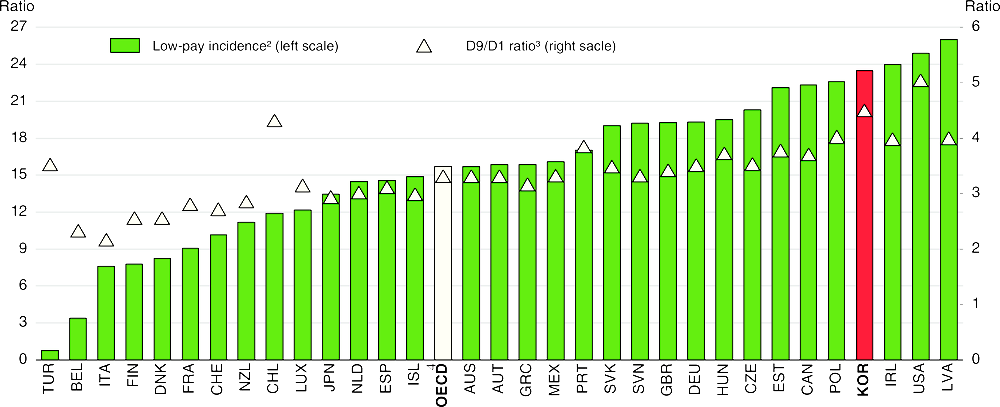
1. Includes only those countries for which both indicators are available.
2. The share of full-time workers earning less than two-thirds of median earnings, including bonuses.
3. The ratio of the upper bound value of the 9th decile to the upper bound value of the 1st decile for full-time workers.
4. Unweighted average of the countries shown above.
Source: OECD Earnings Distribution (database).
Figure 26. Women are concentrated in low-paying non-regular jobs
Employees by employment status as a percentage of total employment in 2017
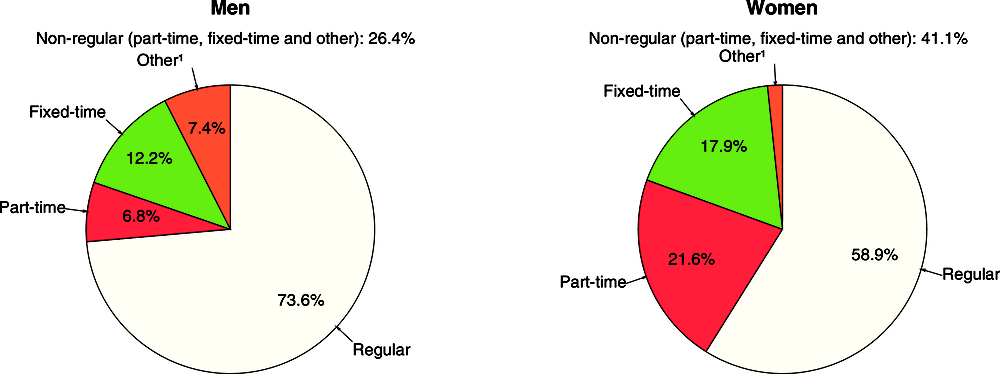
1. Includes temporary employees and atypical workers (dispatched, daily on-call, in-house, independent contractors, etc.).
Source: Statistics Korea, Economically Active Population Survey, August 2017.
Table 11. Non-regular workers receive less social insurance and company-based benefits
Employed persons by status in 2016
|
National Pension Service |
National Health Insurance |
Employment Insurance System |
Average for social insurance1 |
Bonus payments2 |
Retirement allowance3 |
|
|---|---|---|---|---|---|---|
|
Total |
90.1 |
89.7 |
90.7 |
90.2 |
55.3 |
81.2 |
|
Regular |
98.2 |
98.3 |
95.7 |
97.4 |
65.8 |
93.1 |
|
Non-regular |
56.7 |
59.4 |
72.1 |
62.7 |
22.9 |
45.1 |
|
of which: |
||||||
|
Part-time |
63.7 |
65.6 |
69.0 |
66.1 |
19.3 |
33.3 |
|
Atypical |
32.7 |
37.3 |
67.4 |
45.8 |
8.8 |
33.6 |
1. The simple average for the National Pension Service, National Health Insurance and the Employment Insurance System.
2. Bonus payments, which are paid two or three times a year, amount to around a quarter of employee compensation.
3. In 2014. The law requires payment of at least one month of wages for each year worked for departing employees.
Source: Ministry of Employment and Labour, Survey on Labour Conditions by Employment Type (2016).
Table 12. Past recommendations to break down labour market dualism
|
Main recent OECD recommendations |
Action taken since the 2016 Survey or planned |
|---|---|
|
Break down dualism by relaxing employment protection for regular workers and making it more transparent and increasing social insurance coverage and training for non-regular workers. |
|
Breaking down dualism requires reducing employment protection for regular workers (OECD, 2013a). Regular workers receive high protection, particularly in large firms, as a result of labour laws, court decisions, business practices, social customs and labour unions (Koh et al., 2010). Dismissals for economic reasons are strongly regulated, with many procedural hurdles for firms: consultations with workers, implementation of measures to avoid or minimise layoffs, and strict selection criteria for employees to be dismissed (Lee, 2015). In addition, there must be “urgent managerial reasons”, a criterion that is not well-defined and difficult to prove in court. Courts take into account the company’s financial situation, market conditions and competitiveness. Therefore, layoff costs, which are difficult to predict, can be very high due to long and complex court rulings, thus increasing the incentives to hire non-regular workers (OECD, 2016). In 2017, Korea was ranked at 106th in the world in labour market flexibility and 112th in the cost of redundancy by the Global Competitive Index (World Economic Forum, 2017).
Reforms that reduce employment protection have long been known to boost productivity, but that has not made them popular or easy to implement (Cournède et al., 2016). Several European countries have tried to move toward a single employment contract. Another option is to introduce reduced employment protection for new employees, while current employees retain their protection under a grandfather clause. Such an approach appears to have been successful in some southern European countries. Another approach, epitomised by Denmark, is “flexicurity”, which combines employment flexibility, social welfare and active labour market policy. In any case, a shift from protecting jobs to protecting individuals requires strengthening the social safety net. As noted above, social spending in Korea is low and has a relatively weak impact on income inequality and relative poverty (Figure 8). The major programmes for the working-age population should be improved:
Employment insurance: Only about a third of the unemployed receive benefits. The lower coverage of non-regular workers (72.1%) is problematic, given their precarious jobs (Table 11).
The earned income tax credit: Coverage is limited to around 8% of households, in part due to eligibility criteria, and spending was 0.1% of GDP in 2015.
Basic Livelihood Security Programme: This programme, the primary public assistance policy, targets the extremely poor. The maximum support was equivalent to 28% of the median income in 2015, putting it in the bottom third of OECD countries, while coverage is limited to around 3% of the population by strict eligibility criteria.
Addressing the problems of older workers and the elderly
Extending the employment of older workers
The employment rate in Korea for the 55-64 age group was 67.5% in 2017, well above the OECD average of 59.2% (Table 8). Yet the poverty rate doubles from 6% for the 41-50 age group to 13% for the 51-65 age group, compared to an OECD average of 10% (Figure 27). The main problem, therefore, is the quality of jobs for older workers. Prior to 2016, the mandatory retirement age set by firms was 58 on average. It was much lower in practice, at an average of 46 for those who left their main job voluntarily and 53 for those who left involuntarily, according to a 2016 government survey of 6.9 million persons between the ages of 55 and 64. Low education and skills, combined with seniority-based pay, creates a significant gap between wages and productivity as workers age, leading to early retirement. Many become self-employed, contributing to low service-sector productivity. Those who find employment tend to have temporary contracts and low wages.
Figure 27. Relative poverty rates for persons over 50 are very high in Korea
In 20151
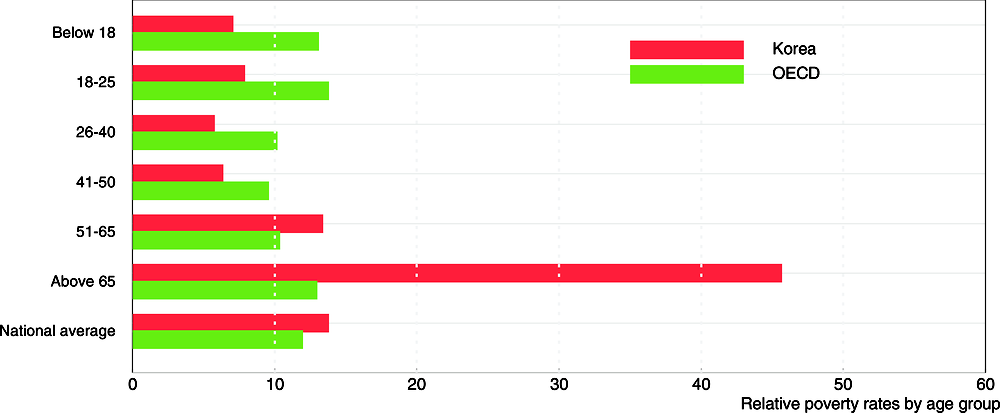
1. Relative poverty is measured as those with an income below half of the national median, not taking into account household assets and liabilities.
Source: OECD Income Distribution and Poverty (database).
In 2016-17, the minimum mandatory retirement age that firms can set was raised to 60. However, some companies continue to force workers to leave before age 60 through “honorary retirement”. The government plans to take measures to prevent the abuse of voluntary retirement and other issues related to the termination of employment contracts.
However, the higher retirement age will further widen the gap between productivity and wages. Resolving this problem will require enhancing wage flexibility by moving away from seniority-based wages. Past Korea Surveys have recommended the “wage peak” system, which freezes or gradually reduces wages during workers’ last few years prior to the mandatory retirement age (Table 13). This is a win-win approach that reduces the burden on firms, while extending careers of workers. The share of firms with a wage peak system rose from 9% in 2009 to 17.5% in 2016 in the face of opposition by some workers who prefer seniority-based wages. The ultimate objective should be a flexible wage system based on performance and job category, while abolishing firms’ right to set mandatory retirement ages.
Table 13. Past recommendations to extend employment and reduce poverty among the elderly
|
Main recent OECD recommendations |
Action taken since the 2016 Survey or planned |
|---|---|
|
Accelerate the adoption of the wage peak system and expand education for older persons with low skills to extend their careers at companies. |
The government is expanding training programmes aimed at older workers. Subsidies for reduced working hours were expanded to cover education and training for older workers. |
|
Focus the Basic Pension on the elderly with the lowest incomes to reduce the high rate of poverty among those over age 65. |
The government plans to raise the Basic Pension from KRW 200 000 to KRW 300 000 (USD 278) per month, while keeping its broad coverage. |
|
Expand the coverage of the National Pension Service (NPS) to reduce poverty in the long run. |
The government: i) allowed insured persons who take a career break due to childbirth or childcare to make deferred NPS contributions; ii) introduced subsidies of 75% for NPS contributions paid by the unemployed; and iii) introduced a subsidy of 90% (80%) of NPS contributions for newly-insured employees at firms with less than five (five to nine) workers. |
|
Expand company pensions and strengthen personal pension plans – the Individual Retirement Pension (IRP) – to create a strong multi-pillar system to ensure adequate income for the elderly. |
Expanded the eligibility for IRP to include self-employed individuals and public officials. Capital gains tax on stock investment in IRP was exempted beginning in 2018. Property taxes for reverse mortgages were cut by 25%. |
The concentration of older workers in low-quality jobs reflects their lack of education and skills compared to younger people (Figure 28). Increasing the human capital of older workers by investing in lifelong learning would help bring wages and productivity into line and reduce the incentives for firms to force early retirement. In Korea, only 21% of the 55-64 age group participated in formal or non-formal education or training related to their job in 2012, compared to the 30% OECD average (2016 OECD Economic Survey of Korea). The goal should be to create a virtuous circle between lifelong learning, productivity and earnings. In addition, it is essential to break down labour market dualism, which forces older workers into non-regular status, and to reduce working time to enable workers to continue their careers.
Figure 28. The education and skill gap between younger and older workers is large in Korea
Reducing poverty among the elderly
Longer careers at their main jobs would reduce poverty among older persons, both while they are working and after retirement, in part by lengthening their pension contribution period. However, more needs to be done to reduce the elderly poverty rate, which was 45.7% in 2015 for the over-65 age group, 3.6-times higher than the OECD average of 12.6% (Figure 27). Their absolute poverty rate – the share with an income below the minimum cost of living – is around 30%. In addition to low incomes, the elderly are burdened by high debt. For the over 60 age group, household debt amounted to 73% of their financial assets, compared to the national ratio of 64% and a ratio of 20% in the United States (Kim, 2016). Poverty contributed to a high elderly suicide rate, which was 55 per 100 000 persons in 2014, far exceeding the OECD average of 22.
Many elderly had assumed that their children would provide for them, thus making it unnecessary to prepare financially. However, a quarter of the elderly are living alone. The high elderly poverty rate reflects both the decline in family support and the weakness of other private and public sources of support:
The NPS provided old-age pension benefits to only 33.8% of the elderly in 2017. Moreover, pension benefits were low at 23.5% of the average wage.
The Basic Pension, which was doubled to KRW 200 000 in 2014, amounted to 5.5% of the average wage in 2016, the lowest in the OECD (Figure 29). It is given to 67% of the elderly – a very high coverage compared to an average of 22% for safety-net pensions in the OECD (Panel B). It thus spreads resources very thinly over a large segment of the older population.
The Basic Livelihood Security Programme provided benefits to only 6.7% of the elderly in 2015, reflecting the exclusion of older persons with the possibility of assistance from family members.
The company pension system created in 2005 covers all employees with more than a year of continuous service, excluding daily workers and persons enrolled in public occupational pension schemes. By 2016, the number of persons enrolled in company pensions reached 5.4 million, about half of those eligible and about a quarter of all employees. The number of persons enrolled in company pensions is equivalent to about 15% of the working-age population (ages 15 to 64).
Figure 29. The first-tier pension benefit1 in Korea is very low while the coverage is high
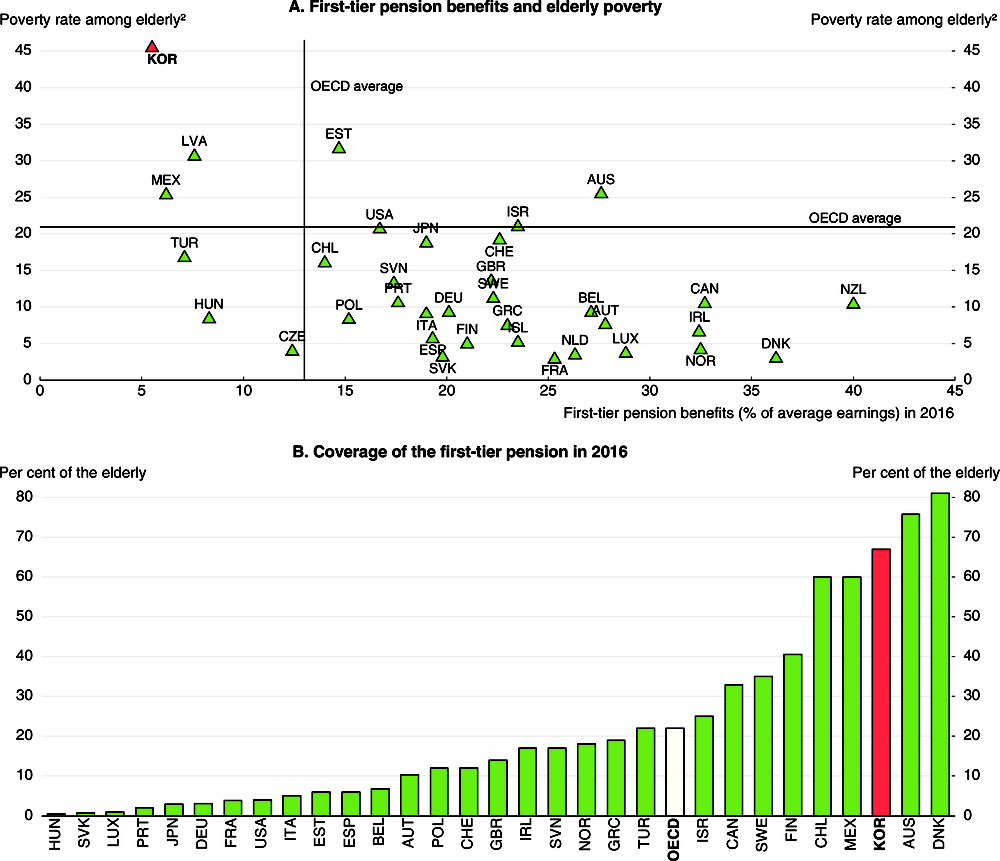
1. The non-contributory, safety-net pension for the elderly. In Korea, this refers to the Basic Pension.
2. Share of the elderly in relative poverty – an income below 50% of the national median – in 2015 or latest year.
Source: (OECD, 2017f), OECD Pensions at a Glance.
Countries with low safety-net pensions tend to have high elderly poverty rates. The Basic Pension is to rise to KRW 250 000 (USD 232) in September 2018 and to KRW 300 000 in 2021, while maintaining its coverage at around 70% of the elderly. The government projects that this will reduce the elderly poverty rate to 42.4% in 2021, still more than three times the OECD average. The Basic Pension has two key weaknesses: i) one-third of those who receive it are above the relative poverty line; and ii) the elderly in absolute poverty receive the same benefit as those above absolute poverty. The immediate priority is well-targeted social spending to ensure an adequate minimum level of income for all elderly. The government should focus the Basic Pension on the lowest-income elderly to ensure that they escape from absolute poverty (2016 OECD Economic Survey of Korea). It may be necessary to increase the total amount of spending on the Basic Pension to achieve this objective. A second option would be to further relax the eligibility criteria for the Basic Livelihood Security Programme to support the elderly. In addition, given that most of the elderly’s assets are in real estate, helping them turn those into liquid assets – such as through reverse mortgages – would provide additional income (Jones and Urasawa, 2014).
A three-pronged approach is needed to make the NPS more effective in reducing poverty in the long run. First, a larger share of the population should contribute. In 2015, insured persons paying contributions to the NPS amounted to 54% of the population aged 18-59, well below other advanced countries. Second, the contribution period, which the NPS projects will average 20.6 years in 2040, should be lengthened to boost retirement income. Third, the targeted NPS replacement rate, should remain at its current 45% (excluding the Basic Pension, which has a replacement rate of 5.5%), rather than cut to 40% as planned. With an average of 20.6 years of contributions through 2040, the replacement rate in that case would only be around 20%.
Even with the cut in the replacement rate and the planned hike in the pension eligibility age from 61 to 65 in 2033, pension spending will overtake revenues by 2044 (Figure 10). It is necessary, therefore, to raise revenue, in part by boosting the contribution rate from its low level of 9%. The NPS should be part of a multi-pillar approach to old-age income that includes increased private savings by developing the company pension system and individual pension savings.
Greening growth and addressing environmental issues
Korea’s energy intensity has been declining but remains one of the highest in the OECD (Figure 30, Panel A), reflecting its large manufacturing sector. Low, regulated electricity prices hamper efforts to reduce energy demand and act as a barrier to renewables. Renewable energy’s share of primary energy supply is the lowest in the OECD. Moreover, Korea provides substantial subsidies to fossil fuels (OECD, 2017e). The industrial structure and energy mix make Korea a relatively carbon-intensive economy despite some decline during the past 20 years. Korea has the second-highest greenhouse gas (GHG) emissions growth since 2000 and per capita emissions have risen above the OECD average based on production (Panel B). Korea has a goal to reduce emissions by 37% from a business-as-usual baseline by 2030, which implies that emissions would fall by 22% from their 2015 level. Past Korea Surveys have stressed the importance of using economic instruments to achieve environmental objectives (Table 14).
Figure 30. Green growth indicators: Korea1
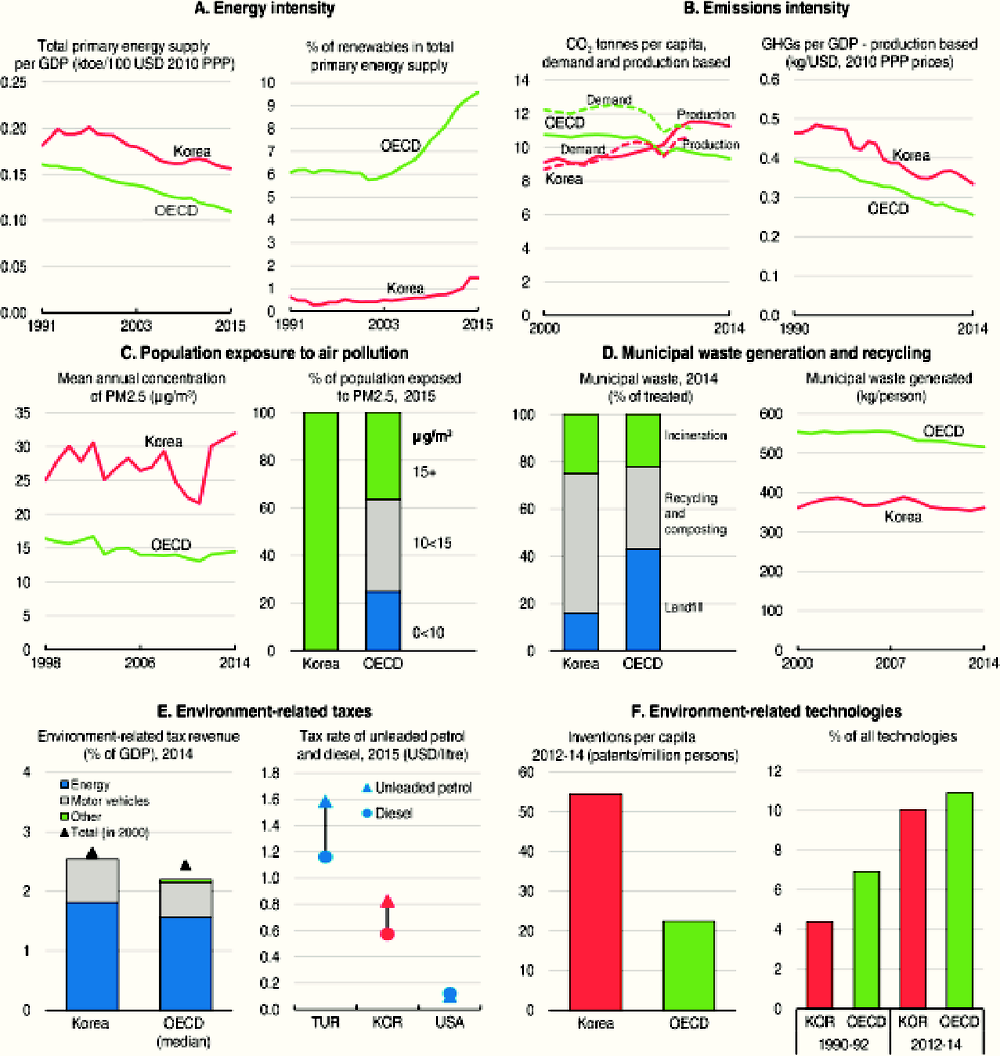
1. An explanation of these indicators is found at: http://stats.oecd.org/wbos/fileview2.aspx?IDFile=7ad102dd-e16d-4da0-a20c-624582b9984e.
Source: OECD Green Growth Indicators (database).
Table 14. Past recommendations to promote green growth and improve the environment
|
Main recent OECD recommendations |
Action taken since the 2016 Survey or planned |
|---|---|
|
Improve water pricing policies to increase efficiency by ensuring that prices cover water supply costs, as well as by developing water supply and improving demand management. |
No action taken. |
|
Air pollution should be reduced, in part, by co-operation with other countries in the region and through appropriate economic instruments. |
Up to ten coal-fired power plants are to be closed and the construction of new plants is banned. The "Comprehensive Plan for Fine Dust Countermeasures" was introduced in 2017 with a goal to cut domestic emissions by 30% by 2022 through measures covering power generation, industry and transport. It will also strengthen co‐operation with neighbouring countries to reduce pollution. The government aims to raise the share of renewables in electricity generation from 6% to 20% by 2030. |
In 2015, Korea launched a GHG emissions trading scheme (ETS), which covers nearly 70% of total emissions. Prices have been rather low, though somewhat higher than in other cap-and-trade schemes in the United States and Europe. In the first phase through 2017, allowances were cut by 2% per year and issued free. Until 2025, 90% of the allowances will be issued free, but the size of the cuts in the allowances has not yet been determined.
Achieving Korea’s emission reduction target requires tightening the ETS and reforming energy taxation and electricity pricing, so that price signals are carried through to energy users. Korea aims to introduce progressive pricing for residential electricity and pricing based on the time of day and the season for industry and other sectors. In addition, it is essential to strengthen energy demand management and develop renewable energy sources. The government plans to raise the share of renewables from 6% to 20% by 2030. Korea is more vulnerable to climate change than many OECD countries. It needs to continue pursuing adaptation measures in parallel with GHG emission reductions to face challenges such as rising precipitation and sea levels, more frequent extreme weather and declining agricultural production.
Korea’s efforts to tackle air pollution have borne fruit; since 2000, emissions of all major air pollutants but PM10 have fallen (OECD, 2017e). Nevertheless, average air quality in Korea is the worst in the OECD and deteriorating, as measured by exposure to PM2.5 (very fine dust), which is a good proxy for other pollutants (Figure 31).
Figure 31. Air pollution is increasing in Korea
Around 90% of the population lives in areas with annual exposure of over 25 micrograms per cubic metre, compared to less than 10% in the OECD. Virtually no Koreans live in areas where average air quality is rated as “good” (annual exposure to PM2.5 of less than 15 micrograms per cubic meter) (Figure 30, Panel C). Industrial processes and electricity generation, of which over 40% depends on coal, are key contributors to air pollution. It is exacerbated by dust blown in from abroad, particularly from China. Pollution from abroad may account for up to 70% of Korea’s air pollution during pollution peaks. Premature mortality from respiratory and cardiovascular disease is much lower in Korea than in some other countries with high pollution (Figure 31, Panel B). However, without any actions to reduce pollution, the number of premature deaths is projected to almost triple by 2060, placing Korea among the countries most affected by outdoor air pollution (OECD, 2017e). The 2017 “Comprehensive Plan for Fine Dust Countermeasures”, with a budget of KRW 7.2 trillion (0.4% of GDP), is an important move (Table 14).
Rainfall is abundant in Korea, but rapid runoff, high population density and a highly seasonal rainfall pattern lead to relatively high water stress. Although rapid progress in expanding sewage treatment has reduced water pollution, high use of pesticides and chemical fertiliser makes Korea’s irrigation-intensive agriculture sector a major contributor to water pollution. Improving water quality requires improving information on water resources, which is often fragmented or out of date. The government has launched a number of programmes to remedy this situation (OECD, 2017e).
Korea has a very good record in integrated waste management. Despite economic growth and intensifying urbanisation, Korea has kept per capita generation of municipal waste stable at a level well below the OECD average (Figure 30, Panel D). Recycling rates are relatively high at 80% of all waste generated. However, waste generation is still rising in line with GDP, underlining the need to further promote waste prevention (OECD, 2017e).
Revenue from environmentally-related taxes, at 2.6% of GDP in 2014, is above the OECD average (Figure 30, Panel E), with almost all generated by levies on energy and vehicles. Nevertheless, tax rates in real terms on motor fuel have fallen since 2009, as a partial realignment of tax on diesel with that on petrol was achieved by lowering the tax on petrol. Environmental tax and charge rates on air pollution, water pollution and use, and land development are too low to cover environmental and social externalities or to encourage pollution reduction and efficient resource use (OECD, 2017e).
Environment-related patents on a per capita basis are more than double the OECD average, (Figure 30, Panel F) reflecting Korea’s exceptionally high level of R&D expenditure. The rise in patent applications in climate change-related technologies is particularly rapid, suggesting that policy rather than technology is the major constraint on dealing with climate change.
Assessment of the government’s economic strategy
The new government is pushing a bold strategy in an effort to achieve a paradigm shift during its five-year term and create a “fair economy”. The new paradigm includes reforms of the large business groups (Chapter 1) and achieving innovation led by SMEs and start-ups (Chapter 2). While it is difficult to estimate the impact of implementing this paradigm shift, it could be large. The success of the government’s economic strategy in promoting inclusive growth will depend on its ability to raise productivity from its relatively low level while narrowing large productivity and wage gaps between large firms and SMEs and between manufacturing and services.
Some of the major initiatives discussed above – notably sharp increases in public employment and social spending, coupled with a hike in the corporate income tax rate – run counter to trends in the OECD area. An evaluation of such policies should take into account the current low level of public employment and social spending in Korea (Figure 8) and the importance of promoting inclusive growth. Still, the increases in public employment and social spending should carefully weigh the long-term costs of these initiatives, given that under Korea’s current framework, social spending is projected to continue increasing rapidly. Raising corporate income tax rates has been shown to have a negative effect on output growth in OECD countries, although Korea’s tax rate increase is limited. It would be better to make the tax system more conducive to inclusive growth, notably by increasing the VAT rate from its low level, with well-targeted measures to offset any regressive impact, and by moving to a greener tax mix.
The effect of the minimum wage hike is uncertain at this stage. According to a recent OECD study, “at reasonable levels, increases in the minimum wage are unlikely to cause substantial job loss” (OECD, 2015b). However, the planned 54% increase in the minimum wage during the President’s five-year term is nearly unprecedented among OECD countries, making the impact difficult to predict. Adjusted for inflation, the minimum wage would rise around 45%. Unless this is matched by higher productivity, it could push inflation above its target and have a negative impact on Korea’s international competitiveness. The minimum wage would rise significantly relative to the median wage (Figure 18). It would thus be best to assess the impact of the 16.4% hike in the minimum wage in 2018 before raising it further.
Recommendations to address key policy challenges
Key macroeconomic recommendations
Gradually reduce the degree of monetary accommodation by raising the policy interest rate.
Control spending in line with the Fiscal Management Plan to help ensure a sustainable fiscal balance in the long run.
Allow public spending as a share of GDP to increase in the face of population ageing in the long run.
Use taxes that are relatively less harmful to economic growth, notably the VAT, to finance rising social spending.
Re-allocate public spending to social welfare as planned.
Consider further tightening loan-to-value and debt-to-income regulations on mortgage lending depending on the impact of the recent changes.
Key recommendations to improve well-being
Upgrade accreditation standards in early childhood education and care and make them mandatory.
Raise qualification standards for early childhood education and care teachers.
Relax fee ceilings on private childcare institutions and entry barriers.
Break down dualism by relaxing employment protection for regular workers and making it more transparent, while expanding social insurance coverage and training for non-regular workers.
Assess the impact of the 16.4% hike in the minimum wage in 2018 before raising it further.
Further increase the Basic Pension and focus it on the elderly in absolute poverty.
Steadily increase the share of permits auctioned and the stringency of the total emission cap in the emissions trading system.
Raise environmentally-related taxes, in part to close the gap between diesel and petrol taxes, and boost electricity prices.
Bibliography
Akgun, O., B. Cournède and J. Fournier (2017), “The Effects of the Tax Mix on Inequality and Growth”, OECD Economics Department Working Papers, No. 1447, OECD Publishing, Paris, http://dx.doi.org/10.1787/c57eaa14-en.
Bank of Korea (2017), Monetary Policy Decision, 30 November, Seoul.
Brys, B. et al. (2016), “Tax Design for Inclusive Economic Growth”, OECD Taxation Working Papers, No. 26, OECD Publishing, Paris, http://dx.doi.org/10.1787/5jlv74ggk0g7-en.
Byeon, Y., K. Choi, H. Choi and J. Kim (2017), “Korea’s Paradigm Shift for Sustainable and Inclusive Growth: A Proposal”, IMF Working Papers, WP/17/260, International Monetary Fund, Washington, DC.
Chang, W. and S. Woo (2015), Performance Evaluation and Policy Task of SME Policy Finance Considering Vertical Relationship with Large Enterprises, Korea Development Institute, Sejong (in Korean).
Cho, H. (2016), “Labour Market Flexibility and FDI: Evidence from OECD Countries”, KIEP Working Papers, No. 16-06, Korea Institute for International Economic Policy, Sejong.
Cournède, B., O. Denk, P. Garda and P. Hoeller (2016), “Enhancing Economic Flexibility: What Is in it for Workers”, OECD Economic Policy Papers, No. 19, OECD Publishing, Paris.
Han, C. and K. Shin (2016), “What Explains Current Account Surplus in Korea?”, KIEP Working Papers, No. 16-15, Korea Institute of International Economic Policy, Sejong.
Hong, S. and I. Lee (2014), “Fathers’ Use of Parental Leave in Korea: Motives, Experiences and Problems”, Korean Women’s Development Institute, Seoul.
Jones, R. (2009), “Reforming the Tax System in Korea to Promote Economic Growth and Cope with Rapid Population Ageing”, OECD Economics Department Working Papers, No. 671, OECD Publishing, Paris, http://dx.doi.org/10.1787/226518762318.
Jones, R. and M. Kim (2014), “Addressing High Household Debt in Korea”, OECD Economics Department Working Papers, No. 1164, OECD Publishing, Paris, http://dx.doi.org/10.1787/5jxx0558mfbv-en.
Jones, R. and S. Urasawa (2014), “Reducing the High Rate of Poverty Among the Elderly in Korea”, OECD Economics Department Working Papers, No. 1163, OECD Publishing, Paris, http://dx.doi.org/10.1787/5jxx054fv20v-en.
Kim, G. (2017), “Recent Oil Supply and Demand Trends in North Korea”, KDI Review of the North Korean Economy, Vol. 19, No. 12, Korea Development Institute, Sejong (in Korean).
Kim, J. (2016), “Why Household Debt Held by Korean Seniors is Problematic: An International Comparison”, Economics Journal, Vol. 36, No. 4.
Koh, Y., S. Kim, C. Kim, Y. Lee, J. Kim, S. Lee and Y. Kim (2010), “Social Policy”, in The Korean Economy: Six Decades of Growth and Development, edited by SaKong, I. and Y. Koh, Korea Development Institute, Sejong.
Korea.net (2017), “President Delivers First Address to the National Assembly”, 13 June, Government of Korea, www.korea.net/NewsFocus/policies/view?articleId=147052.
Lee, B. (2008), “The Effects of the Minimum Wage on Job Loss and Job Entry”, Korean Journal of Labor Studies, Vol. 14, No. 1, Korea Association of Labor Studies (in Korean).
Lee, C. (2015), “Wage Structure Reform and Labour Market Flexibility: The Case of South Korea”, Center for Wage and Job Research, Korea Labour Institute, Sejong, www.ilera2015.com/dynamic/full/IL131.pdf.
Lee, J. (2016), “Assessment of North Korea’s Current Economic Policies and Outlook”, KDI Policy Research Series, No. 2016-08, Korea Development Institute, Sejong (in Korean).
Lee, J. and S. Hwang (2016), “The Effect of the Minimum Wage on Employment”, Labor Economic Review, Vol. 39, No. 2 (in Korean).
Lee, S. (2017a), “Assessment and Possible Explanations of North Korea’s Economic Trends in 2016”, KDI Review of the North Korean Economy, Vol. 19, No. 1, Korea Development Institute, Sejong (in Korean).
Lee, S. (2017b), “North Korean Industry in 2017”, KDI Review of the North Korean Economy, Vol. 19, No. 12, Korea Development Institute, Sejong (in Korean).
Lim, G. (2017), “2016 North Korean Market Trends”, KDI Review of the North Korean Economy, Vol. 19, No. 4, Korea Development Institute, Sejong (in Korean).
Lim, S. and U. Choi (2017), “Analysing and Evaluating Trends in the North Korean Economy in 2017”, KDI Review of the North Korean Economy, Vol. 19, No. 12, Korea Development Institute, Sejong (in Korean).
Ministry of Strategy and Finance (2017), “Plans to Curb Household Debt”, Economic Bulletin , October.
Ministry of Unification (2017), Moon Jae-in’s Policy on the Korean Peninsula, Seoul.
National Assembly Budget Office (2012), 2012-2060 Long-term Economic Outlook and Fiscal Analysis, Seoul.
National Pension Research Institute (2013), A Summary of the 2013 Actuarial Projection Result, Seoul.
Oh, J. (2017), “Analysis on the Recent Housing Construction Boom: Focusing on Public Housing Sites”, KDI Economic Outlook 2017-2nd Half, Korea Development Institute, Sejong.
Oh, S. (2017), “The Effect of the Minimum Wage on Wage Inequality”, in Labour Market System and Economic Inequality, edited by Lee, B., S. Lee and S. Oh, Korea Labour Institute Research Report, 2017-01, Sejong (in Korean).
OECD (2010), Tax Policy Reform and Economic Growth, OECD Publishing, Paris, http://dx.doi.org/10.1787/9789264091085-en.
OECD (2013a), Strengthening Social Cohesion in Korea, OECD Publishing, Paris.
OECD (2013b), The Survey of Adult Skills: Reader’s Companion, OECD Publishing, Paris.
OECD (2015a), In It Together: Why Lower Inequality Benefits All, OECD Publishing, Paris.
OECD (2015b), OECD Employment Outlook, OECD Publishing, Paris.
OECD (2016), OECD Economic Survey of Korea, OECD Publishing, Paris.
OECD (2017a), Education at a Glance 2017, OECD Publishing, Paris.
OECD (2017b), Government at a Glance 2017, OECD Publishing, Paris, http://dx.doi.org/10.1787/gov_glance-2017-en.
OECD (2017c), OECD Economic Outlook, (November), OECD Publishing, Paris.
OECD (2017d), OECD Economic Survey of Switzerland, OECD Publishing, Paris.
OECD (2017e), OECD Environmental Performance Reviews: Korea 2017, OECD Publishing, Paris, http://dx.doi.org/10.1787/9789264268265-en.
OECD (2017f), OECD Pensions at a Glance, OECD Publishing, Paris.
OECD (2017g), Tax Policy Reforms 2017: OECD and Selected Partner Economies, OECD Publishing, Paris, http://dx.doi.org/10.1787/9789264279919-en.
OECD (2018), OECD Economic Outlook, (May), OECD Publishing, Paris.
OECD/Korea Institute of Public Finance (2014), The Distributional Effects of Consumption Taxes in OECD Countries, OECD Tax Policy Studies, No. 22, OECD Publishing, Paris, http://dx.doi.org/10.1787/9789264224520-en.
Park, Y. and W. Park (2016), “The Impact of a Workweek Reduction on Labor Productivity”, KDI Policy Forum, No. 267, Korea Development Institute, Sejong.
Sung, J. (2014), “A Study on Trends and Causes of Wage Inequality”, KLI Working Papers, 2014-02, Korea Labor Institute, Sejong (in Korean).
World Economic Forum (2017), Global Competitiveness Index 2017-18, Geneva, http://reports.weforum.org/global-competitiveness-index-2017-2018/.
Yoon, J. (2014), “Maternity Protection and Its Effect on Employment”. e-Labor News Issue Papers, No. 149, Korea Labour Institute, Sejong.
Yun, H. (2016a), “Changes in the Relative Importance of the Minimum Wage, Income Support and Employment Support Programs”, KDI Focus, No. 71, Korea Development Institute, Sejong.
Yun, H. (2016b), “Implications of the Performance Evaluation of the Job Creation Project”, KDI Focus, No. 73, Korea Development Institute, Sejong.
Yun, Y., S. Oh, J. Lee, S. Whang and S. Lee (2015), “Study on the Impact of Minimum Wage Increases on Employment”, 2015 Employment Impact Assessment Project Report, Korea Labor Institute, Sejong (in Korean).
