The U.S. population is becoming increasingly urban and has gradually shifted to the south and west. Policy restrictions have played a role in preventing dynamic areas expanding, and when they do expand it can be through low-density housing sprawl. Land use restrictions and a sluggish housing supply as well as difficulties in making timely and co-ordinated supply of infrastructure have hindered workers benefiting from new opportunities including through moving. Policies can address these issues by targeting housing affordability, help families move and invest in infrastructure to improve accessibility and connectivity.
OECD Economic Surveys: United States 2020

2. Modernising state-level regulation and policies to boost mobility
Abstract
The population is moving and the economy is changing
The economic geography of the United States is shifting. As technology, trade and preferences have changed so has the location of the population and economic activity. In some areas, factories have closed and jobs have been lost. Employment has grown elsewhere as new industries have developed in places that are not bound by past production networks. While opportunities have emerged elsewhere, changing jobs needs to overcome distance and other barriers. In part, these barriers reflect regulations, which have become important determinants of opportunity for American workers.
Over the past 50 years, the growth of services and high-tech products, the rising importance of foreign trade and integration of global value chains to the US economy have also contributed to changing locus of economic activity. The share of manufacturing in employment has declined, particularly in the old industrial heartland of the Mid-East and Great Lakes regions. This region accounted for one half of total production and employment but now only accounts for one third as manufacturing activity has shifted to the south and west.
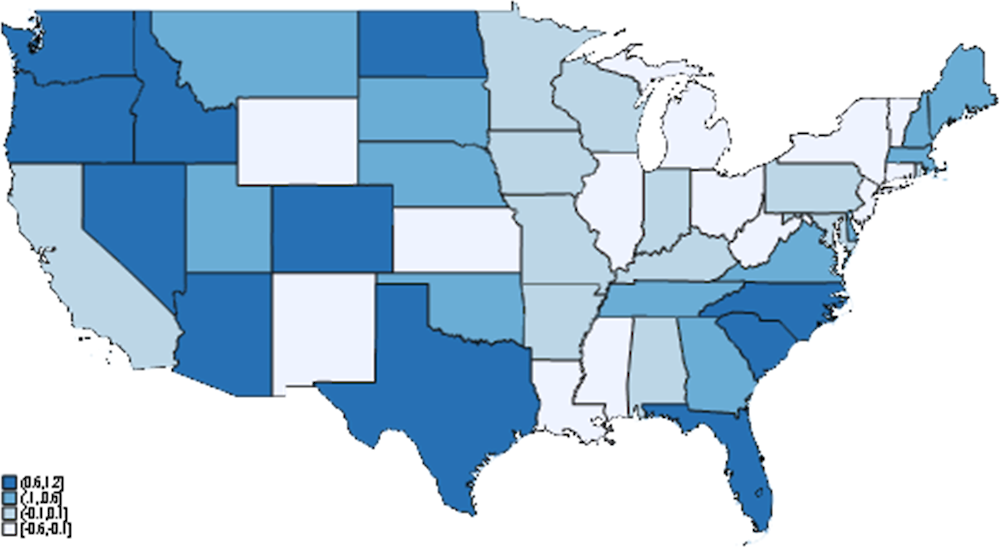
A second important driver of economic activity has been a secular trend of relative population increase in areas with warmer climates, partly driven by population movement both nationally and internationally. The effects of these processes drive net migration differences across the country (Figure 2.1). Even though mobility rates are declining as households move less often than they did in the past, households are nonetheless gradually moving from colder areas and places that are performing poorly towards the south and west of the United States. As a consequence, elderly populations are becoming relatively more important in the north and east.
Figure 2.1. The population has moved west and south
Net migration rates as percent of population, average annual rates 2011-2017
Source: Census Bureau.
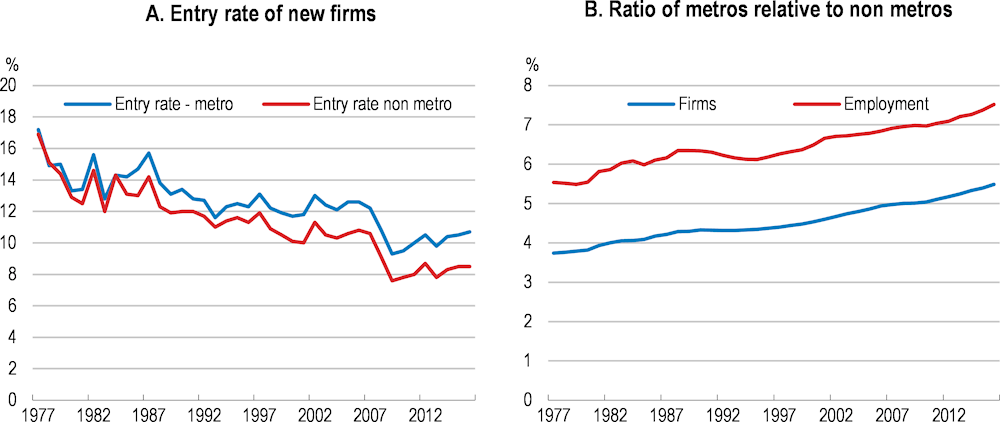
Accompanying these changes has been increasing urbanisation. At the last census, around 80% of the population were urban (areas with at least 2,500 inhabitants), with the share increasing on average by 3 percentage points each decade (Figure 2.2). The share of the population in cities is greater than the OECD average (75% and 64%, respectively). Cities with populations greater than 500,000 are especially prevalent and they are important centres for employment and economic activity. Since 2000, larger cities have accounted for over three-quarters of national GDP growth. Firm creation rates, while declining, have fallen by less in metropolitan areas, contributing an increasing urban concentration of firms and employment (Figure 2.3). Employment has fallen since the great recession in rural areas, particularly those that are not close to a metropolitan area (Arnosti and Liu, 2018[62]). Generally, smaller urban areas have also struggled during the 2010s in comparison with larger and better-connected areas.
Figure 2.2. The population is increasingly urban
Per cent of population that lives in urban areas in the United States and selected states.
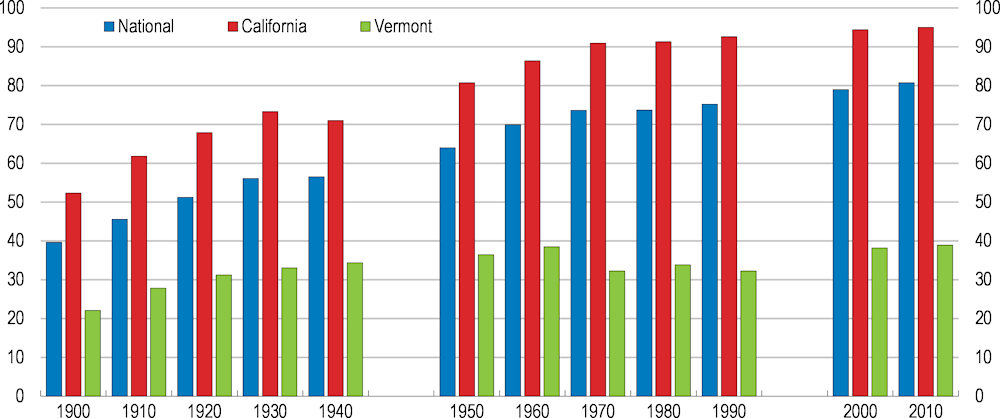
Note: Definitions were changed in 1950 and 2000. California and Vermont are the most and least urbanised states.
Source: Census Bureau.
Figure 2.3. Firms and employment are increasingly located in metro areas
Source: Census Bureau, BDS database.
The importance of these patterns of development is that they can give rise to spatial misallocation of resources as jobs are being created in places away from the places that old jobs are lost. A more vibrant labour market with people moving to opportunity or better able to access jobs in their existing areas is vital to boosting productivity and helping people remain active. Indeed, the ability to move from job to job is important for people joining the labour force and becoming more productive. Avoiding spells of joblessness also appears to be increasingly important. However, the share of the population moving each year has fallen from around 20% in the 1970s to under 10% more recently, with moves across state boundaries or moves to look for work also having been reduced.
This chapter examines the barriers to labour mobility with an eye to the links to productivity. It first uses labour market and income and output measures clustered into different groupings to explore the different labour market experiences of metropolitan areas. It then discusses emerging persistent differences of performance across metropolitan areas and states, while noting that labour market mobility to take advantage of opportunities elsewhere has diminished. The chapter then considers how housing and other policies can affect the mobility of the population. Geographical mobility is not a solution for all workers, particularly when new opportunities are distant. In this light, policies to help sustain employment in areas currently undergoing difficulties are complements to the regulatory focus of this chapter. When assessing the barriers to mobility and constraints on productivity growth the focus is mainly on state and local-level policies.
Emerging differences in labour market performance
Cities are adapting in different ways
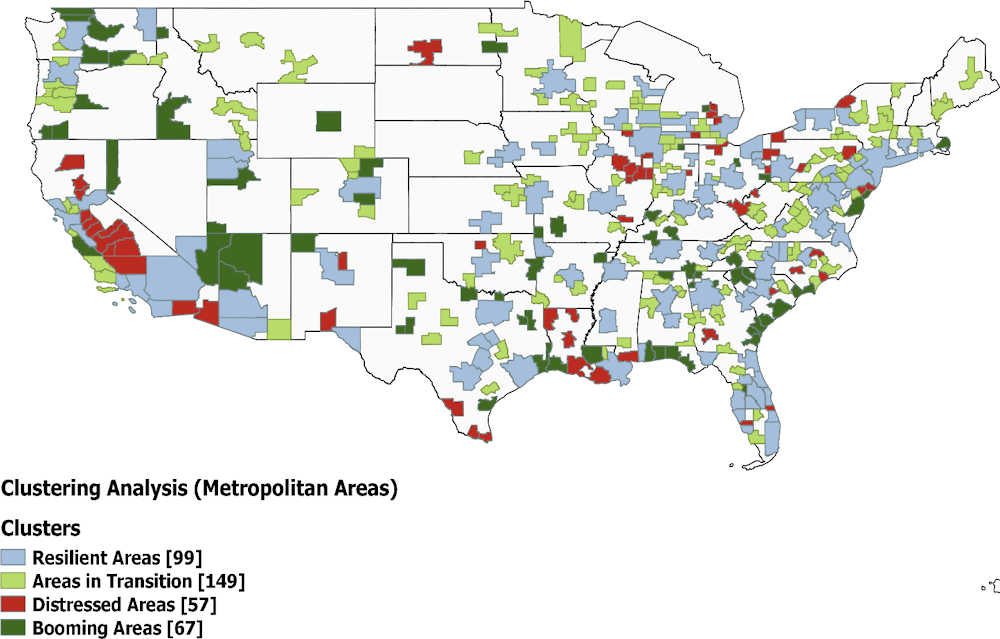
In response to productivity and labour mobility patterns, metropolitan areas are developing in quite diverse ways (Figure 2.4). New statistical analysis conducted for this Survey of labour market characteristics and indicators of economic growth suggest there are four distinct groupings of the 372 metropolitan areas included in the analysis, covering 86% of the population (Box 2.1) (Azzopardi et al., 2020). This analysis reveals some areas are doing well, some are struggling and falling behind, but others are nonetheless adapting to shocks. This approach makes it possible to break down very diverse cities into different subsets that are statistically similar with also differences in the indicators of labour market fluidity:
Booming Metropolitan Areas: These 67 metropolitan areas are home to about 7% of the total urban population in the U.S. Most of these areas are located in the South and the West. These areas have found success by building on often unique features. Some of these areas are fast growing technology centres and some are becoming retirement destinations such as Florida. These areas have the highest Job-to-Job mobility rates and also the highest GDP growth rate compared to other clusters. They also have a positive net job-to-job flow rate indicating that more job-to-job moves are flowing into these areas as compared to jobs moving out of these areas. They are attracting workers and companies due to their high quality of life and comparatively low cost of living. Metropolitan areas in the states of Texas, Washington, and Florida are overrepresented in this cluster. For example, in 2017, about 305,000 job-to-job moves came into Texas and about 260,000 came into Florida from other states. About 33,000 people from California and 32,000 people from Louisiana moved to Texas for a job-to-job move. Similarly, about 24,000 people from Georgia and 23,000 people from New York moved to Florida.
Distressed Metropolitan Areas: This cluster includes 57 metropolitan areas that seem to be struggling. Home to about 6% of the total urban population, these areas have a low job mobility rate and high unemployment rate. These areas also have a significantly lower GDP and income per capita growth rate, as compared to all other clusters. This group includes many trailing cities and old industrial areas. Metropolitan areas in North Dakota (Bismarck), Illinois (Bloomington, Champaign-Urbana) and California (El Centro, Chico) are a part of this cluster. Moreover, this cluster includes areas that have a negative net flow of job to job moves i.e. jobs moving out of these areas are higher than jobs coming into these areas. Many metropolitan areas in central California are also a part of this cluster. In 2017, more than one-quarter million job-to-job moves went out from California to other states. The highest number of these jobs went to Texas (about 33,000) followed by Arizona (about 25,000) and Washington (about 24,000). Another major reason behind these moves seems to be the high cost of living and the high housing prices in some of these metropolitan areas.
Resilient Mega Metropolitan Areas: This cluster includes 99 metropolitan areas and about three quarters of the U.S. urban population resides here. These areas are classified by very high population, low unemployment rate, average job mobility rate, and a high income per capita as compared to other clusters. This cluster includes most of the mega cities in the U.S. including New York, Los Angeles, Chicago, Dallas, Houston, Washington DC, and Miami. The average population size of the metropolitan areas in this cluster is more than 2 million people.
Metropolitan Areas in Transition: 149 metropolitan areas are a part of this cluster and account for about 11% of the urban population. These areas have slightly lower than the average job mobility rate and GDP growth rate, but they have a relatively higher income per capita growth rate as compared to other clusters. This cluster is mainly composed of relatively smaller areas such as Lewiston, ID-WA, Great Falls, MT, Columbus, IN and Kokomo, IN. The average population size of areas in this cluster is about 200,000 people is the lowest amongst all clusters.
Figure 2.4. Metro areas are different
Results of the clustering analysis conducted on metropolitan areas
Source: OECD Staff calculations based on 2017 data from BLS, Census Bureau and J2J Data.
Box 2.1. Machine learning cluster analysis of metropolitan labour markets
In order to understand the different patterns of development across U.S. cities new research used clustering analysis s to identify groups of metropolitan areas with similar labour market characteristics (Azzopardi et al, 2020). The main analysis replied on labour market indicators including the Census Bureau’s measures of job-to-job mobility, income growth, unemployment rate, and population size and also economic performance measured by metropolitan GDP growth.
The analysis used an unsupervised machine learning technique. A partitioning method named K-means clustering algorithm was applied on the whole sample of metropolitan areas to obtain homogeneous clusters of metropolitan areas. This algorithm makes it possible to break down set of observations into several subsets that are statistically homogeneous in their characteristics. This ascending approach, or agglomeration, starts with an observation in each class, then successively merges the two closest classes, and stops when there is only one class containing all the observations. In this analysis the K-means algorithm partitions the full set of observation into four homogenous clusters.
The results suggest can be divided into four unique clusters (Table 2.1)
Table 2.1. Characteristics of metropolitan area cluster groupings
|
Cluster (Metropolitan areas |
Main Characteristics |
Average job-to-job mobility |
Average GDP growth |
Average unemployment rate |
Average income per capita |
|---|---|---|---|---|---|
|
Booming Areas |
Very high mobility, Net job gainers, High GDP growth |
7.0 |
3.1 |
4.5 |
44301 |
|
Distressed Areas |
Low mobility, Lowest income growth, Low GDP, High unemployment |
5.4 |
-0.2 |
6.5 |
40952 |
|
Resilient Mega Areas |
Average mobility, High income per capita, low unemployment, high population density |
5.8 |
2.0 |
4.1 |
50843 |
|
Areas in Transition |
Low mobility, High income growth, Low unemployment |
5.6 |
1.5 |
4.1 |
44076 |
|
All Areas |
|
5.9 |
1.7 |
4.5 |
45619 |
Source: OECD analysis based on data for BEA. BLS, Census Bureau
One of the factors contributing to the varying performance of different areas is persistent differences in productivity growth. Productivity growth is increasingly concentrated in cities, and better performing areas appear to be pulling away (Figure 2.5). Higher income cities have enjoyed stronger real output growth since the turn of the century. In addition, larger cities are experiencing faster employment growth, although average per capita output growth since 2001 has been slightly slower. The plight of smaller cities is heterogeneous. A few, such as Midland, Texas, are growing rapidly, due to the expansion of shale oil production but other smaller cities are falling behind. Overall, these developments suggest a pattern of scale economies benefitting larger cities, but congestion or regulatory impediments damping growth for others (Rappaport, 2018[63]).
Figure 2.5. Cities are becoming more unequal
Real GDP per capita and employment in Metropolitan Statistical Areas.
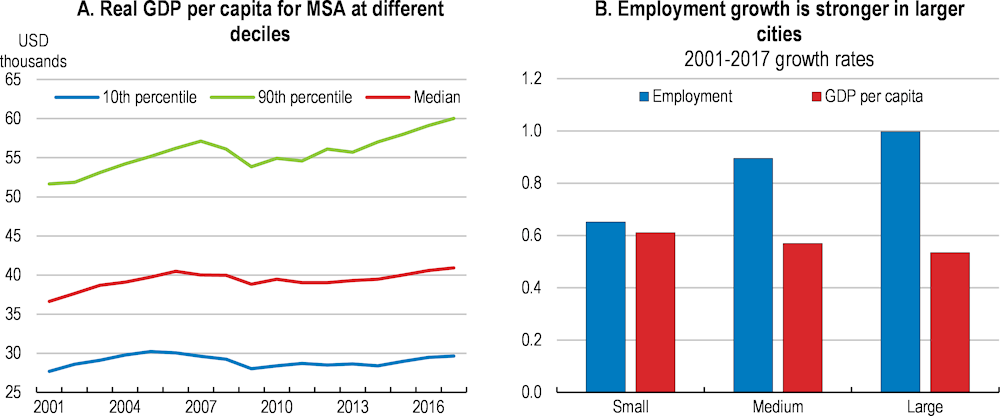
Note: City size is the smallest, middle and upper third of the MSA distribution in 2001.
Source: Bureau of Economic Analysis.
The patterns at the metropolitan level also seem to be feeding into developments at the state level. As is seen in other OECD countries, the divergence of income and productivity across regions within the country is increasing. Labour productivity variation across U.S. states is pronounced, with many states clustered together with similar levels of output per hour worked and a tail of a few states with higher levels (Figure 2.6). The trends also suggest that the better performing regions are pulling away from those with low income and productivity levels since the mid-2000s. The poorly performing states are often where dependence on natural resources is higher than average (such as Alabama, Louisiana and, Wyoming).
Figure 2.6. Productivity is skewed across states
Labour productivity in 2012 dollars in 2007 and 2017 and 1st to 5th quantile ratio
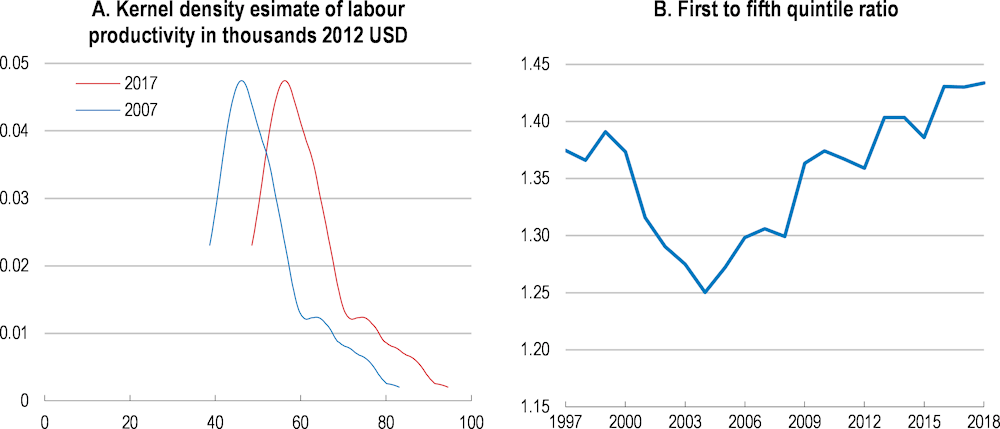
Note: In the left panel, the value of production is deflated by the implicit output deflator.
Source: Bureau of Labor Statistics.
On the other hand, productivity developments have tended to be more evenly distributed than in countries such as France and the United Kingdom, where a single region has accounted for the lion’s share of productivity growth (OECD, 2019[64]). This suggests wider opportunities for workers to move to areas that are performing comparatively strongly. However, the large and seemingly persistent differences emerging across the country are not being tempered by convergence of income levels to the extent that happened in the past. Ganong and Shoag (2017[65]) argue that income convergence has stalled in large part due to the slowdown in workers moving across states. This movement of workers has been an important shock absorber in the past (Blanchard and Katz, 1992[66]).
Job-to-job moves are also an important driver of productivity growth and a mechanism helping workers move up the job ladder (Haltiwanger, Hyatt and McEntarfer, 2018[67]) (Box 2.2). The recent growth literature emphasizes the importance of labour mobility and spillovers across industries and demographics. For example, labour mobility (inflows) appears to be positively related to regional entrepreneurship (Braunerhjelm, Ding and Thulin, 2016[68]). Similarly, (Foster-McGregor and Pöschl, 2016[69]) also found higher productivity effects through knowledge spillovers from labour mobility. Indeed, there is a positive correlation between states’ productivity growth and job-to-job flows (Figure 2.7).
Figure 2.7. Labour mobility and productivity growth are correlated
State level productivity and job-to-job flows.
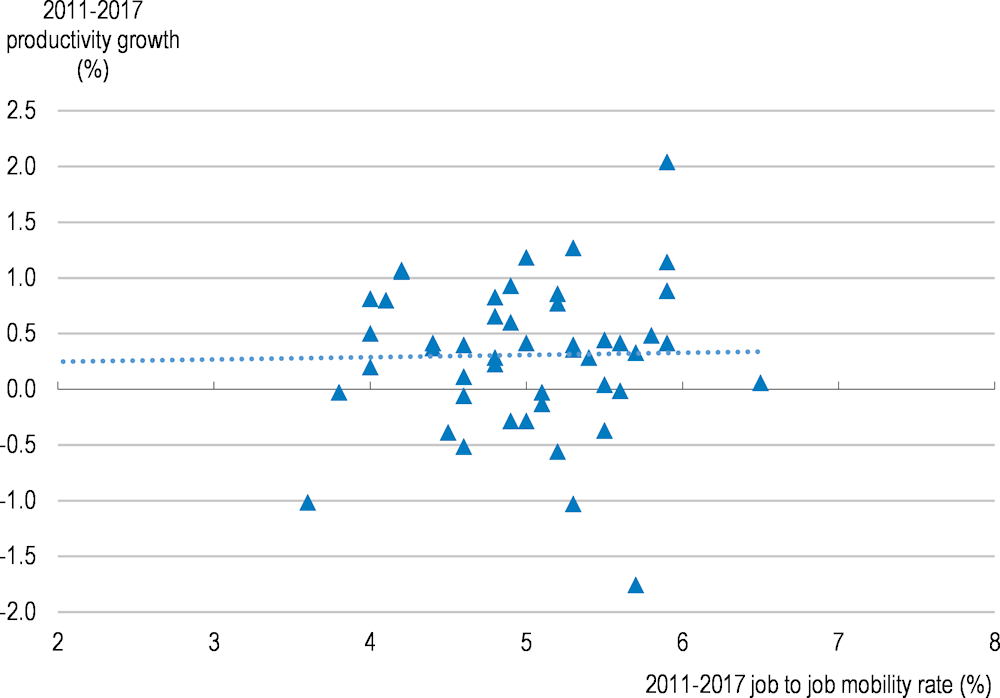
Note: Labour productivity is measured as output per hour worked.
Source: Bureau of Labour Statistics (BLS) and Job-to-Job Flows Data from the Census Bureau.
Box 2.2. Who gains the most from job-to-job moves?
Job-to-job moves are an important mechanism for moving up the job ladder. The U.S. Census Bureau provides detailed statistics on job mobility and earnings growth as a result of transition in and out of employment (Azzopardi et al., 2020). Job mobility varies substantially across age groups, reflecting the different stages of a working life. The hire rate is very high and substantially above the separation rate among youth entering the labour market, Across job-to-job movers, more disadvantaged groups (youth, ethnic and racial minorities and those with lower educational attainment) on average experience the largest earnings growth (Figure 2.8).
Figure 2.8. Who gains the most from moving job?
Job-to-job move with no nonemployment period (job move within quarter), estimated marginal job-to-job earnings growth effect of worker and firm characteristics, 2000 Q2-2017 Q3
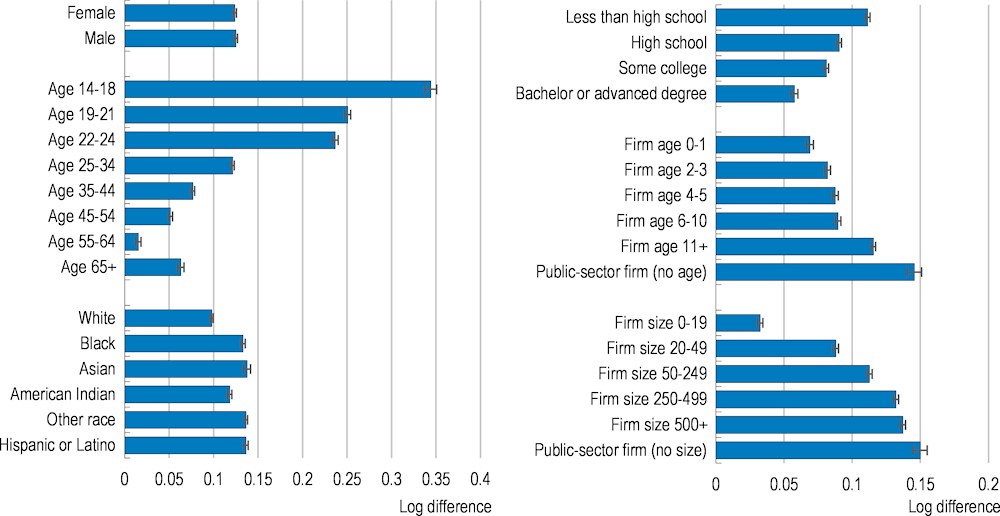
Note: Earnings are deflated by the PCE deflator. The bars reflect the marginal effects from a regression of the change in average earnings from a job-to-job move on indicators for the reported worker and firm characteristics as well as controls for within/between state move, state unemployment rates, industry, state and time fixed effects. Earnings are measured the quarter before (t-1) and after (t+1) the quarter of the move (t). Separate estimations are applied for sex/age; race/ethnicity; sex/education; firm age; and firm size. Error bands report 95% confidence intervals.
Source: OECD staff calculations based on Job-to-Job Flows Data from the Census Bureau.
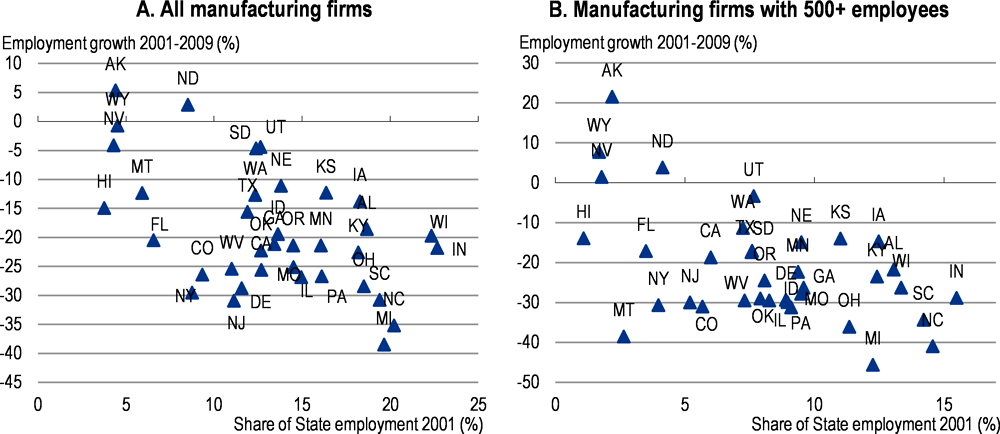
As discussed in the previous Economic Survey, during the 2000s public policies were ill-equipped to deal with large and often localised rises in unemployment and non-participation - partly the result of sizeable job losses in large firms (Figure 2.9). This has contributed to a decline in labour market fluidity (Box 2.3). However, other often regulatory factors are also at play hindering workers finding new employment opportunities.
Figure 2.9. Manufacturing losses were heavily concentrated
States with a high share of manufacturing employment in 2001 experienced large losses from 2001-2009
Note: Data is not available for 15 States. Total employment excludes self-employed and federal employed workers.
Source: OECD calculations based on Job-to-Job Flows database, Census Bureau.
Box 2.3. Labour market fluidity has been declining
Labour market fluidity has declined substantially since the late 1990s, coinciding with a period of sluggish productivity growth (Figure 2.10). Measures of job creation and gross job destructions have being trending down, especially during the 2000s while job hire and job separation rates dropped sharply during the two most recent recessions and have only partly recovered during subsequent upturns. Across measures and sources, the decline in mobility appears to be concentrated in the decade from 2000 to 2010, notably during the two recessions.
Figure 2.10. Labour market mobility and productivity have declined
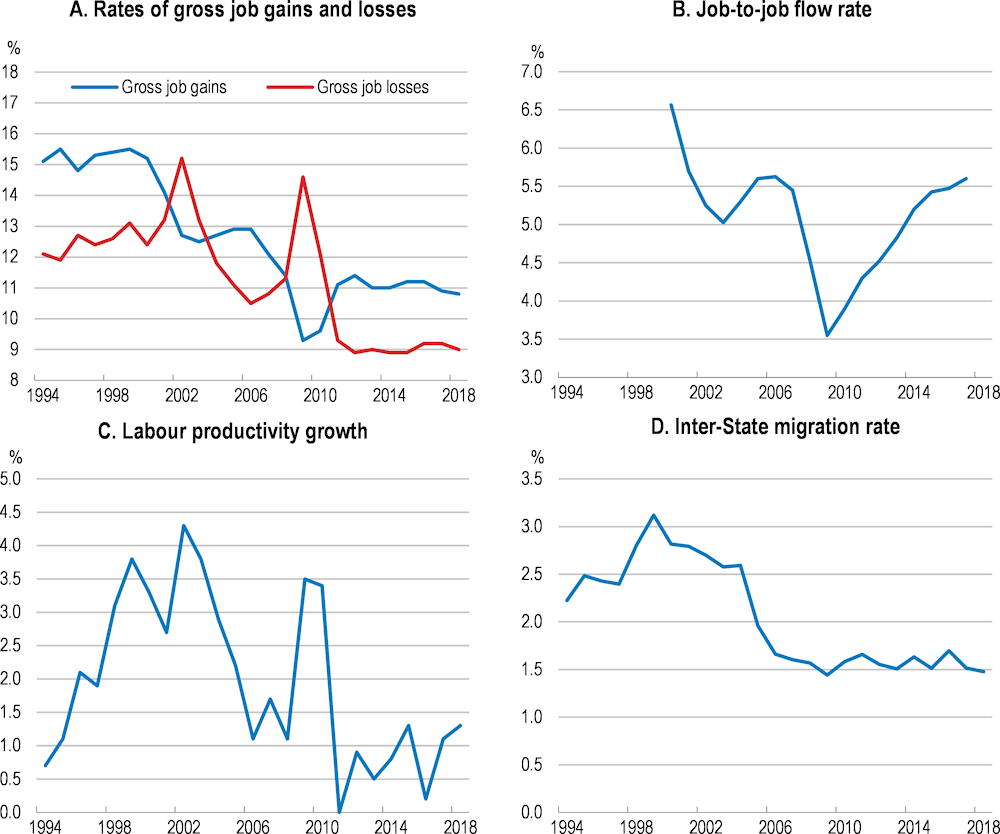
Note: Trends are comparable across sources, but not levels since different measures and frequencies are used.
Source: Census Bureau; BLS; Fallick and Fleischman (2004).
Some of the recent decline in labour market fluidity has been cyclical and reflected the severity of the great recession and the difficulties faced by workers displaced by the China shock. Job-to-job moves (a transition from one job to another job even with a short period of non-employment) accounts for around one half of all job hires. Job-to-job hires declined sharply around the great recession and have largely recovered to the pre-crisis rates, but remain below the rates observed at the beginning of the century. A more worrying trend decline in labour market mobility is seen in hires from non-employment. These types of hires have been on a downward trend from around 6% of employment every quarter to around 5% in recent years (Figure 2.11).
Figure 2.11. Job-to-job flows account for half of all job hires
Job hire and separations in percent of total employment in the United States.
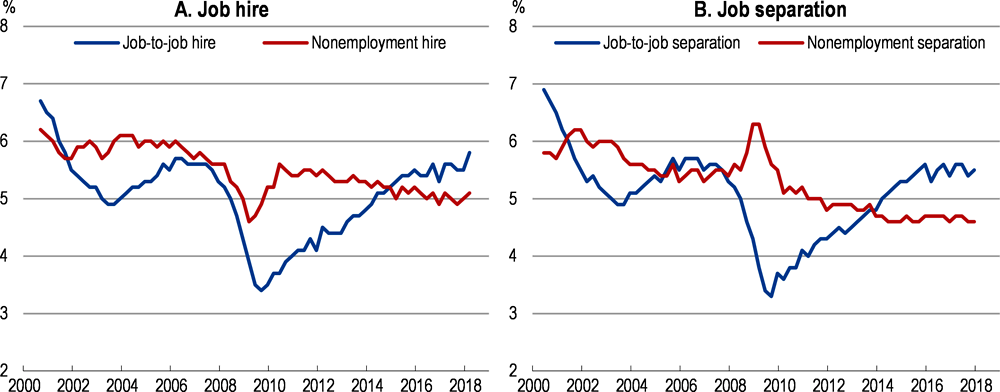
Note: The hire (separation) rate is defined as the number of hires (separations) divided by the average of total employment in the beginning and end of the quarter.
Source: Job-to-Job Flows Data from the Census Bureau.
Mobility is affected by land use restrictions and housing policies
Against this background of the growing importance of metropolitan areas in economic activity, their diverging economic performance and declining labour market fluidity, what are the obstacles in the way of American workers moving to opportunities? Some recent analysis points to declining wage premia for low-skilled workers moving to the more successful cities (Autor, 2019[70]). The job-to-job flow data reveals that moves that are geographically distant typically have a high return for the worker, who is often highly qualified. Lower skilled workers are not necessarily expected to move to high-skill clusters. But even moving within States has become a less frequent occurrence. A number of regulatory factors appear to be contributing to less labour mobility.
Housing supply is responding less quickly to demand
The growing share of the urban population and population shifts away from declining areas has put pressure on housing in metropolitan areas. A sluggish supply response despite mounting demands for housing units in thriving cities is partly determined by geography, but also by deliberate policy choices. In particular, land use restrictions, inclusionary zoning, and rent control can damp investment while attempting to address the shortfall in housing for lower-income and often young households. Other factors, such as some forms of property taxation, can also create disincentives to move.
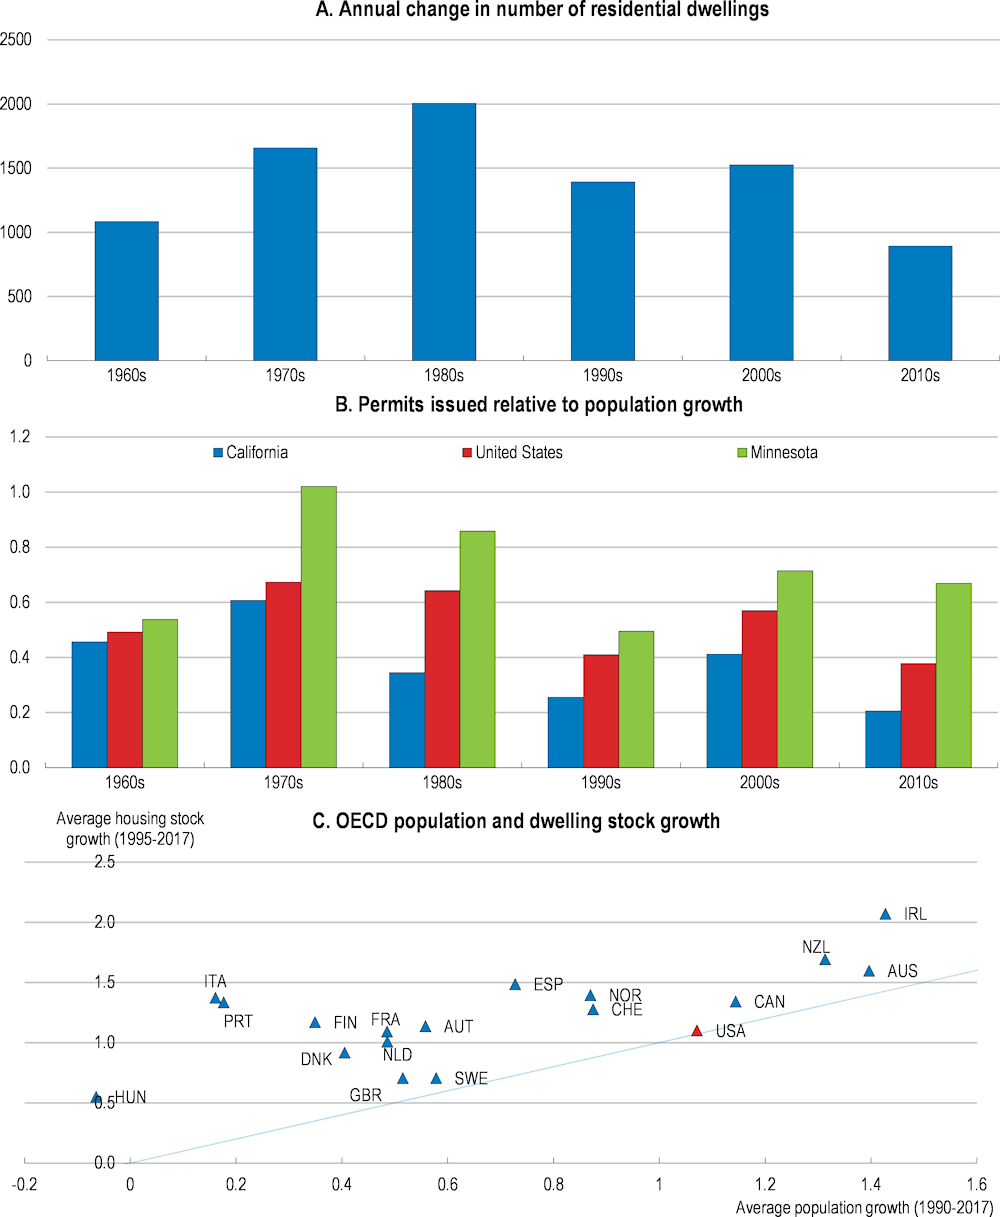
A flexible housing market is associated with reduced house price volatility, fewer problems with housing affordability and less economic inefficiency as workers are able to move to better opportunities. Housing supply in the United States is relatively elastic, both at the national level and across many cities. At the national level, residential investment responds strongly to price and income signals, but the speed of adjustment of supply appears to have slowed over time (Box 2.4). Indeed, the number of new dwellings created annually has been gradually decreasing. In addition, the number of permits issued annually does not appear to be keeping up with population growth, particularly in some areas, such as California but less so in Florida (Figure 2.12). In comparison with other OECD countries, the growth in the dwelling stock has been very sluggish.
Figure 2.12. The supply of housing has slowed
Source: U.S. Census Bureau, Cournede, Cavalleri and Zeiman (2019).
Box 2.4. Housing supply responsiveness
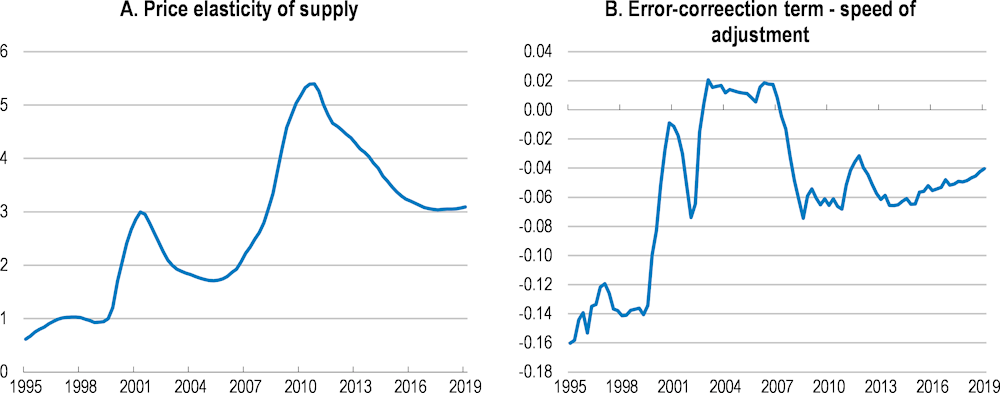
Empirical estimates of the responsiveness of housing supply to prices in the United States is generally high (Caldera Sánchez and Johansson, 2011[71]) (Cournede et al, 2019). Using the simultaneous equation framework developed in these papers and re-estimating them for sub-samples can give an indication of how the housing market has changed. As in the other estimates, the price elasticity of supply is consistently large, suggesting that housing investment responds to price signals strongly (Figure 2.13). In other OECD countries the price elasticity is typically below 2. The coefficient for the error correction term gives an indication of the quickness of the supply response. Generally, the more negative the value the quicker the adjustment takes. During the peak of the housing bubble short-run adjustments were not moving the housing market towards equilibrium. After this period, however, the size of the term suggests that the speed of adjustment is now considerably slower than it was before the pre-bubble period.
Figure 2.13. Residential investment is responsive to prices, but is taking longer
Coefficients from 80 quarter rolling regressions over the period 1975Q1-2019Q1
Note: The observations correspond to the coefficient estimated for the 80 quarters leading up to the date.
Source: OECD, BEA, Census Bureau, FHFA.
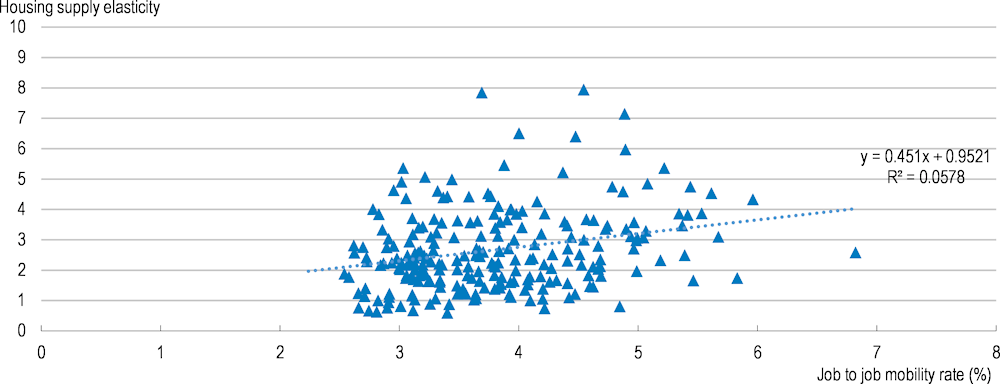
Estimates of supply elasticities at the city level show considerable variability. Cities with stronger supply elasticities also generally have greater job-to-job mobility (Figure 2.14), consistent with flexible housing markets enabling labour mobility and potentially reducing mismatches. A recent paper provided empirical evidence that increasing house prices have in particular reduced long distance migration (Bayoumi and Berkema, 2019[72]).
Figure 2.14. Cities with responsive housing supply also tend to have greater labour mobility
Source: Census Bureau Job to Job database.
In part the supply of housing is determined by physical constraints. Estimates of the impact of water (either rivers, lakes or seas) and steep terrain suggest that some cities in the United States face considerable difficulties in increasing supply by expanding laterally. For example, in some growth areas, such as San Francisco and Seattle, the coastline limits how far the city can expand. Taking into account the topography of the San Francisco-Oakland-Hayward metropolitan area suggests around 90% of the land is unavailable (Cournede et al, 2020). In addition, areas susceptible to natural disasters (earthquakes, flooding and hurricanes) may want to restrict supply or impose higher standards to ensure buildings are resilient. In others cases, such as the recently booming Midland, Texas, there are essentially few physical constraints to city growth. Furthermore, not all of barriers are related to geographical constraints.
Land use restrictions are prevalent
Land-use restrictions act as another barrier to housing supply. Restrictions that prevent mixed-unit developments or impose building requirements that limit the type of housing available to single family units can have the effect of holding down population density. A sluggish supply response in high demand areas contributes to sizeable fluctuations in house prices, mainly driven by the cost of land rather than construction. The impact of land use restrictions on property values can be large. Estimates suggest that property prices have been boosted by up to 20% by different varieties of land use restrictions (Severen and Plantinga, 2018[73]; Albouy and Ehrlich, 2018[74]).
Land use restrictions are widespread across the United States (Box 2.5). Justifications range from preventing construction on sites that are geologically unstable or liable to flooding to providing local externalities that boost the amenity value of a location, and thus housing demand. However, in other cases zoning appears to be driven by local residents’ desire to protect or enhance the value of their property (Smith, 1983[75]). The empirical evidence suggests that land-use restrictions matter for productivity, by preventing agglomeration economies being exploited in full. Agglomeration economies promise the harnessing of workers’ creative power more effectively from proximity and the availability of specialised services and amenities. Land-use restrictions can impede the full benefits by leading to a misallocation of workers across metropolitan areas. Restrictive land use regulations can prevent workers moving to cities where they could be more productive. One estimate of the aggregate consequences of land use policies between 1964 and 2009 suggests that U.S. GDP could have been 3.7% higher if housing supply had not been constrained in New York, San Francisco and San Jose (Hsieh and Moretti, 2019[76]). Even with smaller movements of workers than these calculations assume would still imply sizeable impacts on GDP (Glaeser and Gyourko, 2018[77]).
Box 2.5. Land use restrictions in the United States
Zoning was introduced in New York in the early 20th century and rapidly spread to other cities. Partly the spread of zoning was a reaction to uncoordinated development leading to high population densities, poor sanitary conditions and outbreaks of infectious diseases., as well as nuisances such as noise pollution from neighbouring factories. But also local residents saw zoning as a means to protect property values (Shertzer, Twinam and Walsh, 2018[78]).
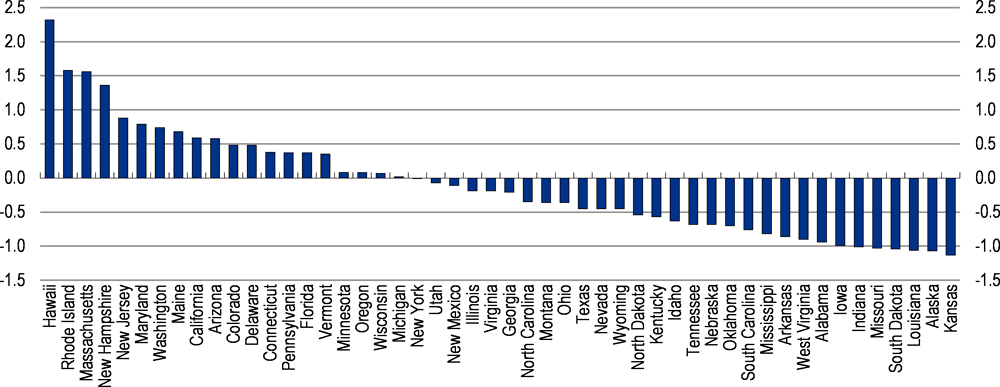
Due to the decentralised nature of land use regulation comparable information across the country is sparse. A nation-wide picture of zoning comes from the Wharton Residential Land Use Regulation Index, giving a snapshot of the local land use policies across 2,611 communities in 2008. The index combines information on different aspects of land use regulation, with lower values representing less restrictiveness. By construction the mean is 0 and the standard deviation is 1. The degree of restrictiveness varies considerably across cities in the United States, with the distribution of land use regulation skewed by some communities having very restrictive land use (Figure 2.15). On average, communities in the North East and the West Coast are more likely to have more restrictive land use regulations. Communities will often set density restrictions, impose open space requirements and on average took 6 months to take a decision on a housing project. In the highly regulated communities, more political entities were involved with the planning process with many veto points for a planning application and the process take longer. These areas will often require a popular vote on any changes to zoning and in metropolitan areas have formal restriction on new supply.
Figure 2.15. Land use restrictiveness varies substantially
The Wharton Residential land use regulation average for cities in each state.
Note: The index is constructed so that the mean value is 0 and the standard deviation is 1.
Source: The Wharton Residential Land Use Regulation Index.
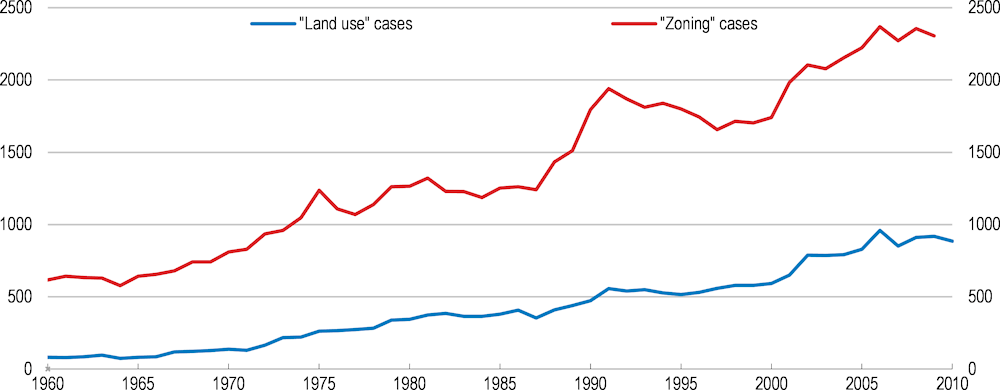
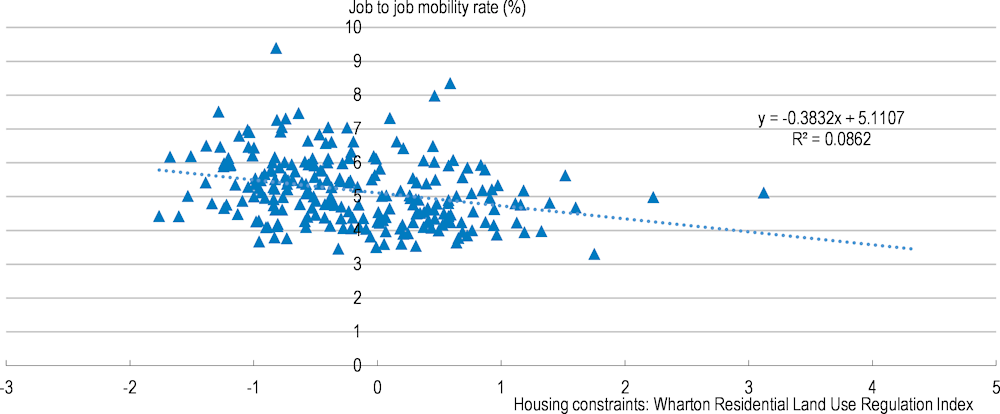
The increased use of zoning appears to have had detrimental effects on housing development by increasing transaction costs. Disputes over land use regulation and zoning appear to have risen strongly over time (Figure 2.16), although court cases have risen more quickly than overall civil cases in state courts they do not necessarily provide a gauge of whether land use restrictiveness has become more onerous. The increase in court cases involving land use or zoning has been associated with higher house prices. The issuance of permits for new construction tend to be lower in the states where the rise in court cases has been strongest (In simple panel regressions of the number of housing permits issued each year by state, the coefficient on the measures of zoning or land use cases implies that a 10% increase would be associated with a 2% decline in the number of permits). This holds when population growth is taken into account. In more regulated states the length of time taken to develop a project is correspondingly longer and can lead to projects being held up by legal challenge. The evidence from job-to-job transitions does seem to support that restrictive zoning is associated with lower labour market fluidity (Figure 2.17).
Figure 2.16. Court cases involving land use or zoning have risen over time
Number of court cases that reference “land use” or “zoning”.
Note: The total displayed excludes Washington, D.C.
Source: Data provided by Daniel Shoag.
Figure 2.17. Job-to-job mobility is lower in cities with more restrictive land use
Source: Census Bureau, Gyourko et al.
In other OECD countries, emerging best practice on land use restrictions are moving away from single-use zoning, towards systems that are based on assessing the externalities of a proposed development. For example, the Netherlands introduced a new system in 2016 that simplified planning legislation and integrated other aspects of land use, including the environment. Such an approach can guarantee core objectives are met and speed up the decision making process while allowing more flexibility and the possibilities for mixed-use development (OECD, 2017[79]). The system in Japan defines areas and thresholds for externalities and any development below this threshold is permitted. The system encourages mixed use, although the thresholds are more demanding in primarily residential areas. Mixed-use zoning is more developed in some of the coastal cities in the United States in the West and North East and less used in the Midwest and South (Sarzynski, Galster and Stack, 2014[80]). As cities grow, land use regulation should encourage densification along public transport corridors and low-density areas near city centres. This will only happen relatively slowly if policies are not co-ordinated. For example, the housing stock has only adjusted gradually around the expansion of the metro system in Los Angeles (Severen, 2018[81]).
City form is often not ideal for capturing returns to scale
Effective land-use planning needs to be co-ordinated with transport, housing and also energy, water, agriculture, tourism and economic development. In part alignment is needed to ensure the capacity of infrastructure to deal with proposed land use developments, but also ensure that policies are not working at cross purposes. As land use planning has typically significant local input, evaluation of policies and spread of best practice can help improve choices and help avoid pitfalls. In this light, one development to assist state and local policy is greater use of cost-benefit analysis, not only for specific projects but also for legislation affecting these areas. However, the degree to which states make systematic use of cost-benefit analysis across policy areas varies markedly (Nunn, Parsons and Shambaugh, 2019[82]). Providing technical support so that states can use standardised approaches to cost-benefit analysis may help their policymakers understand when policies and projects are good or poor value for money by facilitating comparison with other states’ experiences. Policy co-ordination will also be important in addressing various trends confronting OECD countries, including the ageing and depopulation of localities as well as confronting environmental challenges, such as making cities and towns resilient to water stress, extreme weather and climate change.
Local governments in the United States have considerable authority over land use planning than is usual in other OECD countries; a consequence of state governments delegating substantial responsibility. This gives rise to marked diversity across local governments. While this may help reflect local preferences it can also result in more fragmented metropolitan areas. The degree of fragmentation can be severe. For example, the winning bid for Amazon headquarters 2 in Virginia needed the consultation of around 60 different bodies. The difficulties in surface transportation in the Chicago Tri-State region is partly related to hold-up problems due to the large numbers of (local) actors involved (OECD, 2012[83]). The fragmentation of city government both across areas and by function leads to important co-ordination problems and can affect city productivity.
Typically, in other OECD countries, national or state-level framework legislation or other requirements determine planning processes (OECD, 2017[84]). For example, in Canada, all provinces and territories have regional plans with policies and objectives for land use and economic development as well as environmental protection. In the United States, only 13 states have state-wide spatial plans and not all are binding. The Federal government has some influence through environmental regulation, land ownership and specific policies such as the inter-state highway system and fiscal incentives.
The federal government through the Comprehensive Economic Development Strategy run by the Department of Commerce’s Economic Development Administration can provide support for economic development plans, which can also provide a framework to enhance co-ordination. Nonetheless, the economic development plans tend to be locally driven and thus fail to co-ordinate at a level to ensures that policies in different jurisdictions are not working against one another. For example, urban cores may wish to develop mass transit to neighbouring jurisdictions to reduce congestion and strengthen accessibility, whereas residents in these areas will tend to block this to prevent densification and preserve property prices.
Across the OECD, larger metropolitan areas (or functional urban areas) are more productive than smaller ones. Empirical work for functional urban areas in 5 OECD countries found sizeable agglomeration economies such that a doubling of city size was associated with a 2-5% increase in productivity (Ahrend et al., 2017[85]). However, administrative fragmentation, with some functional urban areas consisting of more than 100 municipalities, is found to hinder the achievements of these agglomeration benefits. The resulting administrative fragmentation can lead to adverse outcomes such as congestion and hamper the ease of doing business with negative consequence on the attractiveness of the city and ultimately productivity. The empirical work on city productivity found that cities with twice the number of municipalities would have 6% lower productivity levels than a comparable city. Cities that have developed co-ordinating mechanisms can mitigate some of the negative effects of fragmentation, and reduce the costs by half.
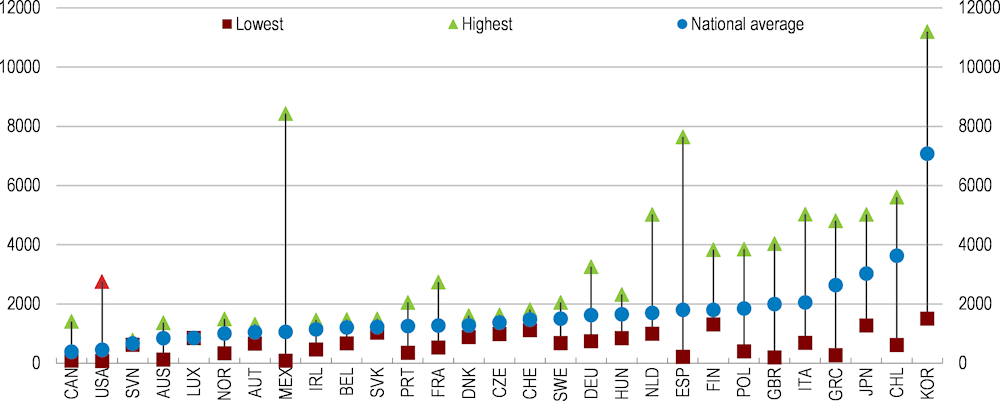
A further concern of uncoordinated development is it can give rise to sprawl. In comparison with many other metropolitan areas in the OECD, urban areas of the United States are some of the least dense, with only Canada having a lower density rate in urban areas (Figure 2.18). However, urban areas in the United States are very heterogeneous. Functional urban areas such as New York and Thousand Oaks, California have an average urban population density which is quite high as compared to most European cities. It is also important to note that population density of urban areas in the U.S. has been increasing over the last few years. On average, density growth in urban areas in the U.S. was the third highest amongst the 29 OECD countries between 2000 and 2014.
Figure 2.18. US cities are amongst the least dense
Average population density in urban areas, 2014
Source: Sprawl in OECD Urban Areas.
Housing affordability
To the extent that land use policies increase house prices and in particular restrict the supply of housing they aggravate housing affordability concerns. Housing affordability is also skewed by the tax code. Mortgage interest deductibility and the state and local tax deduction disproportionally benefits high-income families and pushes up property prices. The Tax Cuts and Jobs Act capped these tax expenditures, making the tax code more progressive.
A lack of affordable housing damps possibilities to move to job opportunities given the prevalence of house ownership and a relatively limited rental market. House prices in metropolitan areas are skewed with a tenfold difference between the cheapest and most expensive metropolitan areas (Youngstown-Warren Boardman in Ohio and San Jose-Sunnyvale-Santa Clara in California, respectively). Prices in the rental market by contrast vary by a factor of four (Zillow house price data). In addition, the price differences across cities are more pronounced for “bottom tier” houses. Large house price differentials are barriers to migration between metropolitan areas (Bayoumi and Barkema, 2019[86]), and thus have a potentially larger impact on workers with lower incomes, who potentially have the most to gain from moving job.
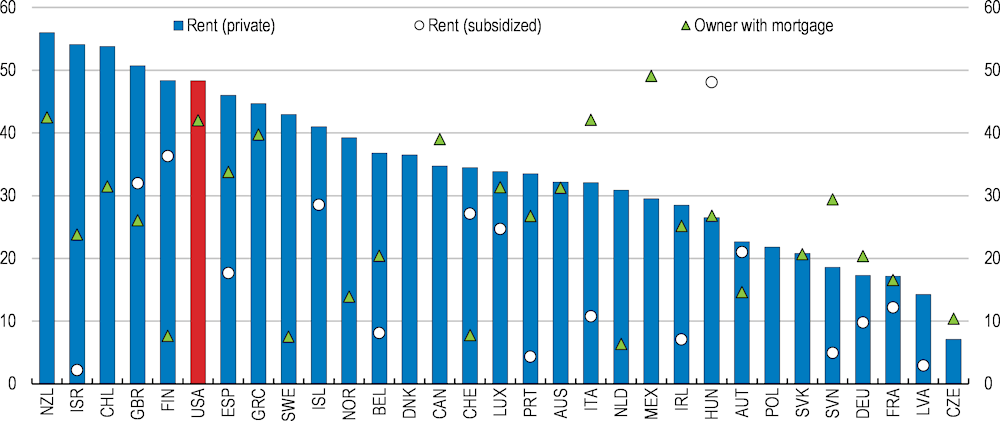
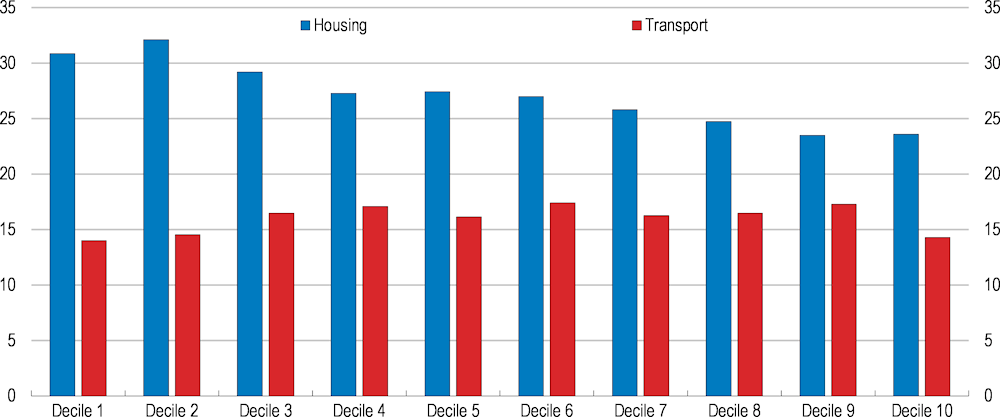
Elevated house prices also have other adverse distributional consequences. Housing costs can account for a sizeable proportion of disposable income for lower-income families. Around 60% of the population in the lowest income quintile spend more than 40% of disposable income on mortgages or rents, which represents a bigger share than in many other high-income OECD economies (Figure 2.19). Furthermore, the lack of affordable housing near employment opportunities dictates that many workers have to commute often long distances. Transportation costs account for between one-third to one-half of housing costs and the combined costs of housing and transportation account for a large share of families with low incomes (Figure 2.20). The share of public transport in total household spending has been rising relatively quickly in recent years, which is particularly a concern for households in lower-income groups.
Figure 2.19. The housing cost overburden is substantial
Share of population in the bottom quintile of the income distribution spending more than 40% of disposable income on mortgage or rent, by tenure
Source: OECD Affordable Housing Database.
Figure 2.20. Housing and transport are important spending items
Shares of annual aggregate expenditures by income decile, %
Source: Consumer Expenditure Survey, U.S. Bureau of Labor Statistics.
The under-provision of affordable housing can create barriers to workers:
At the local level, exclusionary land use restrictions may impede workers living close to places of work (they may be zoned in different areas) and thereby increasing commuting times. There is some empirical evidence that more restrictive land-use regulations increase commuting times. Commuting times tend to be longer for workers with tertiary education and high-income workers, possibly reflecting the greater employment opportunity to individuals with their own means of transport.
For longer moves, biases in the tax code supporting single unit housing and in land use regulations can mean that insufficient rental units are available, particularly for lower-income workers. Job-to-job transitions that cross state borders, particularly longer distances, are dominated by higher paying jobs. As such, job opportunities in high-productivity cities may not have substantial impacts on low-income workers stuck in declining areas. As a result, inequality within a metropolitan area can diminish as high income workers move to new opportunities, but inequality across metropolitan areas increase (Hornbeck and Moretti, 2018[87]).
The lack of affordable housing has prompted reactions from city, state or federal authorities as they attempt to address the unwanted consequences of local land use restrictions. In some cases, these policies to improve affordability are a double-edged sword. Making housing units available for low or moderate-income families by holding the rental price below the market price, can also have a pernicious effect on supply in the longer run. Evidence in OECD countries suggests that increasing supply at different price ranges in line with demographic trends helps support cities remaining affordable (OECD, 2017[79]).
At the state and local level, recent initiatives to address housing affordability, including the use of inclusionary zoning, rent controls and initiatives to overcome local nimbyism.
Inclusionary zoning has attracted increasing attention since it was introduced in California in the 1970s and appears a way to ensure affordable housing provision. This approach requires developers to provide a proportion of new housing units for low-to-moderate income families and as such will only be attractive in high cost markets. The majority of inclusionary zoning units have been developed in the Washington D.C. metropolitan area and tend to be in low-poverty areas (Schwartz et al., 2012[88]). The increased share of affordable housing for lower-income households may potentially depress investment, increase market rents and modify residential patterns by increasing the attractiveness of less central locations (where affordable housing is generally scarcest in the absence of a policy intervention). The authorities can try to mitigate the costs to developers of providing housing units by relaxing density, height and parking requirements or providing fiscal inducements or subsidies.
Rent controls are well-established in parts of California and New York. More recently, in 2019 Oregon has introduced a state-wide restriction. However, other states have banned their use. Typically rent controls impose restriction on the growth of rents for older housing units. But the United States is one of the few countries in the OECD where rent control can also determine the initial rent level. Empirical evidence from across the OECD suggests that these measures harm residential mobility (Caldera Sánchez and Andrews, 2011[89]). An additional concern is that they may lead to housing being withdrawn from the rental market or depressing housing investment. Indeed, the lifting of rent controls has been associated with rising housing values inducing new construction and boosting rental supply (Autor, Palmer and Pathak, 2014[90])
A number of areas have introduced initiatives to address the supply constraints, by relaxing the constraints imposed by local areas. For example, Massachusetts state law 40B gives the right for developers to override local zoning laws, where a share of affordable housing units meets a threshold (10%). In Minneapolis, the city authorities decided to upzone the entire city. Up-zoning relaxes zoning policies (e.g. single unit or height restrictions) and can allow city density to increase (albeit to the extent that the building stock is replaced). This helps affordability by preventing land prices driving up house prices and by boosting the supply of housing units. One of the emerging findings in detailed empirical work is that increased supply of any sort helps improve housing affordability (Mast, 2019[91]). In this regard, accessory dwelling units can also provide more affordable housing. An accessory dwelling unit is a small, independent housing unit on the same plot as a single-family house and may provide more practical housing options for relatives or renters. For municipalities they can represent an inexpensive way of increasing housing supply while also increasing their property tax base (HUD, 2008[92]). In some cases, such as San Francisco, relaxing zoning laws to allow such units can reflect existing reality in high-pressure housing markets.
The federal authorities have started work to address housing affordability. A Presidential executive order established a White House Council on Eliminating Regulatory Barriers to Affordable Housing. The regulations under consideration include overly restrictive zoning, rent controls, building codes, efficiency requirements and permitting procedures. Reforms to such policies may potentially help improve affordability, and the CEA (2019) also suggests may even help reduce homelessness through increasing supply.
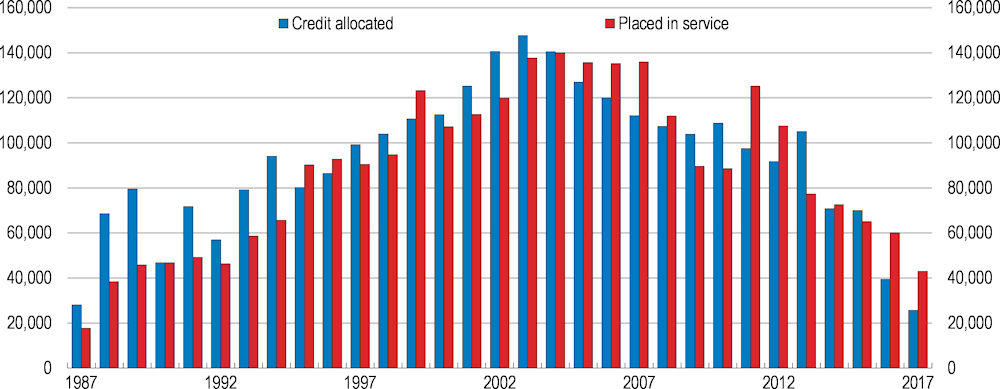
The Low-income Housing Tax Credit programme run by Treasury and implemented by state and local governments is an important source of funding for multifamily housing units in the United States. This credit has supported the building or rehabilitation of housing units for low-income tenants, currently the credit is around $10 billion annually and has provided for over 2 million housing units since its introduction in 1986. The number of units placed in service peaked around the turn of the century. Over the past decade the number of units allocated and place in service has been stable although incomplete reporting data appears to show a slwoing (Figure 2.21).
Figure 2.21. Fewer housing units are supported by the low-income household tax credit
The number of housing units placed in service or for which credit has been allocated.
Source: LIHTC database, Department of Housing and Urban Development.
The Low-income Housing Tax Credit accounts for a large share of federal funding for affordable housing, especially in rural areas, and appears to have positive externalities in distressed neighbourhoods by boosting property prices of neighbouring housing and reducing crime rates (Dillman, Mertens Horn and Verrilli, 2017[93]). Evidence for other areas is mixed, but may depress house prices in high-income. There was concern that the 2017 tax reform could affect the attractiveness of the Low-income Housing Tax Credit, to corporations as a result of lowering the corporate income tax rate. . However, two changes made by Congress appear to have muted any effect. First, the amount of credit available to states increased by 12.5% till 2021 and second, Congress relaxed restrictions on tenant income eligibility by allowing some higher income tenants if offset by tenants with incomes lower than program requirements otherwise allow.
Local opposition to the increase of supply (particularly of housing units that are better suited to lower or medium-income tenants) is largely based on the fear that increased supply will have a negative impact on local house prices. The effects are more nuanced, suggesting that different types of housing can coexist (Dillman, Horn and Verrilli, 2017[94]). This can arise from a number of spillovers of increasing investment in the area, renovation of rundown properties that are a blight to local property prices (Edmiston, 2012[95]). Emerging evidence suggests that densification in the urban core is associated with neighbourhood house price gains. On the other hand, suburbs of some metropolitan areas experience a negative impact.
Housing vouchers are another possible means to make housing more affordable for low-income households. At present, this is financed by federal money, but the amounts available fall short of the eligible population (only about one fourth receive a housing voucher through allocation by lottery). Nonetheless, Housing Choice Vouchers support approximately 2 million households. While this addresses distributional concerns, the receipt of a voucher can impede mobility as the landlord also needs to participate. Low-income workers may be concerned about moving to opportunities in higher paying areas where rents are correspondingly higher. While regulations require vouchers to be portable between the Public Housing Authorities implementing the voucher programme, billing issues are complicated and the family may lose the voucher if they do not find a housing unit within a time limit. Recent empirical evidence also suggests that support for low-income families can help families move into areas with higher gains of intergenerational income mobility (Bergman et al., 2019[96]).
The authorities reacted to obstacles in moving to areas offering better opportunities by introducing Small Area Fair Market Rents as a pilot project in 2012 and then extending it in 2018. This scheme sets voucher amounts on the prevailing rents in a neighbourhood rather than across a metropolitan area to allow families greater choice. An evaluation of the pilot revealed that families moved to neighbourhoods offering better opportunities with little impact on overall payments to landlords (Dastrup et al., 2018[97]). A recent initiative by Congress in 2019 supported another mobility demonstration programme for Housing Choice Vouchers, which may facilitate moves between Public Housing Authority areas. The funding will support families in landlord outreach and search assistance as well as financial coaching and post-move support. Some funding is set aside to examine the cost-effectiveness of the programme.
A final area where policy could ease supply constraints would be from reducing other regulatory costs of construction. For example, HUD requires minimum building standards for buildings being constructed as part of HUD housing projects. Ongoing efforts by HUD and state and local governments to alleviate regulations on building materials, for example, have the potential to boost supply. Estimates of the regulatory burden made by the National Association of House Builders suggest that the costs associated with site development, including applying for development approval, could account for 15% of a house price (Emrath, 2016[98]). The costs of adhering to regulation during construction could amount to almost 10% of the final house price. Progress on this front may help to reduce construction costs. The price index for new private residential construction has been rising more quickly than the GDP deflator since the early 1990s - on average by more than a percentage point each year - albeit with a notable fall in the lead up to the great recession.
Other policy levers to address reduced mobility
Not all the solutions to the spatial mismatch of employment opportunities and the current location of the population is likely to be met through boosting house supply and migration. Increasing the attractiveness of areas that are suffering offers one alternative. Recent work from the OECD also suggests that forging better linkages between (smaller) metropolitan areas and surrounding regions can enhance these regions attractiveness by offering greater scale economies (Ahrend and Schumann, 2014[99]). In others cases, particularly more remote areas, the opportunities for piggybacking on cities will be more limited, but enhancing the communication linkages may offer some benefits, not least access to government services.
Using taxation to encourage investment in declining areas
One way municipalities can finance development is through tax increment financing, which is a form of land value capture. In this approach the local authorities designates an area for development. The attraction of this approach is the municipality continues to receive property taxes on the initial “base property values”, but as property prices rise with the development the additional revenue stream is dedicated to project development and servicing bond financing. This offers a mechanism to bring the public and private sector together, which may be especially important in declining areas where coordinated action is required. As such these are place-based policies that attempt to overcome barriers to locating economic activity in distressed areas. Furthermore, the calculation of the tax increment requires at least a partial cost-benefit analysis, which can help raise the effectiveness of the investments (OECD, 2017, land use planning systems). However, this approach can incur substantial up-front costs and are criticised for shifting economic activity rather than creating new jobs.
The Tax Cuts and Jobs Act introduced Opportunity Zones, which give tax advantages for investments in underperforming areas. This approach allows private investors to invest unrealised capital gains into funds that finance projects in opportunity zones. The eligible zones are census tracts with relatively high poverty rates and low median income. The longer the investor remains in the investment fund the smaller the estimated capital gains tax they need to pay. The Joint Tax Committee estimates that this will cost $1.6 billion in reduced taxes between 2018 and 2027.
The United States has previously implemented similar schemes: Enterprise Zones and Empowerment and Renewal Communities. Empirical analysis suggests that tax subsidies promote local job creation and lead to wage increases, although this may be a relocation of employment and the cost per job can be relatively high (Busso, Gregory and Kline, 2013[100]). However, the costs of sustained regional underperformance and low employment also needs to be taken into account. As part of the implementation of the Opportunity Zone initiative, the Administration is developing private and public data sources to monitor outcomes better than was done for the previous programs. In light of the potential drawbacks, identification and dissemination of best practice will help ensure that finances are used to boost local economies cost effectively.
Current tax competition between states has not been very successful in this regard. The state of Kansas and Missouri have reached a truce in 2019 after recognising that taxpayers subsidised firms moving jobs across the border in Kansas City with little net employment gain.
Using infrastructure to facilitate access to metropolitan areas
Infrastructure investment can boost employment opportunities and productivity gains. While the largest cities in the OECD are 2 to 5% more productive than cities half their size (Ahrend et al., 2017[101]), other smaller metropolitan areas can exploit transport connections to their surrounding areas to achieve scale economies. Evidence from European cities suggests that reducing the travel time to urban agglomerations can boost economic growth in these areas (Ahrend and Schumann, 2014[99]).
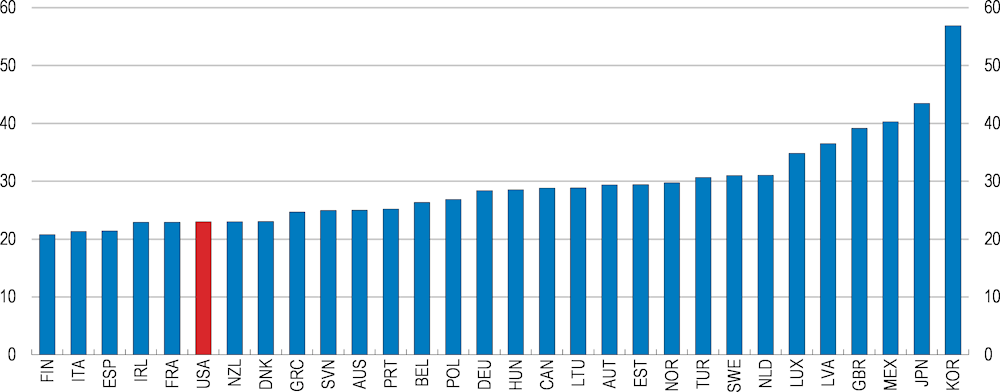
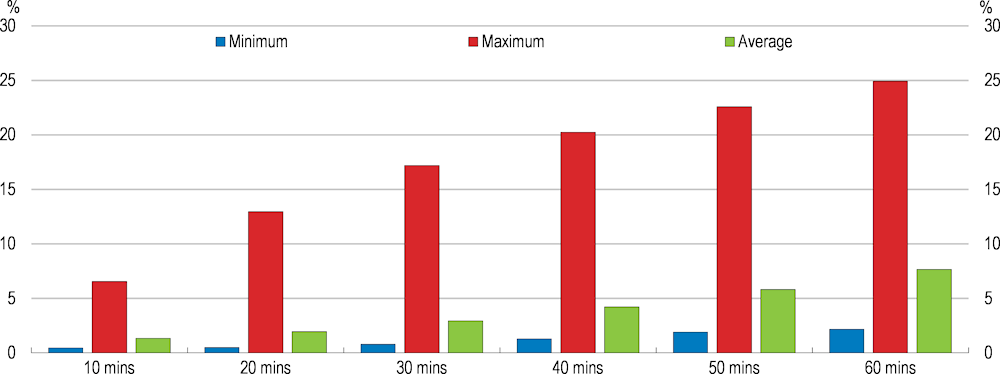
In comparison with other OECD countries, commuting times in the United States are relatively short for the adult population (Figure 2.22). However, according to the American Community Survey for those who commute the average time to work in 2018 was 27 minutes each day. For those taking public transportation that average commuting time was over 50 minutes. Indeed, the accessibility of jobs by mass transit is limited and commuters in 50 minutes would only have access to 6% of the jobs that a car driver could reach (Figure 2.23). Furthermore, the variation across the country is large. Average one-way commuting times ranges from around 15 minutes in some smaller metropolitan areas to well over 30 minutes in larger metropolitan areas such as New York and Washington, D.C. Average commuting times across metropolitan and metropolitan areas has crept up over the past decade rising by around two minutes.
Figure 2.22. Commuting time is relatively short on average in the United States
Time spent commuting to work or study in minutes per day, latest available year.
Source: OECD Family Database.
Figure 2.23. Access to jobs by mass transit is limited
Share of jobs accessible by mass transit relative to cars at different time horizons
Note: Based on data for the 50 largest metropolitan areas.
Source: University of Minnesota Accessibility Observatory.
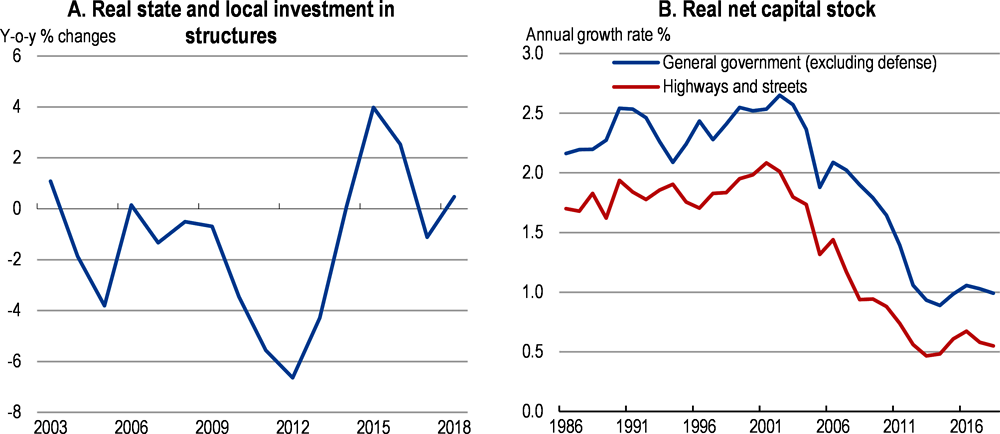
State and local government investment has fallen in real terms since the beginning of the century, with investment collapsing in the aftermath of the great recession (Figure 2.24). Overall, real investment in government structures has fallen by one-quarter, but the decline has been especially severe for highways and roads. The growth rate of these infrastructure assets has slowed to a crawl. The failure of investment to keep pace with economic development has resulted in poor transport linkages, which can hinder metropolitan areas and their hinterlands exploiting the benefits of better connectivity and can thwart the connection of regions and smaller cities to benefit from greater scale.
Figure 2.24. Sluggish investment has slowed the growth of the transport capital stock
Source: Bureau of Economic Analysis.
The Federal government has some role to play through the disbursement of funds from the Highway and Mass Transit Accounts, accounting for roughly three-quarters and one-quarter of spending respectively. The funding source for fuel taxes has failed to keep pace with inflation and demand, necessitating Congress to transfer supplementary resources. In addition to the lack of funding for transport infrastructure, the co-ordination of investment also needs improving. Fragmentation of land use, housing and transport policies can create barriers to achieving possible scale economies by better linking cities and their surrounding areas. In some cases, counties surrounding urban cores resist the expansion of mass transit to preserve property prices. These actions can effectively harm urban growth prospects in the longer term by fragmenting urban areas. The federal government addresses some of these co-ordination issues by requiring large urban areas to designate a recipient for the whole area, rather than being channelled through state budgets to separate entities. Requiring greater policy co-ordination would not only lead to better outcomes but also potentially speed up decision making by reducing the number of potential decision making bodies.
Another aspect of co-ordination is the link with health and the environment. The lack of co-ordination in urban development has led to the rise of low-density housing, which tends to lead to greater dependency on car transport (OECD, 2018[102]). This in turn can contribute to greater emissions and local air pollution, with adverse consequences for health. Compact cities tend to benefit from lower emissions due to shorter commutes, greater investment in mass transit and a more energy efficient housing stock (Leibowicz, 2017[103]). On the other hand, prioritising urban density can cause congestion in the absence of viable transport options. Furthermore, coronavirus infections have risen more quickly in urban areas revealing a vulnerability of cities that needs to be assessed alongside the productivity and amenity benefits of urban conglomeration.
Improving broadband access
A second infrastructure area with potential to boost productivity and well-being is broadband. The ongoing digital transformation of the economy altering the provision of services and consumption patterns, making broadband access a vital tool for harnessing the opportunities. Within the Unites States, the intensity of ICT use by states is correlated with higher labour productivity growth (Pabilonia et al., 2019[104]). In addition there are ancillary benefits ranging from access to education, healthcare, and financial services that would support broad coverage. Indeed, the importance of broadband in the provision of telemedicine consultations during the coronavirus outbreak as well as in access to goods and services while households are subject to shelter-in-place orders highlights the vital importance of internet access to the population.
Access to high-speed broadband is an increasingly important determinant of productivity. Empirical evidence suggests broadband penetration is associated with increased efficiency and a boost to growth. Different country experiences suggests that access and even distance from the high speed network to the business is important in determining whether a firm survives (DeStefano et al., 2019). And while face-to-face interaction and the provision of specialised services are important and support agglomeration economies in metropolitan areas, access to broadband in rural locations can expand economic opportunities in other activities. For example, broadband access could support industries as diverse as high-tech agriculture and telemedicine. In this light, the patchy development in broadband access is likely a constraint on local economic development.
In comparison with other OECD countries, access to high speed broadband is relatively modest in terms of subscriptions to fixed broadband (Figure 2.25). In part, the relatively low access to fixed broadband is related to marked differences in roll out of fixed and mobile networks across the country. Particularly for the highest-speed broadband, the variation in access to broadband across states and within states between urban and rural areas is marked (Figure 2.26). On the other hand mobile broadband subscriptions is quite high and only Japan, Finland and Estonia have more subscriptions per capita.
Figure 2.25. Subscriptions to fixed broadband are around average
OECD Fixed broadband subscriptions per 100 inhabitants, by technology, Dec-2018
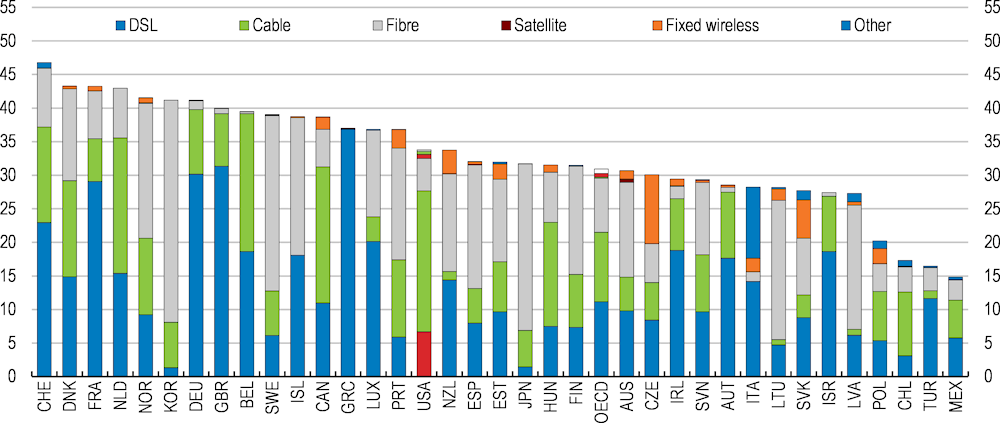
Note: Australia: Data reported for December 2018 and onwards is being collected by a new entity using a different methodology. Figures reported from December 2018 comprise a series break and are incomparable with previous data for any broadband measures Australia reports to the OECD., Data for Canada, Switzerland and United States are preliminary, Canada: Fixed wireless includes Satellite, France: Cable data includes VDSL2 and fixed 4G solutions, Italy: Terrestrial fixed wireless data includes WiMax lines; Other includes vDSL services.
Source: OECD Broadband statistics [http://www.oecd.org/sti/broadband/broadband-statistics]
Figure 2.26. Access to high-speed internet varies considerably across states
Share of population with access to high speed broadband, by State
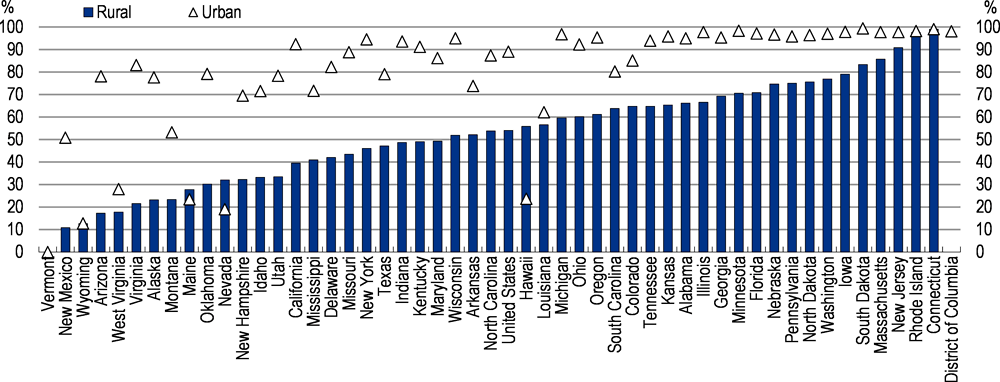
Note: Americans with access to Fixed 25 Mbps 3Mbps and Mobile LTE 10Mbps/3Mbps.
Source: Federal Communications Commission.
A number of initiatives are attempting to expand the coverage of broadband networks. However, given potentially prohibitive costs of achieving universal coverage for all locations, cost-benefit analysis or similar mechanism would ensure that available funds are put to their best use. At the national level the Federal Communications Commission (FCC) operates the Connect America Fund to improve broadband provision for all Americans including in rural areas at reasonably comparable prices. To achieve this mandate established by Congress, the FCC uses reverse auctions to allocate subsidies for expanding coverage to unserved areas at the lowest possible cost. Action to improve access to broadband is also taking place at the state level. For example, the Commonwealth of Virginia intends to use funds from the Tobacco Settlement to close the comparatively wide rural-urban divide in internet access by 2020.
Even with these efforts the financing demands are large. Particularly as 5G networks are rolled out, large fixed costs need to be borne. This may require sharing network components or co-investing to reduce overall costs (OECD, 2019[105]). Different levels of government and the competition authorities need to assess how best to ensure robust competition between infrastructure owners and other service providers. Competition policy has an important role to play. OECD experience generally suggests that competition between several network operators provides more competitive and innovative services (OECD, 2014[106]). In this light, caution is warranted when considering mergers and opportunities to encourage entry should be considered.
Box 2.6. Recommendations for enhancing worker mobility
Table 2.2. Recommendations
Key recommendations are bolded
|
FINDINGS |
RECOMMENDATIONS |
|---|---|
|
Helping workers move across the country |
|
|
Restrictive land use regulations are hindering the supply of new housing and the workers moving across the country to new job opportunities. |
Provide fiscal incentives for states and localities to relax land use restrictions and promote multi-use zoning. Disseminate information on good practice to convince localities to improve regulation. |
|
States and localities are responsible for land use planning, transportation and housing policies. When these policies are not co-ordinated inefficiencies arise that can depress productivity and |
Help states and localities better co-ordinate land-use, transportation and housing policies. Require metro mass transit fund recipients to integrate transport policy with land-use and housing policy. |
|
Infrastructure investment has been sluggish since the early 2000s. Failure to invest hinders productivity growth and reducing the accessibility of cities, which help |
Invest in new telecommunication infrastructure where supported by appropriate evaluation such as cost benefit analysis. Improve the maintenance of the road network. Invest more in mass transit where cost effective. Improve connectivity with the roll out of broadband access. Ensure competition in the broadband market. Make wider use of cost-benefit analysis |
|
Households are able to move to opportunities in different neighbourhoods, but often face sizeable information asymmetries in making choices |
Provide additional help for low-income families when they can move to opportunity. Roll out the mobility demonstration project if successful |
References
Ahrend, R., E. Farchy, I. Kaplanis, I. and A. Lembcke (2017), “What Makes Cities More Productive? Evidence from Five OECD Countries on the Role of Urban Governance”, Journal of Regional Science, 57(3), pp. 385-410.
Ahrend, R. and A. Schumann (2014), “Does Regional Economic Growth Depend on Proximity to Urban Centres?”. OECD Regional Development Working Papers, No. 2014/07, OECD Publishing, Paris.
Albouy, D. and G. Ehrlich (2018) “Housing Productivity and the Social Cost of Land-use Restrictions”. Journal of Urban Economics, Volume 107, pp. 101-120.
Arnosti, N. and A. Liu (2018), Why Rural America Needs Cities. Brookings Institution.
Autor, D. (2019), “Work of the Past, Work of the Future”, American Economic Review Papers and Proceedings, Vol 109, pp. 1-32.
Autor, D., C. Palmer and P. Pathak (2014), “Housing Market Spillovers: Evidence from the End of Rent Control in Cambridge, Massachusetts”, Journal of Political Economy, 122(3), pp. 661-717.
Bayoumi, T. and J. Berkema (2019), “Stranded! How Rising Inequality Suppressed US Migration and Hurt Those Left Behind”, IMF Working Papers, No. 2019/122.
Bergman, P., R. Chetty, S. DeLuca, N. Hendren, L. Katz and C. Palmer (2019), “Creating Moves to Opportunity: Experimental Evidence on Barriers to Neighborhood Choice”, NBER Working Papers, No. 26164.
Blanchard, O. and L. Katz (1992), “Regional Evolutions”, Brookings Papers on Economic Activity, 23(1), pp. 1-76.
Braunerhjelm, P., D. Ding and P. Thulin (2016), “Labour as a Knowledge Carrier: How Increased Mobility Influences Entrepreneurship”, Journal of Technology Transfer, 41(6), pp. 1308-1326.
Busso, M., J. Gregory and P. Kline (2013), “Assessing the Incidence and Efficiency of a Prominent Place Based Policy”, American Economic Review, 103(2), pp. 897-947.
Caldera Sánchez, A. and D. Andrews (2011), “Residential Mobility and Public Policy in OECD Countries”, OECD Journal: Economic Studies, Volume 2011.
Caldera Sánchez, A. and A. Johansson (2011), “The Price Responsiveness of Housing Supply in OECD Countries”, OECD Economics Department Working Papers.No. 837, OECD Publishing, Paris.
Dastrup, S., M. Finkel, K. Burnett and T. de Sousa (2018), Small Area Fair Market Rent Demonstration Evaluation Final Report, U.S. Department of Housing and Urban Development | Office of Policy Development and Research.
Davis, S. and J. Haltiwanger (2014), “Labor Market Fluidity and Economic Performance”, NBER Working Paper, No. 20479.
Decker, R., J. Haltiwanger, R. Jarmin and J. Miranda (2018), “Changing Business Dynamism and Productivity: Shocks vs. Responsivenes”s. NBER Working Paper, No. 24236.
DeStefano, T., R. Kneller and J. Timmis (2019), “Cloud Computing and Firm Growth”, University of Nottingham Productivity and Technology Programme Research Paper Series, No. 2019/09.
Dillman, K.-N., K. Horn and A. Verrilli (2017), “The What, Where, and When of Place-Based Housing Policy’s Neighborhood Effects”, Housing Policy Debate, 27(2), pp. 282-305.
Edmiston, K. (2012), “Nonprofit Housing Investment and Local Area Home Values”, Economic Review: Federal Reserve Bank of Kansas City, Vol. 97 (1).
Emrath, P. (2016), Government Regulation in the Price of a New Home. National Association of Home Builders.
Foster-McGregor, N. and J. Pöschl (2016), “Productivity Effects of Knowledge Transfers through Labour Mobility”, Journal of Productivity Analysis, 46(2-3), pp. 169-184.
Ganong, P. and D. Shoag (2017), “Why Has Regional Income Convergence in the U.S. Declined?”, Journal of Urban Economics, Vol. 102, pp. 76-90.
Glaeser, E. and J. Gyourko (2018), “The Economic Implications of Housing Supply”, Journal of Economic Perspectives¸ Vol. 32(1), pp. 3-30.
Haltiwanger, J., H. Hyatt and E. McEntarfer (2018), “Who moves up the job ladder?”. Journal of Labor Economics, 36(S1), pp. S301-S336.
Hornbeck, R. and E. Moretti (2018), “Who Benefits from Productivity Growth? Direct and Indirect Effects of Local TFP Growth on Wages, Rents and inequality”, NBER Working Paper, No. 24661.
Hsieh, C.(2015), “Policies for Productivity Growth”, Global Dialogue on the Future of Productivity Growth Background Paper, OECD.
Hsieh, C. and E. Moretti (2019), “Housing Constraints and Spatial Misallocation”, American Economic Journal: Macroeconomics, Vol. 11 (2), pp. 1-39.
Mast, E. (2019) . “The Effect of New Market-Rate Housing Construction on the Low-Income Housing Market”. Upjohn Institute Working Paper, No. 19-307.
Nunn, R., J. Parsons and J. Shambaugh (2019), Nine Facts about State and Local Policy, The Hamilton Project.
OECD (2012), The Chicago Tri-State Metropolitan Area, United States 2012. OECD Territorial Reviews, OECD Publishing, Paris.
OECD (2014), “Wireless Market Structures and Network Sharing”, OECD Digital Economy Papers, No. 243, OECD Publishing, Paris.
OECD (2017), Land-use Planning Systems in the OECD: Country Fact Sheets, OECD Publishing, Paris.
OECD (2017), The Governance of Land Use in OECD Countries: Policy Analysis and Recommendations, OECD Publishing, Paris.
OECD (2019), Enhancing Access and Connectivity to Harness Digital Transformation, OECD Publishing, Paris.
OECD, 2019. OECD Regional Outlook 2019: Leveraging Megatrends for Cities and Rural Areas. OECD Publishing, Paris.
Pabilonia, S., M. Jadoo, B. Khandrika, J. Price and J. Mildenberger (2019), “BLS Publishes Experimental State-level Labor Productivity Measures” Monthly Labor Review, June 2019.
Rappaport, J. (2018), “The Faster Growth of Larger, Less Crowded Locations”, Economic Review: Federal Reserve Bank of Kansas City, Vol. 103 (4).
Sarzynski, A., G. Galster and L. Stack (2014), “Evolving United States Metropolitan Land Use Patterns” Urban Geography, Vol. 51 (1), pp. 25-47.
Schwartz, H., L. Ecola, K.Leuschner and A. Kofner (2012), Is Inclusionary Zoning Inclusionary? A Guide for Practitioners, Technical Report, RAND Corporation.
Severen, C. (2018) “Commuting, Labor, and Housing Market Effects of Mass Transportation: Welfare and Identification” Federal Reserve Bank of Philadelphia Working Paper. No. 18-14.
Severen, C. and A. Plantinga (2018), “Land-use Regulations, Property Values, and Rents: Decomposing the Effects of the California Coastal Act”, Journal of Urban Economics, Volume 107, pp. 65-78.
Shertzer, A., T. Twinam and R. Walsh (2018), “Zoning and the Economic Geography of Cities”, Journal of Urban Economics, Vol 105, pp. 20-39.
Teske, P. and C. Provost (2013), “State Regulatory Policy”. in The Oxford Handbook of State and Local Government, ed. D. Haider-Markel, Oxford University Press.