The European Green Deal (EGD), with the associated Farm-to-Fork and Biodiversity Strategies, provide a new context for the EU Common Agricultural Policy (CAP). They embrace a broad food systems approach, responding to new demands for environmental sustainability. This chapter benchmarks outcome performance in the European Union against other OECD and non-OECD countries. Agricultural productivity is growing, but slower than in other countries and not always associated with an improved sustainability performance. A key challenge for the EU agro-food sector is ensuring that innovation can be successfully mobilised to improve resource efficiency and reduce farm-level production costs, to reconcile economic and environmental sustainability in the long term.
Policies for the Future of Farming and Food in the European Union

1. Policy objectives and outcome performance
Abstract
Key messages
With the European Green Deal (EGD), the European Union aims to make Europe climate‑neutral and protect its diverse natural habitats and transform the European economy. The Farm to Fork (F2F) and the Biodiversity Strategies include six agriculture and rural development targets to be achieved by 2030.
The Common Agricultural Policy (CAP), representing about one-third of the EU budget, is playing an important role in operationalising the EGD vision and objectives in agriculture. The core of the CAP 2023-27 was approved before the EGD. It takes a performance-based approach around ten specific objectives, with more flexible implementation by Member States compared to previous CAP reforms. These objectives are consistent with the broader desired outcomes under the OECD Agro-Food Productivity-Sustainability-Resilience (PSR) Policy Framework.
The European Union has maintained moderate agricultural total factor productivity (TFP) growth rates, ranging between 0.7% and 1.4% per year since the 1980s. This is on par with the international average, but in the 2011-19 period, TFP growth was below the world average. Most of the gains in TFP result from improved labour productivity.
Since the 1960s, pre-2004 Member States (EU14) have maintained a high TFP growth driven by steady labour declines. In the last decade, their TFP growth has slowed down while it has strongly accelerated in the post-2004 Member States (EU13) thanks to a fast increase in output growth and a stable growth of input use.
Overall, agriculture in the European Union has successfully achieved a partial decoupling of direct greenhouse gas (GHG) emissions from production levels, but absolute emissions have been stable rather than falling in recent years.
During the last 20 years, agricultural areas have suffered severe biodiversity losses. Furthermore, despite a recent decline, EU27 nitrogen per hectare levels still exceed critical limits, leading to adverse effects on the environment. Annual pesticide sales remained relatively stable between 2011 and 2019, with increased levels of production and the purchase of less hazardous substances.
The EGD ambition may have short-term negative impacts on the economic sustainability of the agriculture sector. These impacts may be counteracted in the long term if the new innovations can be successfully mobilised to improve resource efficiency and reduce farm-level production costs.
The European Commission presented its proposal for the new CAP 2021-2027 reform in June 2018, introducing a new way of working to modernise and simplify the European Union’s policy on agriculture. The EGD was presented by the newly elected Commission a year and a half later, in December 2019. This chapter first outlines the scope of this review and provides an overview of the main EU agricultural and food policy objectives (Section 1.1). It then provides an assessment of EU trends in agricultural productivity (Section 1.2) and agri-environmental (Section 1.3) performance. Section 1.4 provides insights on future challenges of reconciling economic and environmental dimensions of sustainability in EU agriculture. Annex 1.A includes a more detailed analysis of the agri-environmental performance of EU Member States.
1.1. Frame and scope of this review
Agriculture plays a critical role as a sector that manages half of the European land surface and contributes to more than a tenth of GHG emissions. The European agro-food system must address the triple challenge facing food systems: ensuring food security and nutrition, providing livelihoods for actors in the food chain and improving environmental sustainability. Tackling this triple challenge is more difficult in the new policy context of growing environmental concerns and successive global crises. The systemic shock of the COVID-19 crisis, the war in Ukraine, and the need to halt and reverse the loss of ecosystem services and to adapt to climate change make improving resilience to unforeseen shocks and environmental sustainability even more urgent.
The EGD aims to accelerate progress to make Europe climate-neutral and protect its diverse natural habitat. The EGD was defined as a “new growth strategy that aims to transform the European Union into a fair and prosperous society, with a modern, resource-efficient and competitive economy where there are no net emissions of greenhouse gases in 2050 and where economic growth is decoupled from resource use” (EC, 2019[1]). As the policy environment evolves towards being progressively structured towards sustainability objectives, the CAP is increasingly important to operationalise the vision and objectives of the EGD for the farming and food sector because of the financial resources associated with it (Box 1.1).
The objective of this review is twofold. First, it examines to what extent past EU policy instruments and interventions (as in place until 2022), including national measures in some Member States, enhanced the productivity, sustainability and resilience of the European Union’s food and agriculture sector. Second, since the EGD has created a new scenario for the future CAP, this review looks at the CAP 2023-27 architecture, objectives and interventions with respect to their readiness to include new roles and functions coherent with the EGD objectives to propose change in the following CAP programming period.
Box 1.1. Objectives of the European Union’s Common Agricultural Policy
The Common Agricultural Policy (CAP) is the first common policy adopted by the European Union (EU) under the Treaty establishing the European Economic Community (the Treaty of Rome) in 1957 (Article 38). It is based on three principles: a common market, community preference and financial solidarity. Since its implementation in 1963, the CAP has evolved in response to domestic pressures, including changes in agricultural policy priorities, efficiency improvements and budget constraints, and to international pressures to reduce trade distortions. Nevertheless, the following CAP objectives set out in the Treaties have not changed since its creation:
a) to increase agricultural productivity by promoting technical progress and by ensuring the rational development of agricultural production and the optimum utilisation of the factors of production, in particular labour
b) thus to ensure a fair standard of living for the agricultural community, in particular by increasing the individual earnings of persons engaged in agriculture
c) to stabilise markets
d) to ensure the availably of supplies
e) to ensure that supplies reach consumers at a reasonable price.
However, Article 5 of Regulation (EU) No. 2021/2115 states a significantly broader set of objectives for the CAP 2023-27. The new CAP shall aim to further improve the sustainable development of farming, food and rural areas and shall contribute to achieving the following general objectives in the economic, environmental and social spheres, which will contribute to the implementation of the 2030 Agenda for Sustainable Development:
a) to foster a smart, competitive, resilient and diversified agricultural sector ensuring long-term food security
b) to support and strengthen environmental protection, including biodiversity, and climate action and to contribute to achieving the environmental and climate-related objectives of the Union, including its commitments under the Paris Agreement
c) to strengthen the socio-economic fabric of rural areas.
Source: EU (2021[2]).
1.1.1. Assessing past EU agricultural policies through the OECD PSR Framework
The OECD Agro-Food Productivity-Sustainability-Resilience Policy Framework (OECD, 2020[3]) (the “PSR Framework”) is used to frame the analysis and assess to what extent the European Union has achieved the objectives of its past agricultural policy. The PSR Framework captures the main objectives of the 2016 OECD Declaration of the Agricultural Ministers as it helps advise countries on the policy mix that can best contribute to enhancing the productivity, sustainability and resilience of their food and agriculture sector.
Since 2015, the OECD has applied different iterations of the PSR Framework in 13 in-depth country reviews, with 12 “Innovation, agriculture productivity and sustainability reviews”, and the application of the most recent version of the PSR Framework to Norway (OECD, 2021[4]). These reviews identified how countries’ policy settings addressed productivity, sustainability and resilience challenges and how they could be improved (OECD, 2019[5]). In the context of this review, the PSR Framework has been adapted to analyse the specific current policy challenges and opportunities for the European Union (Figure 1.1).
The PSR Framework implements an evidence-based approach built on indicators, including the OECD’s Producer Support Estimate (PSE) and its composition by support categories (OECD, 2022[6]), as well as on the OECD agri-environmental indicators (OECD, 2019[7]). This review also relies on OECD work on Agricultural Total Factor Productivity (Bureau and Antón, 2022[8]) and uses the OECD Recommendation of the Council on Water (OECD, 2016[9]) as a reference.
The OECD PSR Framework and indicators not only help analyse the policy tools adopted to achieve objectives for the sector and to track progress, but also provide insights on the relationship between different objectives. That is, some policies may not only be inefficient at reaching their objective, they may also undermine progress on others. The PSR Framework can help identify appropriate policy packages to efficiently target multiple objectives.
The PSR Framework identifies innovation, structural change, natural resource use and climate change as the drivers of productive, sustainable and resilient agro-food systems, and considers how they are affected by policy incentives. The framework emphasises synergies and coherence between policy areas and avoids contradictory policy signals. Such coherence is fundamental to achieving a more productive and sustainable food and agriculture sector, which is also prepared for and resilient to future shocks.
Figure 1.1. OECD Agro-Food Productivity-Sustainability-Resilience Policy Framework
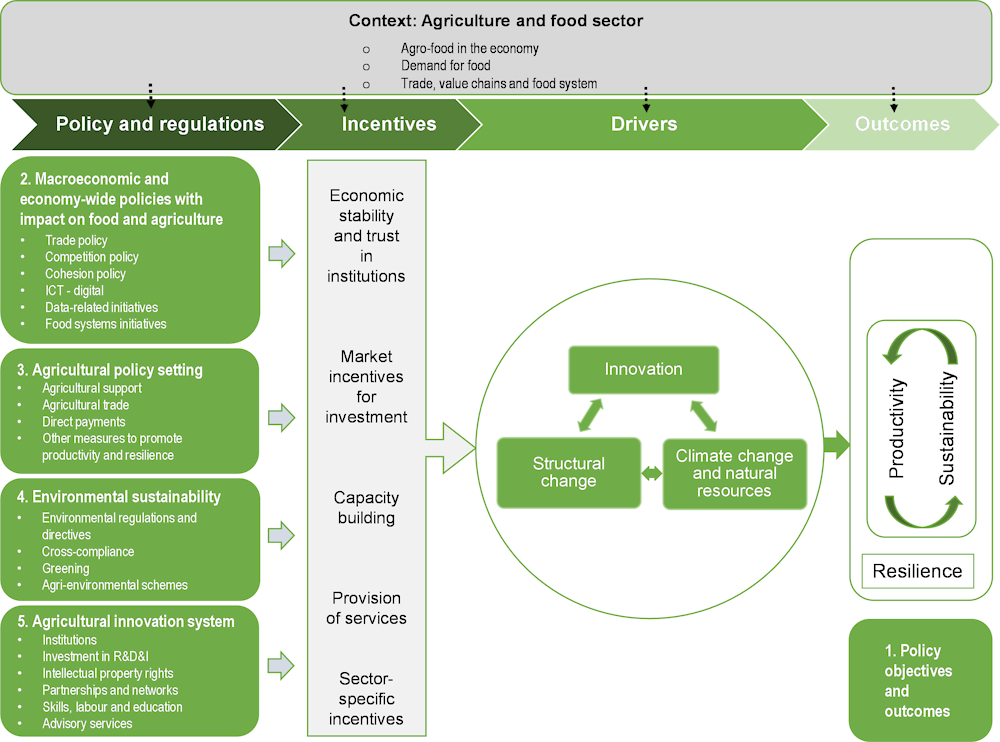
Note: The five light green boxes correspond to the five chapters of the review. Chapter 2, besides economy-wide policies, also discusses the context of the European Union agro-food sector and the three drivers of change.
Source: Adapted from Figure 1 in OECD (2020[3]).
In the context of this review, the PSR Framework was mainly used to examine EU policy instruments, but in order to complement and integrate the policy analysis, additional data and information were gathered through two online surveys with EU Member States: one on the key design features of the agri-environmental schemes (results are presented in Chapter 4, Section 4.3.4) and one on key features of Member States’ agricultural innovation systems (the main results are included in Chapter 5 and the objectives and contents of the two surveys are described in Annex 1.B). While the analysis covers the series of agricultural policy reforms implemented over the period 1986‑2020 and focuses in particular on reforms since 1992, a more detailed analysis was carried out for measures adopted during the 2014-20 programming period.
1.1.2. Exploring the challenges for EU agricultural policies in the context of the European Green Deal
The European Green Deal (EGD) is the blueprint for making the European Union the first climate‑neutral continent by 2050. To get there, the 27 EU Member States pledged to reduce emissions by at least 55% by 2030, compared to 1990 levels. The EGD consists of a set of proposals made by the European Commission for a wide range of policies, including a strong role for the Common Agricultural Policy (CAP) (EC, 2019[1]).
The Farm-to-Fork (F2F) and Biodiversity Strategies, both adopted in May 2020, are additional strategies within the EGD with implications for agriculture and food. The F2F Strategy (EC, 2020[10]) aims to address the challenges of sustainable food systems by recognising the links between healthy people, healthy societies and a healthy planet. The strategy is also central to the European Commission’s agenda to achieve the United Nations’ Sustainable Development Goals (SDGs). The strategy highlights that “a sustainable food system will be essential to achieve the climate, biodiversity and other environmental objectives of the Green Deal, while improving the incomes of primary producers and reinforcing the EU’s competitiveness”. The Biodiversity Strategy (EC, 2020[11]) is another key component of the EGD with direct linkages to the agricultural sector. This strategy is a long-term plan to protect nature, reverse the degradation of ecosystems and build resilience to future threats (including the impacts of climate change, forest fires and disease outbreaks.
The F2F and the Biodiversity Strategies include six agriculture and rural development targets to be achieved by 2030:
reduce by 50% the overall use and risk of chemical pesticides and by 50% more hazardous pesticides
have at least 25% of the European Union’s agricultural land under organic farming and a significant increase in organic aquaculture
reduce by 50% sales of antimicrobials for farmed animals and in aquaculture
reduce nutrient losses by at least 50% while ensuring no deterioration in soil fertility; this will reduce the use of fertilisers by at least 20%
bring at least 10% of agricultural area under high-diversity landscape features
achieve 100% access to broadband Internet in rural areas (by 2025).
In addition to the F2F and Biodiversity Strategies, the European Commission adopted a series of legislative proposals under the EGD to transform the European Union into a net zero emissions economy by 2050 (the Fit for 55 package). In particular, EU Regulation 2021/1119 (the so‑called European Climate Law) sets into law the goal set out in the EGD for Europe’s economy and society to become climate-neutral by 2050. It also sets the intermediate target of reducing net GHG emissions by at least 55% by 2030, compared to 1990 levels. The European Commission is also revising several pieces of EU climate legislation, including the EU Emissions Trading System, the Effort Sharing Regulation, transport and land-use legislation, and setting out how to reach EU climate targets under the EGD. Although agriculture was not specifically mentioned in the European Climate Law, in June 2021, the European Commission presented proposals on legislative tools to deliver on the targets agreed upon in the European Climate Law, paying ample attention to both the agriculture and the land use, land-use change and forestry (LULUCF) sectors. By 2035, the European Union aims to reach climate neutrality in the LULUCF sector, including also agricultural non-CO2 emissions, such as those from fertiliser use and livestock. The European Commission’s proposed revisions to the LULUCF Regulation aim at merging the LULUCF sector with non-CO2 emissions from agriculture within the Regulation’s accounting system by 2031, which would become the agriculture, forestry and other land‑use (AFOLU) sector (Chapter 4, Section 4.2.1). While the provisional political agreement on changes to the LULUCF Regulation is not yet publicly available,1 the Commission will submit an additional report in 2023 on whether non-CO2 GHG emissions from agriculture should be included in the scope of the LULUCF Regulation.
Some of the F2F targets, such as reducing the overall use of pesticides, fertilisers and antimicrobials, are directly related to water quality. Overall, the strategy aims to align the goals and requirements of water legislation and other EU directives that have an impact on the quality of drinking water resources, in particular, the Water Framework Directive, the Nitrates Directive and the Sustainable Use of Pesticides Directive (Chapter 4, Section 4.2.4). At the same time, the F2F does not seem to address the sustainable management of water resources systemically. It also does not directly address the challenge of securing water supplies in a scenario characterised by increasingly recurrent drought and the excessive water abstraction for irrigation purposes that may cause local problems to the security of the drinking water supply.
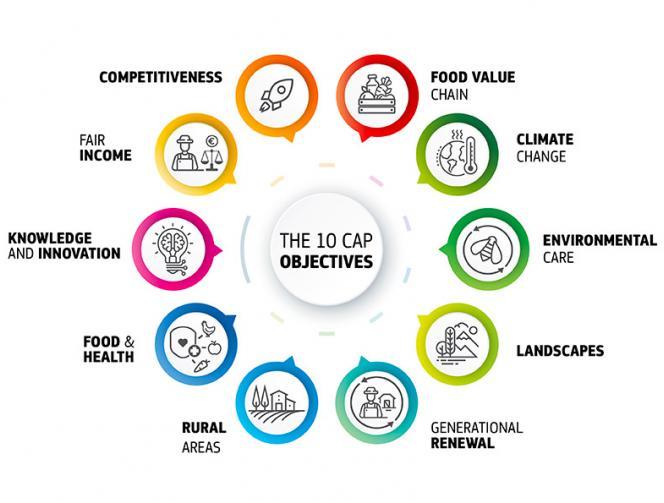
The European Commission presented its proposal for the CAP 2023-27 reform in 2018, introducing a new way of working to modernise and simplify the European Union’s policy on agriculture (EC, 2021[12]). The CAP 2023-27 is based on a more flexible implementation by Member States that considers local conditions and needs, with a performance-based approach seeking to increase the European Union’s ambitions in terms of sustainability. It is built around ten specific objectives (Figure 1.2), which are also the basis upon which EU Member States have designed their CAP strategic plans (CSPs). Such objectives are linked to common EU goals for social, economic and environmental sustainability in agriculture and rural areas (Chapter 3 includes a more comprehensive analysis of CAP objectives and instruments).
In June 2021, the European Commission published a communication with its vision for stronger, connected, resilient and prosperous rural areas by 2040 (EC, 2021[13]). Although this is not a legislative proposal and there is no reference to it in the CAP 2023-27 regulations as it was adopted after negotiations were concluded, it introduces an innovative, collaborative process that may play a role in involving relevant stakeholders in the delivery of some of the EGD’s objectives: the “rural pact” (EC, 2022[14]), which aims at mobilising public authorities and stakeholders to respond to the needs and aspirations of rural communities. The proposed vision also came with an EU rural action plan, to mainstream rural actions across a range of EU policies, including actions to create new employment opportunities and better access to infrastructure and services. As part of this action plan, a mechanism was put in place in 2022 and is being implemented to assess whether major EU legislative initiatives are “rural-proof”, and a rural observatory (EU, 2022[15]) was launched to centralise, valorise and analyse data on rural areas.
Many of the EGD’s targets are not yet enshrined in legislation and there are no legal links between the CAP and the F2F and Biodiversity Strategies’ targets. Moreover, so far, the EGD and related strategies have not been endorsed by the European Council and European Parliament and represent the views of the Commission only. Nevertheless, the CAP 2023-27 regulation on CSPs states that “When assessing the proposed CAP strategic plans, the Commission should assess the consistency and contribution of the proposed CAP strategic plans to the Union’s environmental and climate legislation and commitments and, in particular, to the Union targets for 2030 set out in the F2F and Biodiversity Strategies” (see Chapter 3 for further details). It is evident that the EGD has created a new framework for the future of EU agricultural policies. It also calls for new roles and functions for the CAP, which need to be scrutinised and analysed in a new light.
Figure 1.2. The specific objectives of the Common Agricultural Policy 2023-27
Source: EC (2021[12]).
While not all of the ten objectives of the CAP reported in Figure 1.2 are included specifically in the PSR Framework and associated indicators (especially those referring to rural areas and societal demands on food and health), the fundamental goals of the CAP 2023-27 – including those established by the F2F Strategy, the Biodiversity Strategy and the Climate Law – are reflected in PSR outcomes (Figure 1.3).
Figure 1.3. The CAP 2023-27 objectives through the OECD Agro-Food PSR lens
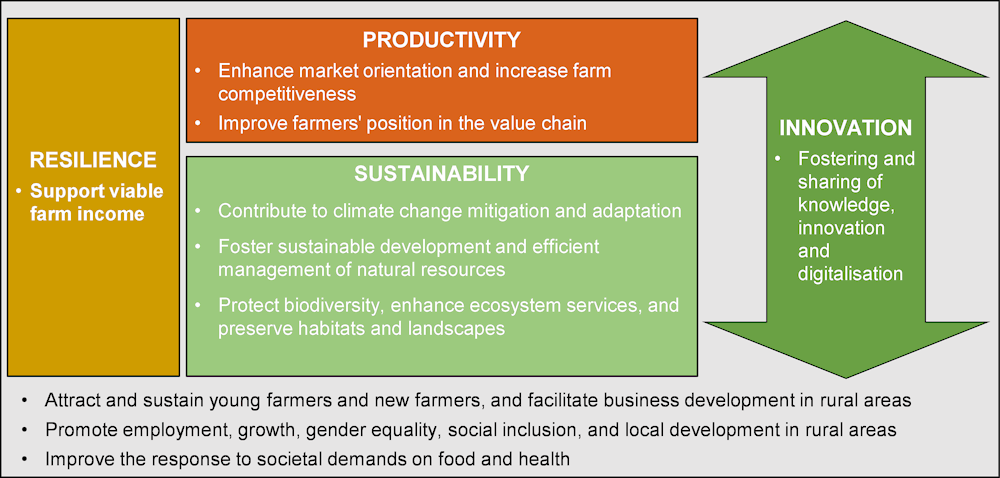
Source: Authors’ elaboration based on EC (2021[12]).
1.2. Benchmarking productivity performance in the European Union
Broadly, the key objectives of the CAP are consistent with the OECD PSR Framework and reflected in the related set of indicators that have been used to benchmark the productivity and sustainability of the EU farming sector. The core indicators used to measure outcomes in the PSR framework include: Total Factor Productivity (TFP) growth; and agri-environmental indicators such as nitrogen and phosphorus balances, agricultural GHG emissions, on-farm energy consumption, and the Farmland Bird Index.
TFP,2 which measures the change in the ability of the sector to produce more with less, is an important indicator of performance to achieve these policy objectives. For example, TFP has played an important role in decreasing the emissions intensity of agricultural production (i.e. emissions per unit of output). TFP growth reflects the ability of the sector to use agricultural inputs more efficiently (higher output per kilogramme of fertiliser, per animal, per kg of animal feed, and per litre of fuel or kilowatt of electricity) and avoid harmful land-use changes (higher output per hectare of cropland or pasture) (OECD, 2022[6]). The PSR Framework (OECD, 2020[3]) includes an analysis of output growth and its components as a main tool to provide useful insights on productivity and sustainability performance in the long term. Combining TFP numbers with agri-environmental indicators such as on GHG emissions and nutrient balances provides additional insights into how productivity affects environmental performance.
1.2.1. Agricultural output and productivity growth
Productivity growth is a useful performance indicator, not only for the sector’s contribution to food security objectives but also for creating economic value for farms and for the competitiveness of the farming sector. OECD agri-environmental indicators can be used to assess the European Union’s environmental sustainability objectives, including climate change mitigation and adaptation, the efficient management of natural resources, and the preservation of biodiversity.
Productivity growth is also desirable because more efficient use of resources responds to the desire to strengthen sector competitiveness by ensuring a viable income for farmers as well as creating new businesses and job opportunities. Equally, productivity improvements that reduce input use can help achieve the European Union’s sustainability objectives. Furthermore, a deteriorating natural resource base may reduce the production system’s resilience to climate variability and depress present and future productivity.
Agricultural output growth in the European Union3 has weakened since the 1960s. The European Union has not maintained the strong growth rates achieved in the 1960s (2.0% per year on average; Figure 1.4) and 1961-2010 was characterised by a steadily declining pace of output growth, which became even slightly negative in the 2000s. Following a similar pattern as other countries like Japan, output growth has accelerated again recently (2011-19), while remaining weak compared to other countries (e.g. 0.6% compared to 1.6% per year in the United States). The performance of the United States in terms of output expansion has been mostly strong throughout the last six decades.4
Figure 1.4. Decomposition of output growth in the European Union, the United States, the United Kingdom, and Japan, 1961 to 2019
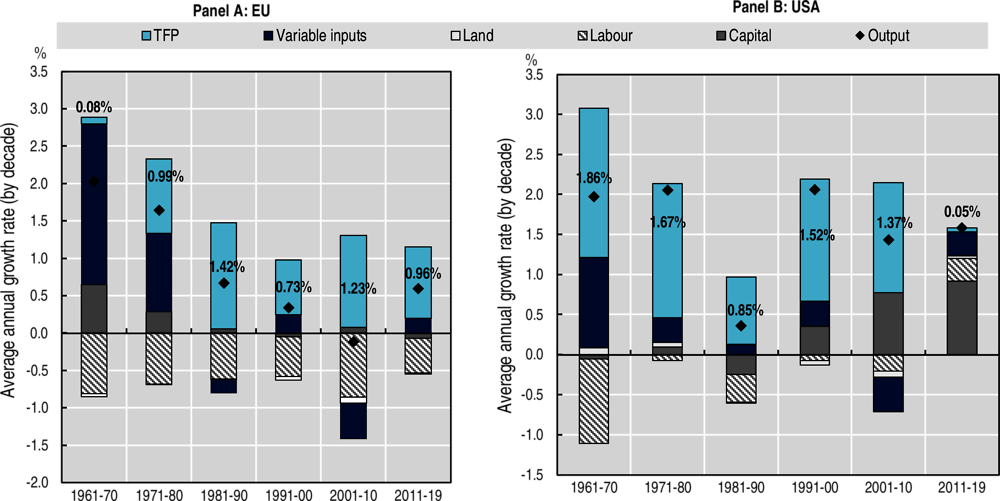
Notes: TFP: total factor productivity. Total annual agricultural output growth is calculated as an average for each of the six decades. Growth rates for TFP and inputs are expressed as contributions to the total annual growth rate so that the growth in outputs minus the growth in inputs equals TFP growth, i.e. TFP growth is the residual. Percentage values (in bold) refer to average annual TFP growth for the period. Variable inputs comprise feed and fertiliser. Capital refers to livestock and machinery.
Source: Authors’ calculations based on USDA ERS (2021[16]).
TFP growth became the main driver of production growth in the European Union in the 1980s, two decades later than in several OECD countries, such as those included in Figure 1.4, but before the world average, which saw productivity becoming the key component of output expansion only in the 1990s. The transition from a growth model largely based on intensification (use of more inputs, and especially variable inputs) to one driven by productivity growth is crucial to reduce the environmental pressures associated with increasing agricultural production (OECD, 2022[6]). Since the 1980s, the European Union has had respectable TFP performance, with growth rates ranging between 0.73% and 1.42% per year (Figure 1.4).
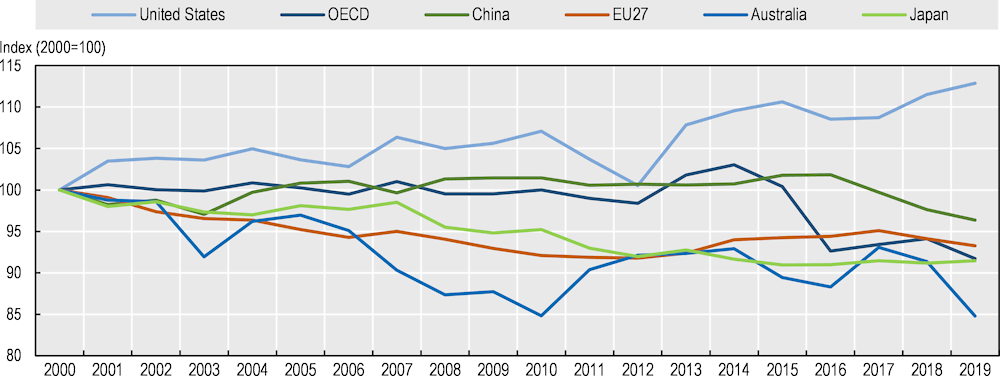
The period between 2011 and 2019 saw a worldwide slowdown in productivity growth (Figure 1.5). This was less pronounced in the European Union, where TFP growth only declined by 0.27 percentage points and settled at an average rate of 0.96% per year (Figure 1.4). By contrast, productivity growth in the United States stalled at 0.05% per year after having been largely above 1% per year in all previous decades (with the exception of the 1980s). In the United Kingdom, productivity has experienced low rates of annual growth, below 0,4%, since the 1990s, while Japan has kept productivity growing at 1% or above. TFP growth in the European Union in the 2011-19 period was below the world average of 1.3% per year but close to the OECD average of 0.9% (Figure 1.5). Some OECD countries achieved large improvements in TFP growth in the last decade while others stagnated. Japan (1.5%) and Canada (2.5%) performed well, the United Kingdom and the United States slowed, and Australia saw a decline in TFP growth.5
Figure 1.5. Growth in agricultural total factor productivity (TFP) in the European Union and selected countries
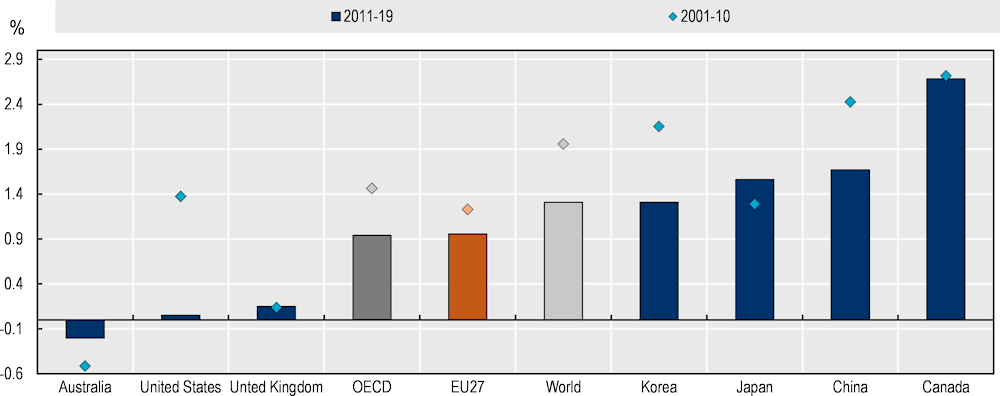
Source: Authors’ calculations based on USDA ERS (2021[16]).
1.2.2. Evolution of inputs and output growth
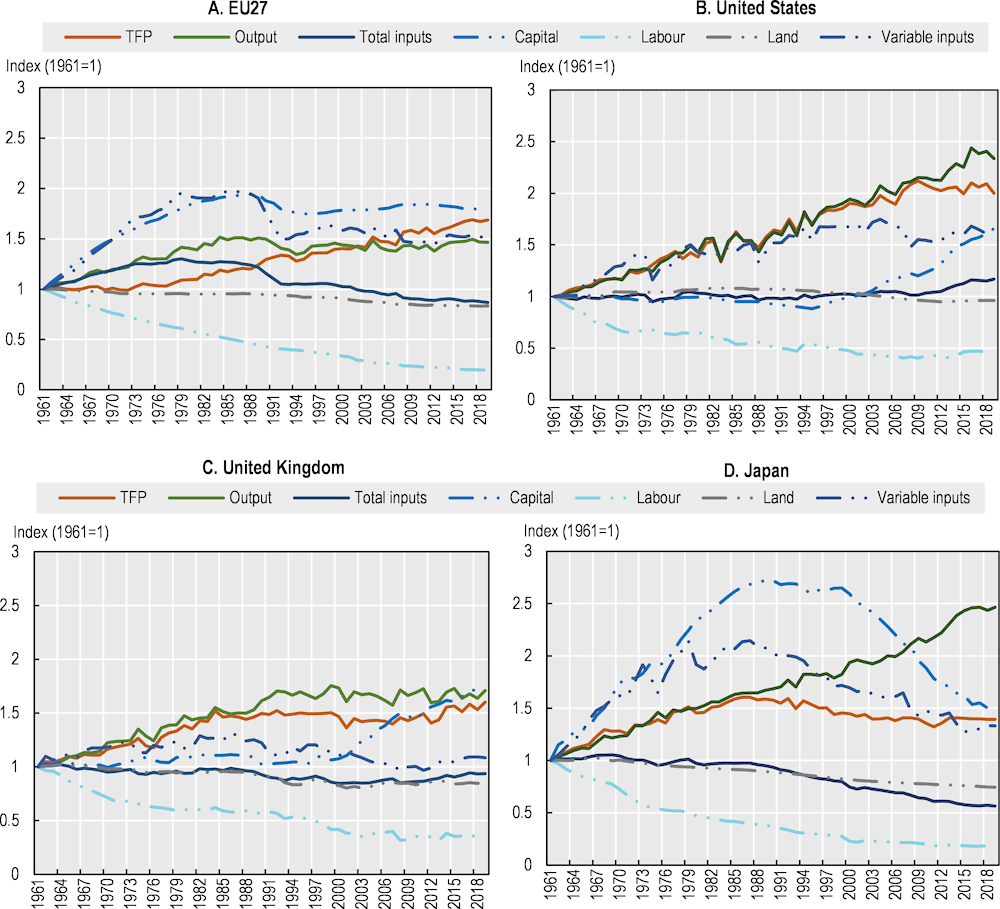
Technology improvements and gains in efficiency have driven output growth overall in the past 60 years, compensating for large reductions in labour and smaller reductions in land use. Agricultural output grew by 50% in the European Union between 1960 and 2019 while total input use, including labour, declined by 13%, resulting in a 68% increase in TFP (the rates of output and input growth were 130% vs. 17% in the United States, 143% vs. -44% in Japan and 64% vs. -6% in the United Kingdom) (Figure 1.6). In the European Union, variable inputs and capital kept pace with output growth, while land use, and particularly labour, strongly decreased. The “miracle” of producing more with less is called total factor productivity (TFP), which increased by 68%.
Labour outflows are a common feature of agricultural development. The European Union experienced a consistent and rapid outflow of labour from the agricultural sector, with an accumulated 80% reduction of agricultural labour over the last six decades (Figure 1.6), representing 4.3% of the total EU working population in 2019 (World Bank, 2023[17]; Eurostat, 2020[18]). Labour outflows occurred in parallel with structural change as the sector moved towards fewer, larger farms. As shown in Chapter 2, between 2005 and 2020, the number of EU agricultural holdings has fallen by 36%. While the number of holdings of less than 5 hectares fell by 45%, the number of farms of 100 hectares or more increased by 29%. Over this same period, the average utilised agricultural area (UAA) increased by 58%, although there is still a significant gap in average UAA per farm between EU13 and EU14 countries. Agricultural labour also declined in other OECD countries: 82% in Japan and 66% in the United Kingdom. In the United States, after a rapid reduction in the 1960s, agricultural labour fell at a slower rate in most decades, with an overall decline in the level of farm labour over the period of approximately 50% (Figure 1.6).
Figure 1.6. Evolution of output, inputs use and total factor productivity (TFP) in the European Union, the United States, the United Kingdom, and Japan, 1961 to 2019
Source: Authors’ calculations based on USDA ERS (2021[16]).
The fast outflow of labour in the European Union, comparable to that of Japan, has resulted in a steep increase in total output per worker (partial productivity of labour). In 2019, total output per worker was almost eight times higher than in 1961 (Figure 1.7). Most of the gains in TFP in the European Union were concentrated in labour productivity. This is common among most OECD countries, but in some countries like the United States, the partial productivity of land, variable inputs and capital also increased.
After modest growth in the 1960s and 1970s, the use of capital (including machinery and livestock) of European agriculture has remained mostly stable. In Japan, capital investment has fallen over the last three decades. This lack of capitalisation contrasts with the United Kingdom and the United States, where agricultural capital was rapidly built up in the last two decades, partially explaining their recent stagnant productivity growth in the period 2011-19. While reducing measured TFP growth in the short term, capital investments may result in stronger productivity improvements over time as the benefits of new technologies embedded in this capital materialise. In that regard, the limited capital investments of EU farms in the last few decades may weaken opportunities for future productivity growth.
Figure 1.7. Evolution of agricultural production, partial and total factor productivity in the European Union, 1961 to 2019
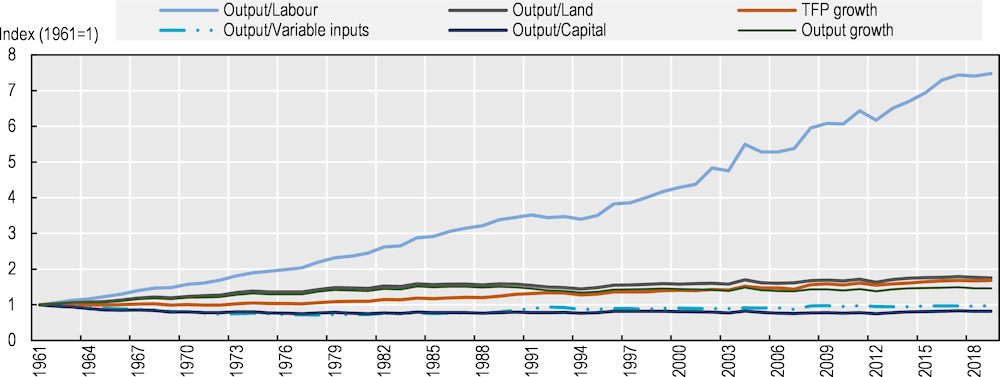
Notes: TFP: total factor productivity. EU27.
Source: Authors’ calculations based on USDA ERS (2021[16]).
Over the last 60 years, the European Union has been able to grow its agricultural output without significantly expanding the amount of land under production. Preventing further conversion of natural land to agriculture through continued productivity improvements can have important environmental benefits, especially in terms of avoided GHG emissions from land-use changes; nonetheless, the resulting intensification of production may raise other sustainability concerns, for instance in relation to soil and water pollution and biodiversity preservation (OECD, 2022[6]).
Before TFP growth became the main driver of EU output growth, increased agricultural production was driven by the growth of variable inputs (fertilisers and feed). The use of variable inputs in the EU agricultural sector nearly doubled over two decades, then stabilised in the 1980s (Figure 1.6). The slowdown in the growth of variable inputs use, together with the ongoing decline in farm labour, was reflected in accelerated TFP growth.
However, the most recent decade has exhibited a change in trend toward increasing use of variable inputs in the European Union, as well as in the United Kingdom and the United States. The European Union has not yet succeeded in decoupling output growth from the use of variable inputs, which is clearly significant in view of the F2F targets to reduce the absolute level of input use. The evolution of fertiliser use in Central and Northern Europe drove an abrupt, but short-lived, decline in variable inputs between the last years of the 1980s and the very early 1990s (Figure 1.8).6 The sharp rise and fall in fertiliser use was particularly severe in Romania, Hungary, Bulgaria, Estonia and Latvia and, where in the mid-1980s, the use of fertilisers was between four and six times higher than in 1961, before falling to, or sometimes even below, its initial level by the early 1990s.
The dramatic change in fertiliser use coincided in time with the transition process towards democracy of the former Eastern bloc and is common, to some extent, to all those countries.7 The decline in input use, especially fertilisers, was among the most evident consequences for agriculture of the socio-economic and institutional reforms implemented in the post-Communist transition from centrally planned towards market-oriented economies (Macours and Swinnen, 2000[19]). In particular, price and trade liberalisations resulted in a stark increase in the price of agricultural inputs relative to that of outputs.
Figure 1.8. Evolution of fertiliser use across European regions, 1961 to 2019
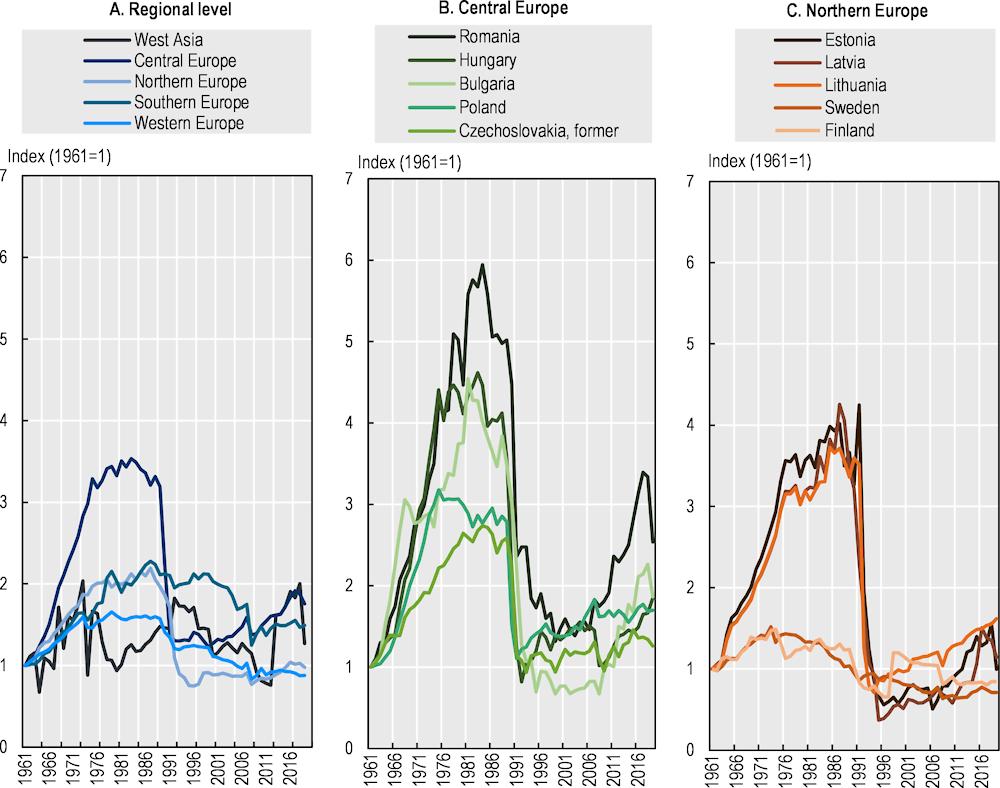
Notes: The regional categorisation of countries follows the one employed by the USDA ERS (2021[16]): West Asia, whose only EU Member State is Cyprus,1 is excluded for the purpose of greater graphical clarity. Central Europe includes the following EU Member States: Bulgaria, Croatia, the Czech Republic, Hungary, Poland, Romania, the Slovak Republic and Slovenia. Northern Europe includes Estonia, Finland, Latvia, Lithuania and Sweden. Southern Europe includes Greece, Italy, Malta, Portugal and Spain. Western Europe includes Austria, Belgium, Denmark, France, Germany, Ireland, Luxembourg, and the Netherlands. None of the countries in Eastern Europe is currently a member of the European Union.
Source: Authors’ calculations based on USDA ERS (2021[16]).
1.2.3. Differences in TFP performance across EU Member States
EU Member States experienced significantly different types of structural changes at the end of the 20th century, which is reflected in their recent productivity performance. Within the European Union, TFP growth in the period 2011-19 (Figure 1.9) ranged from an average annual decline of over 1.8% in Greece to an average improvement of over 3% per year in Portugal and Romania. The recent global slowdown in TFP growth is only partially reflected in the experience of EU Member States as several saw stronger productivity growth in the most recent decade. This was especially the case for countries that had experienced low or negative growth rates in TFP in the previous period (2001-10).8
Figure 1.9. Growth in agricultural total factor productivity in EU Member States
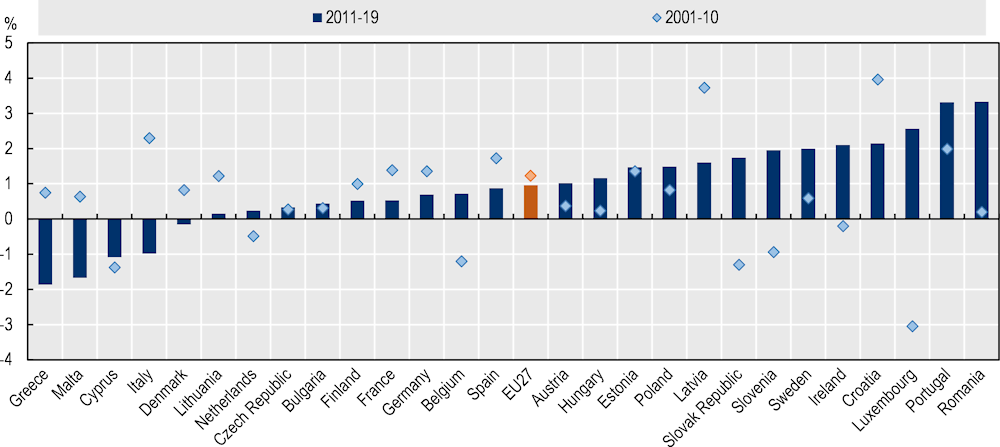
Source: Authors’ calculations based on USDA ERS (2021[16]).
A large number of countries in Central and Northern Europe, together with two Mediterranean countries (Cyprus and Malta), joined the European Union in 2004, 2007 and 2013: these newer countries are collectively called the EU13,9 while the pre-2000 Member States that joined before 2000 are called the EU14.10
It is worth comparing these two groups because of the structural changes that took place in the affected countries. The different timing of accession of these countries also implies that their exposure to European policies, in particular the CAP, was different in duration and modalities, leading to possibly diverging sectoral dynamics. Moreover, at the time of accession, agriculture was a more prominent sector (both in terms of percentage of GDP and share of employment) in the economy of the EU13 than the EU14 and significant productivity and institutional characteristics of the sector were already highlighted during the accession process (EC, 1998[20]).
Decomposing output growth in EU14 and EU13 Member States shows important differences, both in terms of the pace of output and TFP growth and in terms of the evolution of inputs use in the two areas (Figure 1.10). After rapid output expansion in the 1960s, EU13 Member States subsequently saw a deterioration of their performance and eventually a complete collapse of both output and productivity growth in the 1990s. The rebound was, however, fairly fast and, in the most recent decade, EU13 Member States achieved strong output growth (at nearly 1.8% per year on average). It was a different story in the pre-2000 EU14 Member States; the declining pace of output growth was less pronounced, and they maintained a strong pace of output expansion until the 2000s.
The productivity growth of the EU14 remained well above that achieved in the EU13 until 2010, after which this trend was reversed. In 2011-19, pre-2000 Member countries saw a slowdown in their productivity growth, in line with the broader trends at the international level, whereas TFP growth strongly accelerated in the newer Member countries, thanks to a fast increase in output growth and a stable growth level of input use.
TFP growth in the EU13 countries was almost non-existent in the 1960s and 1970s (0.02% and ‑0.06%, respectively). During this period, output growth was driven by the use of variable inputs, which grew at much faster rates than in the pre-2000 countries and reached a cumulative increase of nearly 240% in three decades before rapidly declining in the post-Communist era. EU13 Member States also experienced a faster build-up of agricultural capital, especially in the last two decades, when capital investments were stagnant or even declined in the EU14. Pre-2000 Member States have experienced steady losses of labour throughout the last six decades, whereas EU13 countries began to see significant declines only in the 2000s. Therefore, the fast decline of agricultural labour documented for the European Union was, until recently, entirely a feature of the pre-2000 Member States.
Figure 1.10. Decomposition of agricultural output growth in EU14 and EU13 Member States, 1961 to 2019
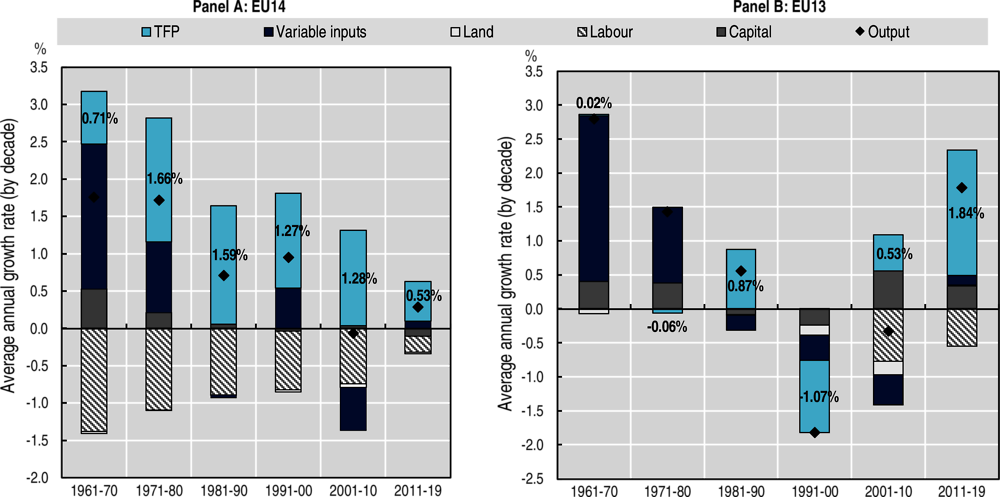
Notes: TFP: total factor productivity. Total annual agricultural output growth is calculated as an average for each of the six decades. Growth rates for TFP and inputs are expressed as contributions to the total annual growth rate so that the growth in outputs minus the growth in inputs equals TFP growth, i.e. TFP growth is the residual. Percentage values (in bold) refer to average annual TFP growth for the period. Variable inputs comprise feed and fertiliser. Capital refers to livestock and machinery.
EU14 refers to the 14 countries that joined the European Union before 2004. Due to data availability, Belgium and Luxembourg are included jointly. Therefore, the EU14 aggregate is built upon 13 data points, representing 14 Member States.
EU13 refers to the 13 countries that joined the European Union in 2004 or later. Due to data availability, the EU13 aggregate does not include Croatia or Slovenia; the Czech Republic and the Slovak Republic are included jointly. Therefore, the EU13 aggregate is built upon 10 data points, representing 11 Member States.
Source: Authors’ calculations based on USDA ERS (2021[16]).
1.3. Agri-environmental performance
Agricultural activities are associated with diffuse air, soil and water pollution and can lead to the excessive exploitation of natural resources, ecosystem degradation and loss of biodiversity. The F2F and the Biodiversity Strategies aim to reduce the impacts of the farming and food sectors on the environment while protecting natural ecosystems. This section provides an overview of the environmental performance of the EU agricultural sector through trends of selected agri-environmental indicators and the links they may have to productivity.
The OECD PSR Framework (OECD, 2020[3]) stresses the importance of achieving sustainable productivity growth. This implies enhancing the efficiency of agricultural production while reducing its negative environmental externalities. Climate change represents an especially relevant challenge for agriculture, given that the agro-food sector is both highly vulnerable to its impacts and a major contributor to global GHG emissions while also presenting considerable potential for carbon sequestration (OECD, 2020[3]; 2022[6]).
1.3.1. Agricultural greenhouse gas emissions
Direct GHG emissions from agriculture vary across countries due to differences in factors such as agricultural land area, the size of the agricultural sector, the mix of commodities produced and the structure of agricultural production. The EU27 as a whole is among the five largest emitters across the 54 countries covered in the OECD Monitoring and Evaluation report (OECD, 2022[6]), together with India, the People’s Republic of China (hereafter “China”), the United States, and Brazil.
The EU agricultural sector directly generated 383 Mt CO2-eq (million tonnes carbon dioxide equivalent) of GHG in 2020, representing 11% of total GHG emissions in the European Union. Among those, methane emissions from enteric fermentation (mainly from cattle) and manure management, as well as nitrous oxide (N2O) releases from managed soils accounted for the largest part of the sector’s emissions, at 47% and 31%, respectively11 (EEA, 2022[21]).
GHG emissions from the EU agricultural sector fell by 7% in the period 2000-19, less than the OECD average of 8% (Figure 1.11). Japan and Australia reached even higher emissions reductions of 9% and 15%, while progress was lower for China (-4%). Canada and the United States experienced deteriorating trends with GHG increases of 4% and 13%, respectively. The trend development in many countries, however, was not steady. For the European Union (and Japan and Australia), most emissions reductions occurred before 2012. In the period 2013‑17, agricultural GHG emissions increased by 4%. Recent trends show slow progress and indicate a stabilising rather than reducing emissions level. The main reason for lower GHG emissions in the European Union and other OECD countries at the beginning of the century were reductions due to falling livestock numbers from cattle, but also better use of fertilisers.
GHG emissions in the European Union have grown at a slower rate than the value of total output since the 1990s, therefore reducing the emissions intensity of its agricultural output (i.e. emissions per unit of output) (Figure 1.12).12 That is, the European Union has successfully achieved a partial decoupling of GHG emissions from production.
Figure 1.11. Greenhouse gas emissions trends from the agricultural sector in the European Union and selected countries, 2000 to 2019
Source: OECD (2022[22]).
Figure 1.12. Evolution of changes in greenhouse gas emissions intensity in the European Union, the United States and the OECD, 1991 to 2019
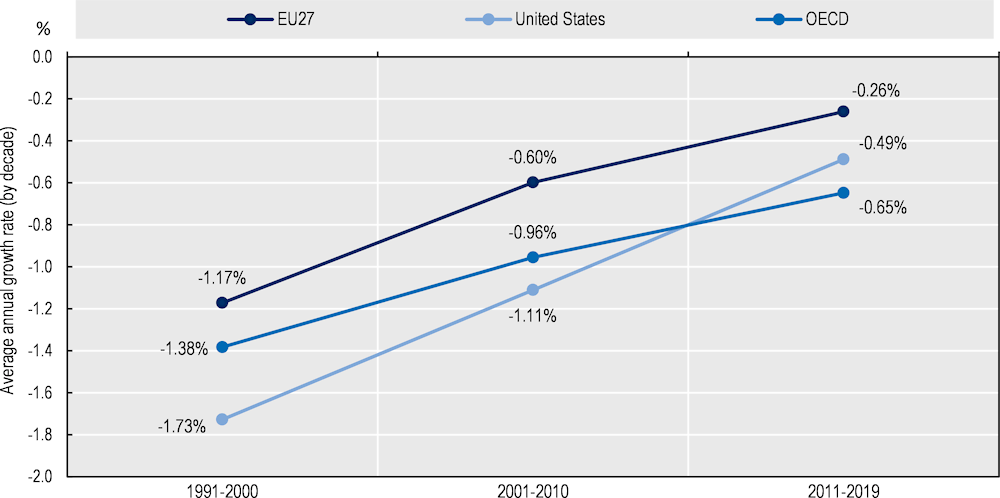
Notes: Average annual growth rates “g” are related by the following formula: g(EI)=g(EF)-g(TFP), where EI is the greenhouse gas emissions intensity and EF is the emissions factor (emissions E per total inputs X, or E/X). Partial decoupling occurs when g(EI)<0.
Source: Authors’ calculations based on USDA ERS (2021[16]); OECD (2022[22]).
Even though total GHG emissions from agriculture in the European Union declined between 1991 and 2010 and grew at a lower rate than in the United States in 2011-19, its emissions intensity declined at a slower pace (Figure 1.13). European agricultural production increased at a significantly slower pace than in the United States in all decades under consideration, even becoming negative in the period 2001-10, resulting in a slower decline in emissions per unit of output.
Figure 1.13. Decomposition of changes in greenhouse gas emissions in the European Union and the United States, 1991 to 2019
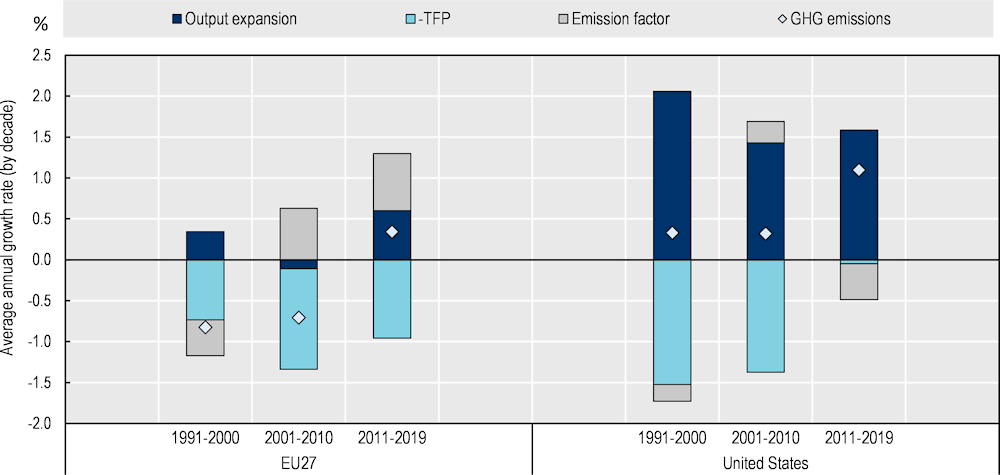
Notes: TFP: total factor productivity; GHG: greenhouse gas. Average annual growth rates “g” are related by the following formula: g(E)=g(Y)-g(TFP)+g(EF), where E is GHG emissions, Y is output and EF is the emissions factor (emissions E per total inputs X, or E/X).
Source: Authors’ calculations based on USDA ERS (2021[16]); OECD (2022[22]).
While the emissions intensity of output has continued to decline throughout the last three decades, the pace of improvement has slowed. This trend is common to the European Union, the United States and the OECD, where the pace of reduction of emissions intensity in the most recent decade was 65-80% lower than in the period 1991-2000. This lowered ability to decouple GHG emissions from agricultural output potentially represents an obstacle to achieving European climate goals.
While improvements in agricultural TFP can play a crucial role in reducing emissions intensity through the more efficient use of variable inputs and the avoidance of emissions-expanding land-use changes, TFP growth itself is not the only answer to GHG emissions. This is because TFP measures the relative expansion of output and consumption with respect to the total use of inputs, which can reflect different possible input substitution paths (OECD, 2022[6]). That is, TFP growth may reflect an innovation path privileging technologies with lower overall input use, but this reduction of input may focus on non-emitting inputs such as labour, generating a relative increase in emissions-intensive inputs.
In the period 1991-2000, EU output increased at the same time as emissions decreased (absolute decoupling).13 This decade was also the only one in which the European Union experienced a decline in its emissions factor (emissions per unit of input). Combined with a fast improvement in TFP and only a limited expansion of output, this allowed for a reduction in emissions. Despite remaining robust, TFP growth was outweighed in the most recent decade by the sum of the increase in both production and the aggregate emissions factor of inputs used, resulting in an increase in total emissions, thus not achieving absolute decoupling. However, TFP growth still exceeded growth in the aggregate emissions factor of input use and, therefore, output grew more rapidly than emissions, resulting in partial decoupling.
1.3.2. Nutrient balances
Nitrogen (N) and phosphorus (P) are essential inputs that foster soil fertility and support plant growth. Excessive nutrient inputs, however, can lead to surpluses that can contribute to air and water pollution (OECD, 2019[7]). Nutrient balances per hectare measure the difference between the amount of nutrient (N or P) applied versus that taken up in the harvested part of the plant. Nutrient surpluses can be used as a proxy to reveal the status of environmental pressures, such as declining soil fertility in the case of a nutrient deficit, or for a nutrient surplus the risk of polluting soil, water and air.
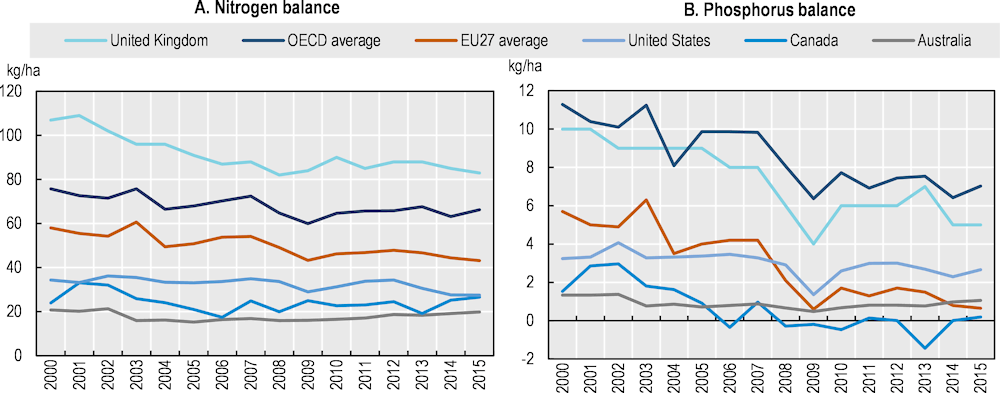
These nutrient balances show a declining trend in the EU27 in the past years. Between 2000 and 2015, nitrogen balances decreased by 26%, from an initial balance of 58 kg/ha to around 43 kg/ha (Figure 1.14). At the same time, the phosphorus balance fell significantly from 5.7 kg/ha in 2000 to 0.7 kg/ha in 2015, a reduction of more than 80%. Most progress in reduced nutrient balances occurred before 2009. Overall, despite reduced nitrogen balances per hectare, EU27 levels still exceed critical limits and pose risks of acidification and eutrophication in freshwaters, reduced richness in plant and animal species, and atmospheric emissions such as ammonia and GHGs (EEA, 2021[23]). This is particularly true in some western Europe countries (e.g. Belgium, Denmark and the Netherlands) and in some Mediterranean countries (e.g. Cyprus, Italy and Malta). Even in countries with low national averages, there can be regions with high nitrogen loadings because of agricultural intensity, such as livestock density.
Still, average nitrogen balances per hectare in the EU27 are lower than the OECD average (Figure 1.14). Nutrient balances decreased in OECD countries by 12% between 2000 and 2015. Country experiences vary significantly. The United Kingdom, for example, reports growing nitrogen balances while Australia, Canada and the United States have lower balances on the utilised agricultural area (between 36 kg/ha and 17 kg/ha) that are declining over time.
Figure 1.14. Nutrient surpluses per agricultural land area, 2000 to 2015
Note: Nutrient surpluses per agricultural land area (in hectare) are measured as the difference between the total quantity of nutrient inputs entering an agricultural system (mainly fertilisers, livestock manure) and the of nutrient outputs leaving the system (mainly uptake of nutrients by crops and grassland).
Source: OECD (2022[22]).
The declining trend in nitrogen balances in the European Union is due to improved nitrogen management practices, e.g. different fertiliser application techniques, better manure management, increased nitrogen use efficiency and thus the nitrogen uptake of plants. The total use of mineral and organic fertilisers – including manure – decreased. This trend is linked with falling livestock numbers over the period, resulting in less manure (Eurostat, 2022[24]). OECD countries reduced nitrogen balances through reduced manure inputs despite increasing their average use of fertilisers. Nitrogen balance trends do, however, vary significantly across countries due to country-specific conditions of livestock densities, crop mixes and management practices (OECD, 2019[7]).
Average phosphorus surplus in OECD countries – with levels between 11.3 kg/ha in 2000 and 7.0 kg/ha in 2015 – is above that of the EU27 average. While country-specific conditions largely drive the differing levels between countries, the reductions of phosphorus balances over time in both EU27 and OECD countries were, to a large extent, driven by less use of compound fertilisers and increased phosphorus use efficiency (OECD, 2019[7]; Schoumans et al., 2015[25]). Most countries saw lower phosphorus inputs over time, in particular in 2008-09, following a jump in the price of fertilisers.
The European Union reduced its nutrient balance per hectare (of both nitrogen and phosphorous) in both the first decade of the century (1997-99 to 2007-09 for the analysis in this section) and the most recent decade (2003-05 to 2013-15).14 In the latter period, total agricultural output grew, leading to absolute decoupling of nutrient balances from production. TFP growth was positive in the European Union during the two periods, potentially contributing to improved nutrient balances. However, there is no obvious relationship between positive TFP growth and performance on nutrient balances across Member States and other countries (Figure 1.15).
Figure 1.15. Nitrogen balances, output and total factor productivity in selected countries
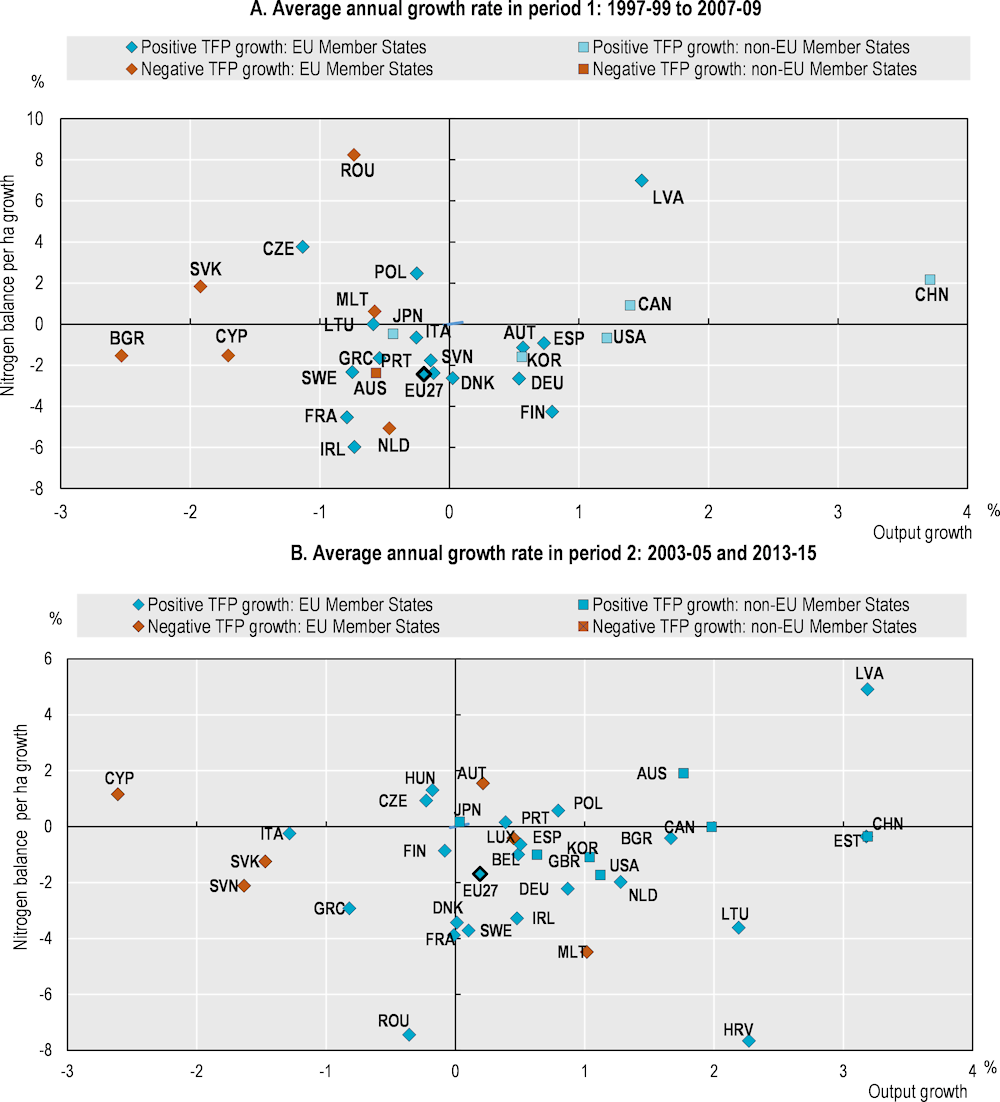
Notes: TFP: total factor productivity; ha: hectare. The value for the EU27 time series corresponds to the median of all Member States.
Source: Authors’ calculations based on USDA ERS (2021[16]); OECD (2022[22]).
1.3.3. Pesticide sales
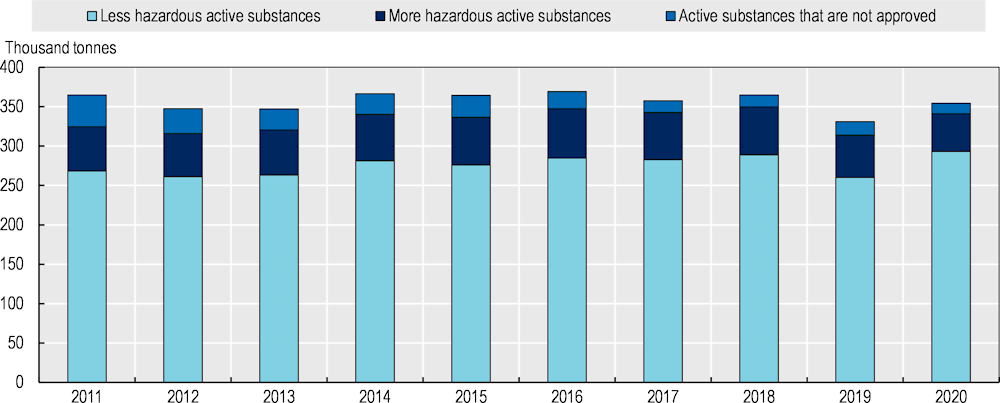
Annual pesticide sales volume in the EU27 remained stable at around 360 million kilogrammes between 2011 and 2020. Of the pesticides sold in 2019, fungicides and bactericides amounted to 40% of the total sales. Herbicides, haulm destructors and moss killers were the second-largest group (33%), while insecticides and acaricides represented 13% of sales (Eurostat, 2022[26]). In 2020, less hazardous products took the largest share of sales volume (83%), while more hazardous substances and active substances that are not yet approved represented only 13% and 4% of the sales, respectively. In the period 2011-20, sales of the more hazardous products decreased by 4.6% (Figure 1.16).
Despite a reduction in the number of high-risk substance sales, the presence of pesticides in the environment remains a major problem in Europe (EEA, 2021[27]). Various factors influence the sales volume of pesticides, including, for example, climatic conditions, farm profitability and crop types. A transition towards a more sustainable use of pesticides is not only hindered by socio-technical conditions of farmers engaging in high pesticide farming systems but also by the slow pace of approval and lack of farm advisory support for biopesticides and other means of biocontrol.
Figure 1.16. Pesticide sales in the European Union by categorisation of active substances, 2011 to 2020
Note: Less hazardous substances include low-risk active substances (Group 1 of the Eurostat categorisation) and all the other approved substances other than the more hazardous active substances (Group 2 of the Eurostat categorisation). More hazardous substances are the active substances that meet cut-off criteria or are identified as candidates for substitution in accordance with set criteria (they correspond to Group 3 of the Eurostat categorisation). Non-approved high-risk active substances correspond to Group 4.
Source: Eurostat (2022[28]).
1.3.4. Biodiversity in agricultural habitats
Farmland is an integral part of the ecosystem of Europe and the single largest habitat in Europe, covering 39% of the total EU27 land area. Agriculture landscapes are a valued and appreciated part of Europe’s cultural heritage. However, the quality and health of agricultural landscapes are changing, and agricultural biodiversity, in particular, has been in long-term decline.
Across the European Union, only 15% of habitats have a good status, according to the State of Nature report (Sundseth, 2021[29]). The vast majority (81%) are in a poor or bad status. Only 9% of habitats with a poor or bad status show an improving trend. For a third of habitats, the trend is stable (34%), but an equal number (36%) are continuing to decline (Figure 1.17). This decline is especially acute for bogs, mires and fens, dunes, and grassland habitats. In all cases, more than half of the habitats are deteriorating (Sundseth, 2021[29]).
Figure 1.17. Conservation status and trends of agricultural habitats
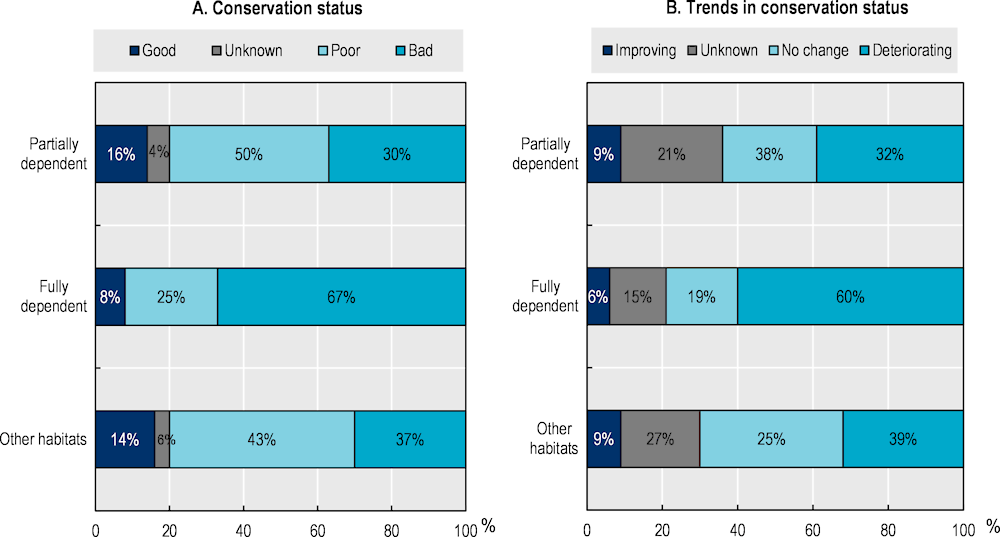
Source: Article 17 Member States′ reports and EU assessments, as reported in Naumann et al. (2020[30]).
Agriculture has for a long time been the most common pressure and threat on species and habitats, being the primary factor in 21% of cases. Urbanisation and forestry are other major pressures (Figure 1.18). Biodiversity decline in agricultural areas is generally linked to deteriorating habitat quantity and quality on farmlands due to the intensification of agricultural activities. In fact, agriculture-related habitats with inadequate or unfavourable conservation status have increased in past decades, leaving less and less space for biodiversity to thrive (Mackenzie, 2018[31]). The drivers are various and include, for example, the loss of structural diversity through field size changes, the widespread use of pesticides, declining numbers of cultivated crop varieties, the intensive application of fertilisers, and the lack of protected and well-connected areas (Mupepele et al., 2021[32]).
The conservation status of farmland bird species, a proxy for overall biodiversity, has been raising warning flags for many years. The Farmland Bird Index, an indicator of populations of bird species dependent on agricultural habitats, fell by 60% between the years 1980 and 2019 (Figure 1.19). This downward trend has continued for farmland birds, even as the population of forest birds has been recovering.
Figure 1.18. Pressures on biodiversity in the European Union
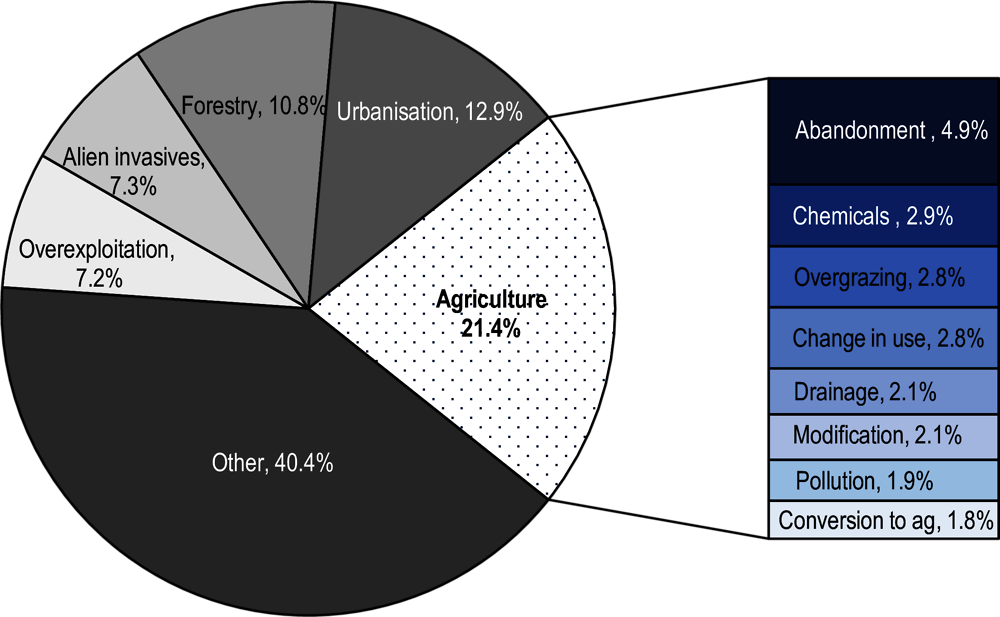
Note: Other includes natural processes, changes in water regimes, energy infrastructure, transport and climate change.
Source: Sundseth (2021[29]).
Figure 1.19. Trend in farmland and forest bird populations in the European Union, 1980 to 2019
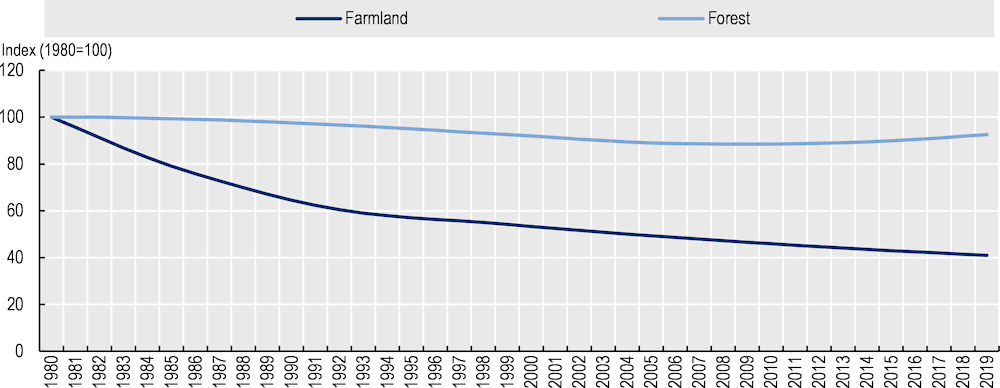
Note: Farmland and forest birds according to European species habitat classification.
Source: EBCC/BirdLife/RSPB/CSO (2022[33]).
1.4. Reconciling economic and environmental dimensions of sustainability
The EGD ambition is intended to ensure the longer term environmental sustainability of EU agriculture but may have negative impacts on dimensions of economic sustainability, such as farm income and employment. In the short term, the trade-off between the environmental ambitions of the CAP and the net income of farmers that need to deliver new outcomes with a similar amount of payments could be particularly strong. Restrictions on input use, the requirement to set aside land for nature and higher animal welfare standards are likely to raise costs for farming and increase competitive pressures. Reconciling this tension between farm income and environmental sustainability will be critical for the CAP to contribute to achieving the EGD objectives. Results-based environmental payments, and market-driven or demand-based instruments have been recognised as relevant approaches to improve agriculture’s environmental performance while maintaining the benefits of global markets (Gruère et al., 2023[34]). In the medium and long term, new sustainable agriculture approaches (e.g. organic farming, agroecology, regenerative agriculture, etc.) and new innovations may be successfully mobilised to improve resource efficiency and reducing their costs (Box 1.2).
A series of modelling studies simulating the impact of implementing several EGD targets concur that production would fall, although they disagree on the farm income effects (Petsakos et al., 2022[35]; Beckman et al., 2020[36]; Henning and Witzke, 2021[37]). The potential impacts that selected targets could have on the EU agricultural sector have been studied. Barreiro-Hurle et al. (2021[38]) indicate that reaching these targets under the current CAP implementation achieves significant environmental benefits in the form of reductions in GHG and ammonia emissions as well as in gross nutrient surplus, although the extent in terms of positive environmental and economic benefits is not fully quantified. Results also show a decline in EU production and variations in prices and income for selected agricultural products, albeit to different degrees. However, none of the studies specifically includes targets for reducing agricultural emissions that will likely require reductions in livestock that go beyond those simulated in these studies or consider the competitiveness implications of the higher animal welfare standards that have been flagged by the European Commission.
Whether producers will end up paying for the higher costs of environmental protection and higher animal welfare standards or whether these costs can be passed on to consumers also depends on the degree of competition from international trade from third countries in the EU single market. If other producers are not subject to the same standards and can produce at a lower cost as a result, this could result in production shifting abroad. This outcome is highlighted particularly in the context of GHG mitigation since offshoring production could lead to higher global emissions, which is the opposite of the intended effect – a phenomenon known as “carbon leakage” (Arvanitopoulos, Garsous and Agnolucci, 2021[39]).
Improving resource efficiency and promoting the circular economy have the potential to be a win-win for farmers by reducing their input costs. Furthermore, the EGD aims to open new opportunities in the bioeconomy. This may be in the production of raw materials, such as hemp, for medicinal or industrial use, or by making use of food waste. It may be in the production of renewable energy. Although the production and use of biomass for energy are controversial and often criticised as unsustainable and competing with food production, it may have a role to play in meeting the net zero emissions target (Catuti et al., 2020[40]). Finally, as discussed in Chapter 4, there will be the possibility to use carbon markets to reward farmers for sequestering carbon, although many difficult questions around monitoring, verification, additionality, reversibility, transaction costs and ensuring accounting integrity remain to be resolved (Thamo and Pannell, 2016[41]).
Box 1.2. Approaches and practices to produce food in an environmentally friendly way
Several approaches have emerged since the early 20th century to promote environmentally friendly agricultural practices as part of production systems that are more environmentally sustainable. These have similar aims and share common features but differ in their scope, agreement around definitions, and extent to which they have been adopted by farmers and taken up in policy. Policies in the European Union and across the OECD have encouraged organic agriculture for a long time. At the same time, more recent concepts such as agroecology and regenerative agriculture are gaining policy attention.
Organic agriculture
The FAO-WHO Codex Alimentarius Commission describes organic agriculture as “a holistic production management system which promotes and enhances agro-ecosystem health, including biodiversity, biological cycles, and soil biological activity... This is accomplished by using, where possible, agronomic, biological, and mechanical methods, as opposed to using synthetic materials, to fulfil any specific function within the system” (Joint FAO/WHO Codex Alimentarius Commission, 2001[42]; Joint FAO/WHO Codex Alimentarius Commission, 2001[42]). The main characteristics of organic production are the prohibition of most synthetic inputs and mandatory crop rotations (FAO Committee on agriculture, 1999[43]; FAO Committee on agriculture, 1999[43]; FAO Committee on agriculture, 1999[43]).
Organic production standards for processes and production methods have been developed by farmer and consumer associations, charities, certification bodies, and governments. They aim at differentiating products and segmenting markets, with claims regarding product characteristics transmitted to consumers through a food label (Rousset et al., 2015[44]). Organic production is not only about sustainability; the price premium obtained by organic products and its market segmentation reflects consumers’ interest in the health, safety and quality characteristics they associate with organic food (Popa et al., 2019[45]).
As of 2021, 76 countries had implemented regulations on organic agriculture, while 20 had organic regulations that were not fully implemented (Willer et al., 2022[46]). Government regulations (such as the European Union Regulation (EU) 2018/848 on organic production and labelling) set minimum standards for products to be certified and sold as organic that can be supplemented by other food chain actors applying definitions and standards that are stricter or have a broader scope.1 For example, the definition agreed upon in 2005 by the International Federation of Organic Agriculture Movements includes social issues, such as fair relationships and good quality of life. (IFOAM Organics International, 2005[47]).
Certification of organic production provides a uniform criterion for governments to support organic farming. According to a 2015 OECD survey, the main reasons for countries to support organic agriculture are to obtain the associated environmental benefits, respond to consumer demand and improve animal welfare (Rousset et al., 2015[44]). The European Union has supported conversion to and maintenance of organic farming since 1994 (and even earlier in some individual Member States). By 2018 the EU28 Member States provided support for 64% of the total certified organic land area in the European Union (or 5% of the total EU utilised agricultural area), for a total of EUR 1.8 billion (Lampkin and Sanders, 2022[48]).
Organic agricultural practices have environmental benefits, including lower pesticide residues, richer biodiversity and greater resilience to drought. However, the environmental performance of organic agriculture per unit of product is not necessarily superior and is highly context dependent (Seufert and Ramankutty, 2017[49]; Meemken and Qaim, 2018[50]). intensive management within organic farming regimes can also impoverish biodiversity and lead to an excessive application of animal manure. Organic systems also frequently have lower yields and require more land to produce a given level of output, which can increase their greenhouse gas emissions footprint.
The global organic market expanded from EUR 15 billion to EUR 121 billion between 2000 and 2020. In the last two decades, the global organic area reached 75 million hectares (from 11 million in 1999), and the number of producers grew from 200 000 to 3.4 million (Willer et al., 2022[46]). The growing market, and adoption of organic standards by large market players, have led to criticism that organic farming is becoming “conventionalised”, where the minimum is done to meet the standards while pushing the rules to their limit to allow larger scale farming and monocultures (Lampkin, Schwarz and Bellon, 2020[51]; Beste, 2019[52]). The costs and administrative burden associated with obtaining an organic certification can exclude small farmers and traditional practices from around the world, even if they produce food in ways that could be considered more sustainable than conventional agriculture.
Agroecology
Agroecology is “a holistic and integrated approach that simultaneously applies ecological and social concepts and principles to the design and management of sustainable agriculture and food systems, [seeking] to optimize the interactions between plants, animals, humans and the environment while also addressing the need for socially equitable food systems” (FAO, 2020[53]). While the concept emerged decades earlier, it gained prominence in the 1990s in the United States and Latin America and it is seen simultaneously as a science, a set of agricultural practices and a social movement (Wezel et al., 2009[54]).
There are no national or international agroecology standards beyond the ten elements established by the Food and Agriculture Organization (FAO, 2018[55]) and the principles established by the High-Level Panel of Experts of the Committee on World Food Security (HLPE, 2019[56]), but the concept is increasingly being incorporated and promoted in policy. In the European Union, the Farm to Fork Strategy refers to “agroecology (including organic farming)” as one of several sustainable practices to be funded by the new eco-schemes (described in Chapter 4, Section 4.3.5). At the Member State level, France has pioneered the inclusion of agroecology in its public policy, while others such as Germany have maintained a stronger focus on organic farming (Lampkin and Sanders, 2022[48]). Outside the European Union, Brazil incorporated agroecology in its 2007 National Policy for Technical Assistance and Rural Extension (FAO, 2018[57]).
A 2020 study found that in 15 case studies representing a wide range of production activities and of climatic and ecological contexts of Europe, agroecological farms tend to enhance biodiversity and water quality compared to non-agroecological farms (Landert et al., 2020[58]). However, no clear patterns were found regarding soil quality or economic performance. The results also suggested that agroecological practices could have higher greenhouse gas emissions and fuel consumption.
Regenerative agriculture
Regenerative agriculture encompasses a range of ideas and practices. A 2020 literature review (Newton et al., 2020[59]) found numerous definitions and descriptions based either on processes (such as using cover crops, integrating livestock, or reduced or no tillage), outcomes (such as improving soil health, carbon sequestration or increased biodiversity) or combinations of both. The same study found that the use of the term has surged since 2015, which suggests that it is gaining more attention from scholars and practitioners.
According to the European Academies’ Science Advisory Council, regenerative agriculture stresses soil restoration and the interplay of crops and farm animals. The concept of regenerative agriculture is broader and less prescriptive than agroecology and organic agriculture, as it accepts a targeted use of modern plant and animal breeding technology, tilling, and inorganic fertilisers or pesticides (EASAC, 2022[60]).
The United Nations Intergovernmental Panel on Climate Change’s Special Report on Climate Change and Land lists regenerative agriculture as one of the sustainable land management practices (along with agroecology, ecosystem-based approaches and organic farming) that can be effective in building the resilience of agro-ecosystems. In the United States, some municipal governments have incorporated regenerative agriculture in their climate action plans (The Climate Reality Project, 2019[61]). While no standards have been developed by national governments or international organisations, private standards such as Regenerative Organic Certified (developed by the Regenerative Organic Alliance, a US-based group of farmers, business leaders and experts) are starting to emerge.
Circular agriculture
Circular agriculture focuses on using minimal amounts of external inputs, closing nutrient loops, regenerating soils and minimising the impact on the environment. It is built on the concept of circular economy, where the reuse and recycling of materials is not only a separate step to close cycles, but an integral part of the choices made in the production and use of products. In circular agriculture, this can be the use of manure as organic fertiliser and the use of wastewater in irrigation. Circular agriculture does not reflect a specific set of farm practices or standards, though it is often associated with mixed crop-livestock production, organic production and agroforestry. Circular agriculture is contrasted to the linear nature of conventional agriculture, where the intensive application of raw inputs such as fertiliser and chemicals leads to harmful outflows of waste and degraded soil quality in the farm system.
Since 2018, the Dutch Government has promoted a transition towards a circular agriculture, seen as “a collective search by farmers, interested citizens, businesses, scientists and researchers for the optimum combination of ecological principles with modern technology, with new partnerships, new economic models, and credible social services. It not only focuses on good yields and the sparing use of resources and energy, but also stresses the importance of putting as little pressure on the environment, nature and climate as possible” (WUR, 2018[62]).
Interactions of the concepts
The concepts presented, and the movements that originated them, are strongly intertwined, and the terms are sometimes used synonymously. In fact, a broad set of terms to describe environmentally sustainable agricultural techniques coexist in public discourse. Along with the concepts mentioned above terms and concepts have been introduced, such as “agroecological farming” “alternative agriculture,” “biodynamic agriculture,” “carbon farming,” “integrated pest management”, “nature inclusive farming,” “conservation agriculture,” “green agriculture,” “organic regenerative agriculture,” and “sustainable agriculture.” (Newton et al., 2020[59]). The use of technologies (biotech, precision agriculture) can also focus on environmental outcomes (OECD, 2016[63]).
Organic agriculture stands alone as the most clearly regulated, certified and labelled of the mentioned approaches. This is due, in part, to its connection with specific product characteristics, such as the absence of pesticide residues and the resulting need for clear market segmentation. This is not the same as consumer preference for otherwise identical products that are produced in a more environmentally friendly manner. Agroecology or regenerative agriculture are regarded as processes rather than products and are not supported by regulations or standards.
1. The EU Regulation authorises the use of the terms “organic”, “ecologic” and “biologic” in different European languages, and their diminutives (such as “bio” and “eco”), whether alone or in combination, for the labelling and advertising of organic products.
Annex 1.A. Agri-environmental performances and trends across EU Member States
The agri-environmental performance of EU Member States depends on various contextual and external factors. The country-specific structural features play a key role, including the dominating farming system, farming specialisations and practices, and the availability of agricultural land. Moreover, as discussed in this review, agricultural policies are essential drivers, and the effect of innovations and the potential of emerging technologies also play a key role (OECD, 2019[7]). The interaction and impacts of these different factors determine the performance of every country, leading to significant differences in environmental pressures and trends across the 27 Member States.
The following sections present the environmental pressures and trends of selected agri‑environmental indicators in the EU Member States, using the most updated data from the OECD (2022[22]) and Eurostat (2022[64]) databases.
Environmental pressures on agricultural land
Environmental pressures on agricultural land also differ significantly among the 27 EU Member States, depicting a very heterogeneous picture across Europe that depends heavily on the structural features of the countries’ agricultural sectors, including the size of land available for agricultural activities.
Nutrient balances, in general, largely depend on the chosen crop mix, adopted cultivars, the livestock composition and management practices (OECD, 2019[7]). In Europe, nitrogen pressures per hectare are particularly high in Central European countries as well as in Member States such as Cyprus and Malta. Many Eastern European countries report relatively lower numbers. Differences in nitrogen surpluses between the two groups amount to up to 168 kg/ha. One country, Romania, even exhibits a negative value, indicating a prevailing nitrogen deficit with potentially adverse effects on soil fertility. Yet, the high nitrogen balances per hectare in many Central European countries can be the result of the relatively large livestock sector, as well as of the widespread cereal production. Particularly in small European countries such as Belgium, Cyprus, Malta, and the Netherlands, high livestock densities determine surplus values. Livestock production (and partially also cereal production), in contrast, is generally lower in Eastern and Southern European countries, contributing to lower nitrogen balances per hectare (Eurostat, 2022[65]).
Similarly, data on phosphorus balances show that countries such as Spain, Portugal, Finland, Denmark, and Belgium reported surpluses (ranging between 4.5 kg/ha and 29.5 kg/ha), while many Eastern and Central European countries reported phosphorus deficits on agricultural areas of up to 7.1 kg/ha. Only a few of the 27 Member States indicated balanced values close to zero. The high phosphorus pressures in various Southern and certain Central/Northern European countries could be traced back to higher application rates of mineral fertilisers, as well as the intensive production of fruit and vegetables (OECD, 2019[7]; Eurostat, 2011[66]).
With regard to GHG emissions, many Central European countries reveal high levels of emissions per hectare of utilised agricultural area, while most Eastern European countries report lower levels. The Netherlands, Belgium, Malta, and Luxembourg were among the highest-emitting countries in the considered period, ranging between 5.2 tonnes of greenhouse gases per hectare (GHG t/ha) and 10.4 GHG t/ha. In fact, in those countries, emissions levels exceed the EU average more than twofold, indicating a much higher degree of agricultural intensification. The main reasons are the particularly high emissions intensities from soils, enteric fermentation and manure management, together with less agricultural area available (Dace and Blumberga, 2016[67]). On the other hand, Bulgaria, Hungary, Estonia, and Romania were among the least emitting countries, with GHG releases of 1.3‑1.5 GHG t/ha. Such low emissions intensities of agricultural activities may be attributed to the more extensive farming systems and the lower livestock production levels.
Similar emissions patterns were observed for agricultural ammonia, where countries like Malta, the Netherlands, Cyprus, and Belgium show the highest emissions per hectare (between 50 kg/ha and 99.5 kg/ha), while many Eastern European countries, especially Latvia, Bulgaria and Estonia, show the lowest (below 10kg/ha). These differences are the result of different livestock densities in agricultural areas (and to a minor extent emissions from fertilisers): emissions per utilised agricultural area are, on average, three to five times higher in Europe if high densities of livestock prevail (UNECE, 2021[68]).
Agri-environmental trends diverge among EU Member States
Looking at agri-environmental performance trends across countries and indicators,15 the 27 EU Member States revealed clear differences in their relative performance over the decade 2008-18. Only very few countries significantly improved their overall performance across all indicators, but most show mixed results. While the majority of countries progressed well in reducing the human and environmental risk from pesticides and managed to use phosphorus more efficiently, achievements in increased nitrogen use efficiency vary across countries. Overall, the majority of EU Member States lack progress in reducing agricultural greenhouse gas (GHG) and ammonia emissions, and show a strong decline in farmland biodiversity.
Progress on nitrogen use efficiency varies widely across EU Member States. A total of 14 – predominantly Eastern – European countries exhibit improved nitrogen use efficiency over time. In contrast, the remaining countries, especially Lithuania, Latvia, Portugal, and Bulgaria, report negative trends, ranging between 2.8% and 1.8%. This can also be explained by the fact that initial levels vary across Member States. For example, in Latvia, although the use of mineral fertilisers has increased, nitrogen consumption per hectare of agricultural area remains one of the lowest among the EU countries (OECD, 2019[69]).
Other possible reasons for the different performances particularly between Eastern European countries compared to the remaining Member States could be the differing moments of EU accession and the resulting temporal differences in the impact of relevant policies. Accordingly, the relatively positive nitrogen use efficiency trends in Eastern European countries might rely on the effects of the Nitrate Directive in the considered period, e.g. through efficiency use increasing measures. Earlier accession countries might have benefited from such a positive impact at an earlier time.
The majority of EU countries show comparatively great progress in phosphorus use efficiency. Trends reveal significant increases over time in 19 of the 27 Member States, with an EU-wide increase of 25% from 2006 to 2014. Among those, predominantly Eastern but also various Southern European countries achieved the highest efficiency gains over time. Only a few countries show low improvement or declining rates, particularly Southern European countries such as Spain and Portugal, as well as Bulgaria, which report deteriorating trends of 2%, 3% and 4% during 2011-19.
An overall positive development across EU Member States in reduction of pesticide use was also observed. This is mainly based on efforts to encourage lower uses of pesticides and promote switches to lower-risk products that contain less active substances. The application of Directive 2009/128/EC on Sustainable Use of Pesticides (discussed in Chapter 4) could have been one decisive factor for this progress. There are varying reasons for the rising trends of pesticide risks in several EU countries: in the case of Finland, this is mainly due to increased sales volumes of urea, used as a repellent in forestry, while in Estonia the trends were affected by pesticides containing active substances belonging to the group known as candidates for substitution remaining on the market in accordance with EU rules due to the lack of viable alternatives (Finnish Safety and Chemicals Agency, n.d.[70]; Eurostat, 2021[71]).
The 27 European countries performed by far the worst in farmland biodiversity, with significantly deteriorating trends of the Farm Birds Index over the period in almost all Member States. Only one country, Cyprus, reported an increase in 2019 compared to 2007.
However, the state of biodiversity in agricultural areas differs widely between Member States and this is largely dependent on the degree of agricultural intensification of the predominant farming systems. Yet, various further non-agricultural factors exist that may have adverse effects, e.g. the impact of invasive species, climate change or pollution (EC, 2022[72]). While it is the main priority for all countries to stop the continuing negative trend in farmland biodiversity, some countries (predominantly some of the post-2004 Member States such as Bulgaria and Romania) are richer in biodiversity and need to maintain the existing state while others (especially pre-2004 Member States) need to recreate natural habitats and promote species growth (Sutcliffe et al., 2015[73]).
Data on agricultural GHG emissions trends from the European Environmental Agency show that only three countries (Greece, Croatia, and Malta) succeeded in accelerating emissions reduction trends significantly over time, with decreases of more than 10% in 2019 compared to 2005. Seven countries reported distinctive increasing trends. Those were particularly high in Estonia, Bulgaria, Hungary, Latvia, and Luxembourg, with an increase of more than 10% between 2005 and 2019 (EEA, 2021[74]).
Considering GHG emission trends per hectare reveals even more negative trends in five Member States, indicating a significantly increasing degree of agricultural intensification in those countries. The drivers for emission trends vary between countries: while Malta achieved great reductions through reduced livestock emissions, increases in Estonia mainly stem from rising soil emissions. In addition, the country’s accession to the European Union set a turning point and led to a reversal in formerly declining GHG trends (EEA, 2021[75]; Estonian Ministry of the Environment, 2021[76]).
Most EU countries also show relatively little progress in reducing agricultural ammonia emissions over the decade 2008-18. In fact, trends remained stable in 16 of the 27 Member States, while 4 countries reported increases: Austria and Ireland (both of which observed emission reductions during the previous decade), Latvia and Lithuania; and 7 countries reported decreases: Croatia, Cyprus, Denmark, Greece, Malta, the Netherlands16 and Romania. Considering agricultural ammonia emissions on a hectare rather than an absolute basis even indicates slightly less progress across EU Member States, with significant negative trends in Hungary and Spain. A recent study (Murawska and Prus, 2021[77]) confirms the lack of progress in the sustainable management of agricultural ammonia emissions and even indicates the start of an overall rising trend in the period from 2010 to 2017, with significant increases in many Member States.
Given the low progress in agricultural ammonia emissions reductions, an increasing number of Member States anticipate they will fail to meet their emissions targets for 2030. In contrast, most Member States (21 out of 27), managed to stay beneath their ceilings in 2017 (EEA, 2021[78]). The reasons for the upward trend are manifold and differ across countries: in Germany, the increased use of inorganic nitrogen fertilisers is the main reason for agricultural ammonia increases, while higher numbers of cattle and swine as well as increased application of synthetic nitrogen fertilisers are the main trend drivers in Spain (EEA, 2021[79]).
Annex 1.B. Surveys for EU Member States
Two surveys – one on the key design features of the agri-environmental schemes and one on key agricultural features of Member States’ innovation systems – were designed and sent to Member State representatives for completion to collect information on issues of special relevance to the review process. The surveys were administered through an online survey platform, which facilitated the involvement of several country experts in the data collection process.
The purpose of the Agri-environmental Schemes (AES) Survey was to collect information on key design features of the agri-environmental schemes applied by EU Member States to assess the resilience and environmental performance of their agricultural sector. In particular, the questions related to the process of setting AES, eligibility mechanisms, enrolment criteria, payment basis and enforcement mechanisms. The questionnaire was composed of 32 questions. The first section of the questionnaire included general questions related to the process of designing and implementing agri-environmental programmes. The second section invited respondents to identify the most important agri-environmental schemes (in terms of budget) in their respective countries and then asked questions specifically related to each agri-environmental programme.
The purpose of the Innovation Policies Survey was to gather information about key features of the agricultural innovation system and the most relevant policy environment essential to achieving sustainable agricultural productivity growth and increased resilience. Questions encompassed public and private actors and institutions involved in research, development and innovation (R&D&I); long-term strategies; investment in R&D&I; knowledge flows; international co-operation; digitalisation; and education and skills. The questionnaire was composed of 39 questions.
Both surveys included both multiple-choice and open-ended questions and provided respondents with the opportunity to include additional comments and information specific to the context of their respective countries. The surveys took place between mid-April and the end of June 2022.
Twenty responses were gathered for each of the two surveys, covering 19 EU Member States. Belgium is the only federal state that has submitted two separate CAP strategic plans for CAP 2023-27, one for Wallonia and the other for Flanders. Therefore, each region also completed and submitted a separate version of the surveys. The 20 respondents’ units therefore were: Austria; Belgium, Flanders; Belgium, Wallonia; Croatia; the Czech Republic; Denmark; Estonia; Finland; France; Germany; Ireland; Italy; Latvia; Lithuania; the Netherlands; Poland; Portugal; the Slovak Republic; Slovenia; Spain; and Sweden.
For Germany, the information collected only covers the federal perspective. However, several of the themes covered by the survey are the responsibility of the German Länder with their own programmes.
References
[39] Arvanitopoulos, T., G. Garsous and P. Agnolucci (2021), “Carbon leakage and agriculture: A literature review on emissions mitigation policies”, OECD Food, Agriculture and Fisheries Papers, No. 169, OECD Publishing, Paris, https://doi.org/10.1787/9247f1e7-en.
[38] Barreiro-Hurle, J. et al. (2021), Modelling Environmental and Climate Ambition in the Agricultural Sector with the CAPRI Model, Publications Office of the European Union, Luxembourg, https://doi.org/10.2760/98160.
[36] Beckman, J. et al. (2020), Economic and Food Security Impacts of Agricultural Input Reduction Under the European Union Green Deal’s Farm to Fork and Biodiversity Strategies, Economic Brief Number 30, US Department of Agriculture, Economic Research Service, https://www.ers.usda.gov/publications/pub-details/?pubid=99740.
[52] Beste, A. (2019), “Comparing Organic, Agroecological and Regenerative Farming”, https://www.arc2020.eu/organic-agroecological-and-regenerative-whats-the-diff-organic/ (accessed 5 December 2022).
[8] Bureau, J. and J. Antón (2022), “Agricultural Total Factor Productivity and the environment: A guide to emerging best practices in measurement”, OECD Food, Agriculture and Fisheries Papers, No. 177, OECD Publishing, Paris, https://doi.org/10.1787/6fe2f9e0-en.
[40] Catuti, M. et al. (2020), Biomass and Climate Neutrality, Centre for European Policy Studies, Brussels, https://www.ceps.eu/ceps-publications/biomass-and-climate-neutrality/.
[67] Dace, E. and D. Blumberga (2016), “How do 28 European Union Member States perform in agricultural greenhouse gas emissions? It depends on what we look at: Application of the multi-criteria analysis”, Ecological Indicators, Vol. 71, pp. 352-358, https://doi.org/10.1016/J.ECOLIND.2016.07.016.
[60] EASAC (2022), “Regenerative agriculture in Europe: A critical analysis of contributions to European Union Farm to Fork and Biodiversity Strategies”, https://www.interacademies.org/sites/default/files/2022-04/EASAC%20Report%20RegenerativeAgriculture_April_2022_WEB.pdf.
[33] EBCC/BirdLife/RSPB/CSO (2022), Common bird indices by type of estimate, https://ec.europa.eu/eurostat/databrowser/product/page/env_bio3 (accessed on 29 March 2023).
[72] EC (2022), Agriculture and rural development. Enhancing agricultural biodiversity, https://agriculture.ec.europa.eu/sustainability/environmental-sustainability/biodiversity_en.
[14] EC (2022), The Rural Pact, https://rural-vision.europa.eu/rural-pact_en (accessed on 23 March 2023).
[13] EC (2021), A Long-term Vision for the EU’s Rural Areas: Building the Future of Rural Areas Together, European Commission, Brussels.
[12] EC (2021), “The new Common Agricultural Policy: 2023-27”, web page, https://agriculture.ec.europa.eu/common-agricultural-policy/cap-overview/new-cap-2023-27_en#legalbases.
[10] EC (2020), A European Strategy for Data, COM(2020) 66 final, European Commission, Brussels.
[11] EC (2020), EU Biodiversity Strategy for 2030. Bringing nature back into our lives, European Commission, Brussels, https://ec.europa.eu/research/environment/index.cfm?pg=nbs.
[1] EC (2019), The European Green Deal, European Commission, Brussels, https://eur-lex.europa.eu/resource.html?uri=cellar:b828d165-1c22-11ea-8c1f-01aa75ed71a1.0002.02/DOC_1&format=PDF (accessed on 16 May 2022).
[20] EC (1998), Agricultural Situation and Prospects in the Central and Eastern European Countries: Summary Report, Bulgaria, Czech Republic, Estonia, Hungary, Latvia, Lithuania, Poland, Romania, Slovakia, Slovenia, Office for Official Publications of the European Communities, Brussels.
[21] EEA (2022), Annual European Union Greenhouse Gas Inventory 1990-2020 and Inventory Report 2022, European Environment Agency, https://www.eea.europa.eu/publications/annual-european-union-greenhouse-gas-1 (accessed on 5 July 2022).
[23] EEA (2021), “Agriculture nitrogen balance in Europe (indicator)”, https://www.eea.europa.eu/data-and-maps/indicators/agriculture-nitrogen-balance-1/assessment (accessed on 10 October 2022).
[75] EEA (2021), EEA greenhouse gases - data viewer, https://www.eea.europa.eu/data-and-maps/data/data-viewers/greenhouse-gases-viewer (accessed on 29 June 2022).
[79] EEA (2021), European Union emission inventory report 1990-2019, https://doi.org/10.2800/701303 (accessed on 29 June 2022).
[74] EEA (2021), Greenhouse gas emissions from agriculture in Europe, https://www.eea.europa.eu/ims/greenhouse-gas-emissions-from-agriculture (accessed on 29 June 2022).
[78] EEA (2021), NEC Directive reporting status 2019, https://www.eea.europa.eu/publications/nec-directive-reporting-status-2019 (accessed on 29 June 2022).
[27] EEA (2021), Water and Agriculture: Towards Sustainable Solutions, Publications Office of the European Union, Luxembourg, https://doi.org/10.2800/73735.
[76] Estonian Ministry of the Environment (2021), Greenhouse Gas Emissions in Estonia 1990-2019 - National Inventory Report.
[15] EU (2022), Rural Observatory, https://observatory.rural-vision.europa.eu/?lng=en&ctx=RUROBS (accessed on 29 March 2023).
[2] EU (2021), Regulation (EU) 2021/2115 of the European Parliament and of the Council, Official Journal of the European Union, L 435/1.
[26] Eurostat (2022), Agri-environmental indicator - consumption of pesticides, https://ec.europa.eu/eurostat/statistics-explained/index.php?title=Agri-environmental_indicator_-_consumption_of_pesticides#Key_messages (accessed on 6 July 2022).
[65] Eurostat (2022), Agri-environmental indicator - livestock patterns - Statistics Explained, https://ec.europa.eu/eurostat/statistics-explained/index.php?title=Agri-environmental_indicator_-_livestock_patterns#Livestock_density_at_EU_level_in_2016 (accessed on 29 June 2022).
[64] Eurostat (2022), Database - Agriculture, https://ec.europa.eu/eurostat/web/agriculture/data/database (accessed on 29 June 2022).
[24] Eurostat (2022), Key Figures on the European Food Chain, Eurostat, Luxembourg, https://ec.europa.eu/eurostat/web/products-key-figures/w/key-figures-on-the-european-food-chain-2022-edition-2.
[28] Eurostat (2022), Pesticide Sales by Categorisation of Active Substances (database) [AEI_PESTSAL_RSK], https://ec.europa.eu/eurostat/databrowser/view/aei_pestsal_rsk/default/table (accessed on December 2022).
[71] Eurostat (2021), Harmonised risk indicator 1 for pesticides by categorisation of active substances - Estonia, https://ec.europa.eu/eurostat/databrowser/view/AEI_HRI__custom_2996872/default/table?lang=en (accessed on 29 June 2022).
[18] Eurostat (2020), Agriculture, forestry and fishery statistics. 2020 Edition, Publications Office of the European Union, Luxembourg.
[66] Eurostat (2011), Phosphorus balance in agriculture, https://ec.europa.eu/eurostat/statistics-explained/index.php?title=Archive:Phosphorus_balance_in_agriculture&direction=next&oldid=66744 (accessed on 29 June 2022).
[53] FAO (2020), Agroecology Knowledge Hub, https://www.fao.org/agroecology/overview/en/ (accessed on 21 February 2023).
[57] FAO (2018), Brazil - National Policy for Technical Assistance and Rural Extension, https://www.fao.org/faolex/results/details/en/c/LEX-FAOC158754/ (accessed 5 December 2022).
[55] FAO (2018), The 10 elements of agroecology, Food and Agriculture Organization of the United Nation, Rome.
[43] FAO Committee on agriculture (1999), Organic Agriculture - Item 8 of the Provisional Agenda, https://www.fao.org/3/X0075e/X0075e.htm.
[70] Finnish Safety and Chemicals Agency (n.d.), Harmonised risk indicators, https://tukes.fi/en/safe-use-of-plant-protection-products/harmonised-risk-indicators (accessed on 29 June 2022).
[34] Gruère, G. et al. (2023), “Pursuing higher environmental goals for agriculture in an interconnected world: Climate change and pesticides”, OECD Food, Agriculture and Fisheries Papers, No. 193, OECD Publishing, Paris, https://doi.org/10.1787/99d917ab-en.
[37] Henning, C. and P. Witzke (2021), Economic and Environmental Impacts of the Green Deal on the Agricultural Economy, https://grain-club.de/fileadmin/user_upload/Dokumente/Farm_to_fork_Studie_Executive_Summary_EN.pdf (accessed on 8 July 2022).
[56] HLPE (2019), Agroecological and other innovative approaches for sustainable agriculture and food systems that enhance food security and nutrition. A report by the High Level Panel of Experts on Food Security and Nutrition of the Committee on World Food Security.
[47] IFOAM Organics International (2005), Definition of Organic Agriculture, https://www.ifoam.bio/why-organic/organic-landmarks/definition-organic (accessed 5 December 2022).
[42] Joint FAO/WHO Codex Alimentarius Commission (2001), Guidelines for the Production, Processing, Labelling and Marketing of Organically Produced Foods, CAC/GL 32, https://www.fao.org/3/at715e/at715e.pdf.
[48] Lampkin, N. and J. Sanders (2022), Policy support for organic farming in the European Union 2010-2020, Johann Heinrich von Thünen-Institut, Braunschweig, https://www.econstor.eu/bitstream/10419/265493/1/1817299727.pdf.
[51] Lampkin, N., G. Schwarz and S. Bellon (2020), “Policies for agroecology in Europe, building on experiences in France, Germany and the United Kingdom”, pp. pp. 103-112.
[58] Landert et al. (2020), “Assessing agro-ecological practices using a combination of three sustainability assessment tools”, Journal of Sustainable and Organic Agricultural Systems, Vol. 70(2), pp. 129-144, https://doi.org/10.3220/LBF1612794225000.
[31] Mackenzie, M. (2018), “Biodiversity and farmed landscapes”, CAP Specific Objectives… explained Brief No. 6, European Commission, https://agriculture.ec.europa.eu/system/files/2020-06/cap-specific-objectives-brief-6-biodiversity_en_0.pdf.
[19] Macours, K. and J. Swinnen (2000), “Causes of output decline in economic transition: The case of Central and Eastern European agriculture”, Journal of Comparative Economics, Vol. 28/1, pp. 172-206, https://doi.org/10.1006/jcec.1999.1643.
[50] Meemken, E. and M. Qaim (2018), “Organic Agriculture, Food Security, and the Environment”, Annual Review of Resource Economics, Vol. 10/1, pp. 39-63, https://doi.org/10.1146/annurev-resource-100517-023252.
[32] Mupepele, A. et al. (2021), “Biodiversity in European agricultural landscapes: Transformative societal changes needed”, Trends in Ecology & Evolution, Vol. 36/12, pp. 1067-1070, https://doi.org/10.1016/j.tree.2021.08.014.
[77] Murawska, A. and P. Prus (2021), “The Progress of Sustainable Management of Ammonia Emissions from Agriculture in European Union States Including Poland—Variation, Trends, and Economic Conditions”, Sustainability 2021, Vol. 13, Page 1035, Vol. 13/3, p. 1035, https://doi.org/10.3390/SU13031035.
[30] Naumann, S. et al. (2020), State of Nature in the EU: Results from Reporting Under the Nature Directives 2013-2018, European Environment Agency, Luxembourg, https://www.eea.europa.eu/publications/state-of-nature-in-the-eu-2020 (accessed on 15 February 2023).
[59] Newton, P. et al. (2020), “What Is Regenerative Agriculture? A Review of Scholar and Practitioner Definitions Based on Processes and Outcomes”, Frontiers in Sustainable Food Systems, Vol. 4, https://doi.org/10.3389/fsufs.2020.577723.
[80] OECD (2023), Policies for the future of farming and food in the Netherlands, OECD Publishing, Paris, https://doi.org/10.1787/bb16dea4-en.
[6] OECD (2022), Agricultural Policy Monitoring and Evaluation 2022: Reforming Agricultural Policies for Climate Change Mitigation, OECD Publishing, Paris, https://doi.org/10.1787/7f4542bf-en.
[22] OECD (2022), Agri-environmental Indicators Database, https://www.oecd.org/agriculture/topics/agriculture-and-the-environment (accessed on 29 June 2022).
[4] OECD (2021), Policies for the Future of Farming and Food in Norway, OECD Agriculture and Food Policy Reviews, OECD Publishing, Paris, https://doi.org/10.1787/20b14991-en.
[3] OECD (2020), “OECD Agro-Food Productivity-Sustainability-Resilience Policy Framework”, https://one.oecd.org/document/TAD/CA/APM/WP(2019)25/FINAL/en/pdf.
[69] OECD (2019), Innovation, Agricultural Productivity and Sustainability in Latvia, OECD Food and Agricultural Reviews, OECD Publishing, Paris, https://doi.org/10.1787/9789264312524-en.
[5] OECD (2019), Innovation, Productivity and Sustainability in Food and Agriculture: Main Findings from Country Reviews and Policy Lessons, OECD Food and Agricultural Reviews, OECD Publishing, Paris, https://doi.org/10.1787/c9c4ec1d-en.
[7] OECD (2019), Trends and Drivers of Agri-environmental Performance in OECD Countries, OECD Publishing, Paris, https://doi.org/10.1787/b59b1142-en.
[9] OECD (2016), OECD Council Recommendation on Water, OECD Publishing, Paris, https://www.oecd.org/environment/resources/Council-Recommendation-on-water.pdf.
[63] OECD (2016), “What does organic farming mean for green growth?”, in Farm Management Practices to Foster Green Growth, OECD Publishing, Paris, https://doi.org/10.1787/9789264238657-5-en.
[35] Petsakos, A. et al. (2022), “Farm-level impacts of the CAP post-2020 reform: A scenario-based analysis”, Applied Economic Perspectives and Policy, https://doi.org/10.1002/aepp.13257.
[45] Popa, M. et al. (2019), “Organic foods contribution to nutritional quality and value”, Trends in Food Science & Technology, Vol. 84, pp. 15-18, https://doi.org/10.1016/j.tifs.2018.01.003.
[44] Rousset, S. et al. (2015), “Voluntary environmental and organic standards in agriculture: Policy implications”, OECD Food, Agriculture and Fisheries Papers, No. 86, OECD Publishing, Paris, https://doi.org/10.1787/5jrw8fg0rr8x-en.
[25] Schoumans, O. et al. (2015), “Phosphorus management in Europe in a changing world”, Ambio, Vol. 44/2, pp. 180-192, https://doi.org/10.1007/s13280-014-0613-9.
[49] Seufert, V. and N. Ramankutty (2017), “Many shades of gray—The context-dependent performance of organic agriculture”, Science Advances, Vol. 3/3, https://doi.org/10.1126/sciadv.1602638.
[29] Sundseth, K. (2021), The State of Nature in the EU, European Commission, Brussels.
[73] Sutcliffe, L. et al. (2015), “Harnessing the biodiversity value of Central and Eastern European farmland”, Diversity and Distributions, Vol. 21/6, pp. 722-730, https://doi.org/10.1111/DDI.12288.
[41] Thamo, T. and D. Pannell (2016), “Challenges in developing effective policy for soil carbon sequestration: perspectives on additionality, leakage, and permanence”, Climate Policy, Vol. 16/8, pp. 973-992, https://doi.org/10.1080/14693062.2015.1075372.
[61] The Climate Reality Project (2019), “Regenerative Agriculture and Municipal Climate Action Plans”, https://www.climaterealityproject.org/blog/regenerative-agriculture-and-municipal-climate-action-plans (accessed 5 December 2022).
[68] UNECE (2021), Assessment report on ammonia, https://unece.org/environment/documents/2021/09/working-documents/assessment-report-ammonia (accessed on 29 June 2022).
[16] USDA ERS (2021), International Agricultural Productivity Database, https://www.ers.usda.gov/data-products/international-agricultural-productivity.
[54] Wezel, A. et al. (2009), “Agroecology as a science, a movement and a practice. A review”, Agronomy for Sustainable Development, Vol. 29/4, pp. 503-515, https://doi.org/10.1051/agro/2009004.
[46] Willer, H. et al. (eds.) (2022), The World of Organic Agriculture. Statistics and Emerging Trends 2022., Research Institute of Organic Agriculture FiBL, Frick, and IFOAM – Organics International.
[17] World Bank (2023), Employment in agriculture (% of total employment) (modeled ILO estimate), The World Bank, https://data.worldbank.org/indicator/SL.AGR.EMPL.ZS?locations=EU.
[62] WUR (2018), Circular agriculture: a new perspective for Dutch agriculture, https://www.wur.nl/en/show/circular-agriculture-a-new-perspective-for-dutch-agriculture-1.htm (accessed on 31 January 2023).
Notes
← 1. As of 18 January 2023.
← 2. See Bureau and Antón (2022[8]) for an introduction to best practices on measuring TFP and the environment.
← 3. The EU aggregate is based on the 27 Member States as of 2022, after the withdrawal of the United Kingdom. Due to data availability, Belgium/Luxembourg and the Czech Republic/Slovak Republic are accounted for jointly. Data on Croatia and Slovenia are only available starting from the 1990s; for consistency, these two countries are excluded from longer time. Therefore, the EU time series is built on 23 data points, representing 25 Member States. For consistency, the EU numbers represent the aggregation of these 25 Member States along the 6 most recent decades.
← 4. The European Union is compared to the United States in several figures in this section. Other OECD countries, in particular Japan and the United Kingdom, are also included in several figures. There is not an output growth decomposition for the aggregate of OECD countries and such an aggregate would tend to have a profile that is very similar to that of the European Union (see, for instance, Figure 1.5), given the large number of EU countries in the OECD aggregate. For this reason, it is preferable to compare the European Union to a selection of single countries.
← 5. The fact that some countries experienced a decline in TFP does not mean that their productivity is lower than that of the European Union. The TFP decomposition methodology does not allow comparing productivity levels across countries, only the rates of growth over time.
← 6. Feed (the other component of variable inputs besides fertilisers in the USDA ERS International Agricultural Productivity Database) also experienced rapid growth in the 1960-70s, but not a comparable fall in the following decades.
← 7. Data on Croatia and Slovenia are only available starting from 1992 and therefore the existence of such a trend cannot be verified.
← 8. Austria, Belgium, Bulgaria, Cyprus, the Czech Republic, Hungary, Ireland, Luxembourg, the Netherlands, Romania, the Slovak Republic and Slovenia.
← 9. EU13 Member States comprise Bulgaria, Croatia, Cyprus, the Czech Republic, Estonia, Hungary, Latvia, Lithuania, Malta, Poland, Romania, the Slovak Republic, and Slovenia. Due to data availability, the aggregate for EU13 Member countries does not include Croatia or Slovenia. The Czech Republic and the Slovak Republic are included jointly. Therefore, the EU13 aggregate is built upon 10 data points, representing 11 Member States.
← 10. Prior to the withdrawal of the United Kingdom, this group was generally known as the EU15; it is sometimes also referred to as “old” or “older” Member States. It comprises Austria, Belgium, Denmark, Finland, France, Germany, Greece, Ireland, Italy, Luxembourg, the Netherlands, Portugal, Spain, and Sweden. Due to data availability, Belgium and Luxembourg are included jointly. Therefore, the EU14 aggregate is built upon 13 data points, representing 14 Member States.
← 11. This section focuses on direct GHG emissions from agriculture, which encompasses methane and N2O only, not indirect emissions deriving from energy and land-use change.
← 12. The value for the European Union corresponds to the median of its Member States.
← 13. Absolute decoupling of output growth form environmental emissions occurs when output grows (g(Y)>0) and emissions fall (g(E)<0). For this to happen, TFP growth needs to be strong enough to outweigh growth in output and in the emissions factor of inputs: g(TFP)>g(Y)+g(EF). Partial decoupling is a less demanding condition and occurs when positive output growth is more than the corresponding growth in emissions g(Y)>g(E)>0. For this to happen, TFP growth needs to be just higher than the growth in the emissions factor: g(TFP)>g(EF).
← 14. The full analysis of decomposing the evolution of the total level of the environmental outcome into output expansion, emissions factor and TFP undertaken for GHG emissions cannot be implemented for nutrient balances due to technical reasons: there are negative balances and data availability constraints. As an alternative, a graphical plotting exercise is undertaken for nutrient balance per hectare through two periods (1997-99 to 2007-09 and 2003‑05 to 2013-15) that unfortunately are not the same as for GHG.
← 16. Despite decreasing ammonia emissions in the Netherlands, ammonia levels are one of the country’s main concerns as they are still at a high level and cause localised problems in nitrogen-intensive areas. See OECD (2023[80]) for a further elaboration on the ammonia problem in the Netherlands.