With higher access to public transport, more developed electric mobility and lower private vehicle ownership per capita, capital regions are leading the way to more sustainable transport.
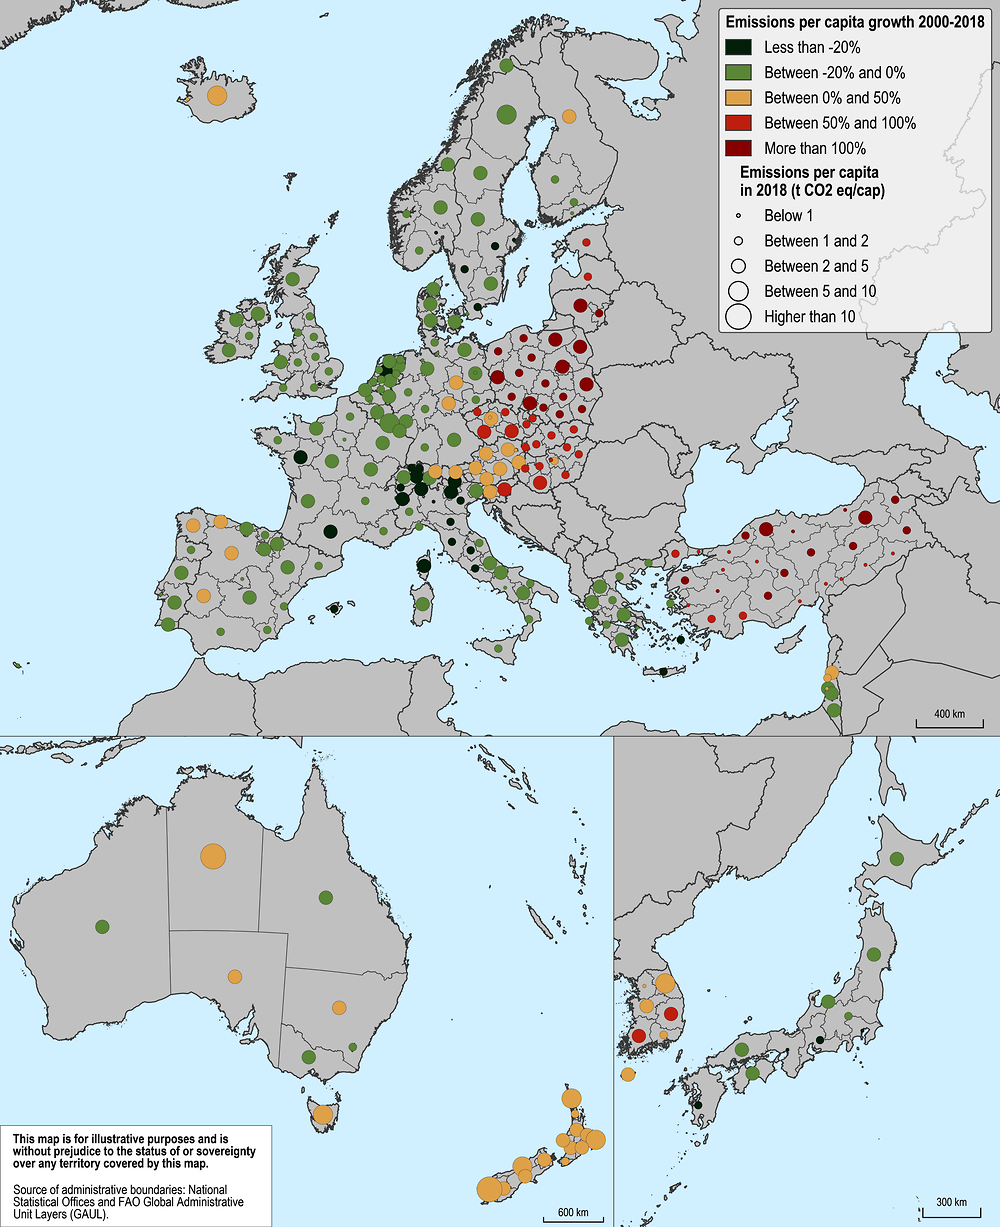
The transport sector is the second-largest contributor to GHG emissions (24% in 2018) in OECD countries after the energy sector. Transport witnessed the largest increase in emissions, doubling from 1970 to 2018. Road transport accounted for 88% of emissions within this sector in 2018 (excluding international shipping and international aviation) (Crippa et al., 2021). Despite an improvement in vehicle energy efficiency, the distances travelled and the vehicle numbers, size and mass increased, leading to higher fuel consumption and related emissions. Differences in road emissions per capita within countries are particularly high, especially in Oceania and North America. On average, remote regions have over three times higher road transport emissions per capita than large metropolitan regions. Such disparities can originate from differences in population densities, the number of private vehicles per capita and access to public transport and services (Figures 2.20 and 2.21).
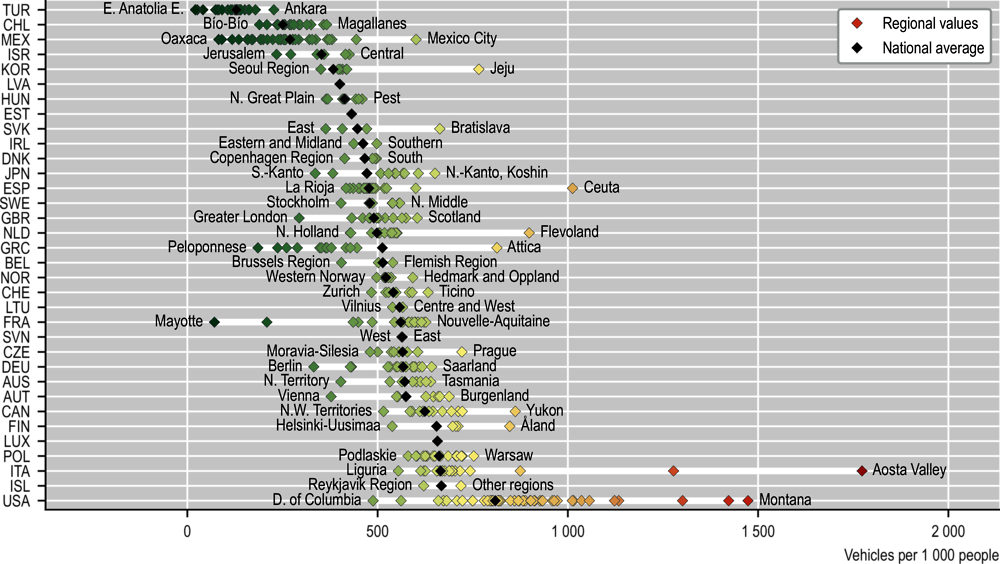
The transport sector accounted for over one-third of the total final energy consumption and two-thirds of oil products consumption in 2019 in OECD countries. Reaching climate neutrality and cutting oil use requires further development of public transport, reducing private car use in large cities and accelerating the adoption of electric and more efficient vehicles (IEA, 2022). Private vehicle ownership is concentrated in specific types of regions in OECD countries. In Asian and most European countries, non-metropolitan regions record more vehicles per inhabitant than metropolitan regions. However, in Australia, Mexico, Türkiye and East European countries, metropolitan regions record higher vehicles per capita than other regions, maybe driven by higher living standards in metropolitan regions. Within-country differences are largest in North America and Southern Europe. For example, in Italy, Aosta Valley recorded almost 1 800 vehicles per 1 000 inhabitants, the highest number of private vehicles per capita across OECD regions and more than 3 times the vehicles per capita observed in Liguria (Figure 2.17).
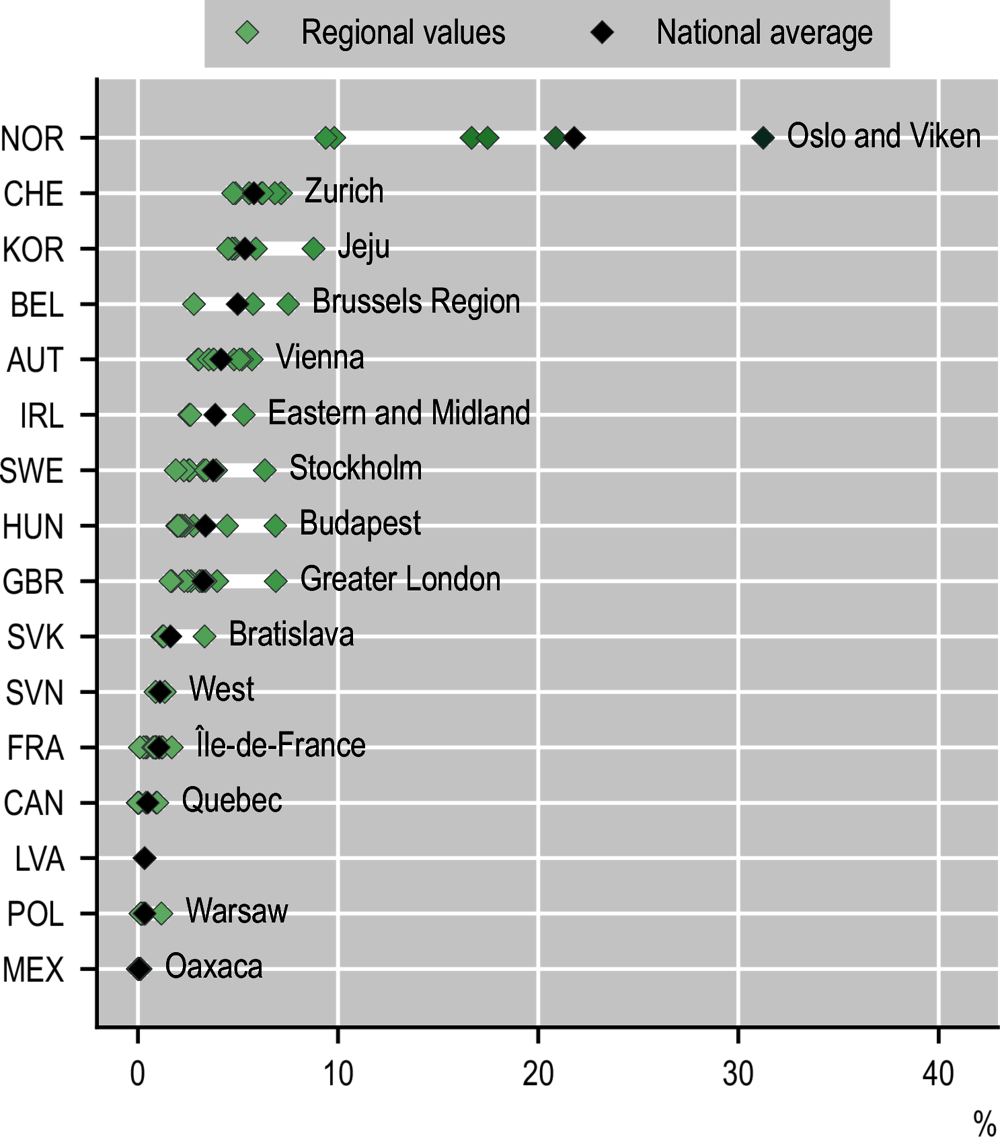
During the last two decades, the number of private vehicles per capita decreased in most European regions, especially capital regions. Greater London, UK, has seen a 12% decline in per capita private vehicle ownership since 2000. On the other hand, in many regions of Chile, Mexico and the US, private vehicle ownership has increased significantly. In the regions of Morelos and Tlaxcala (Mexico) for example, the number of private vehicles per capita in 2020 was four times higher than in 2001. Regarding the adoption of electric mobility, Norway ranks first, with 22% of its private vehicle fleet being electric or hybrid. In most OECD countries, capital regions are leading the adoption of electric or hybrid vehicles. This may be explained by shorter average travel distances and higher accessibility of charging stations. In the region of Oslo and Viken (Norway), almost 30% of private vehicles are either electric or hybrid as of 2020, an increase of 20 percentage points (pp) in only 4 years. Brussels Capital Region (Belgium), Budapest (Hungary), Greater London (UK) and Stockholm (Sweden) recorded a share of around 7% in the same year (Figure 2.18).
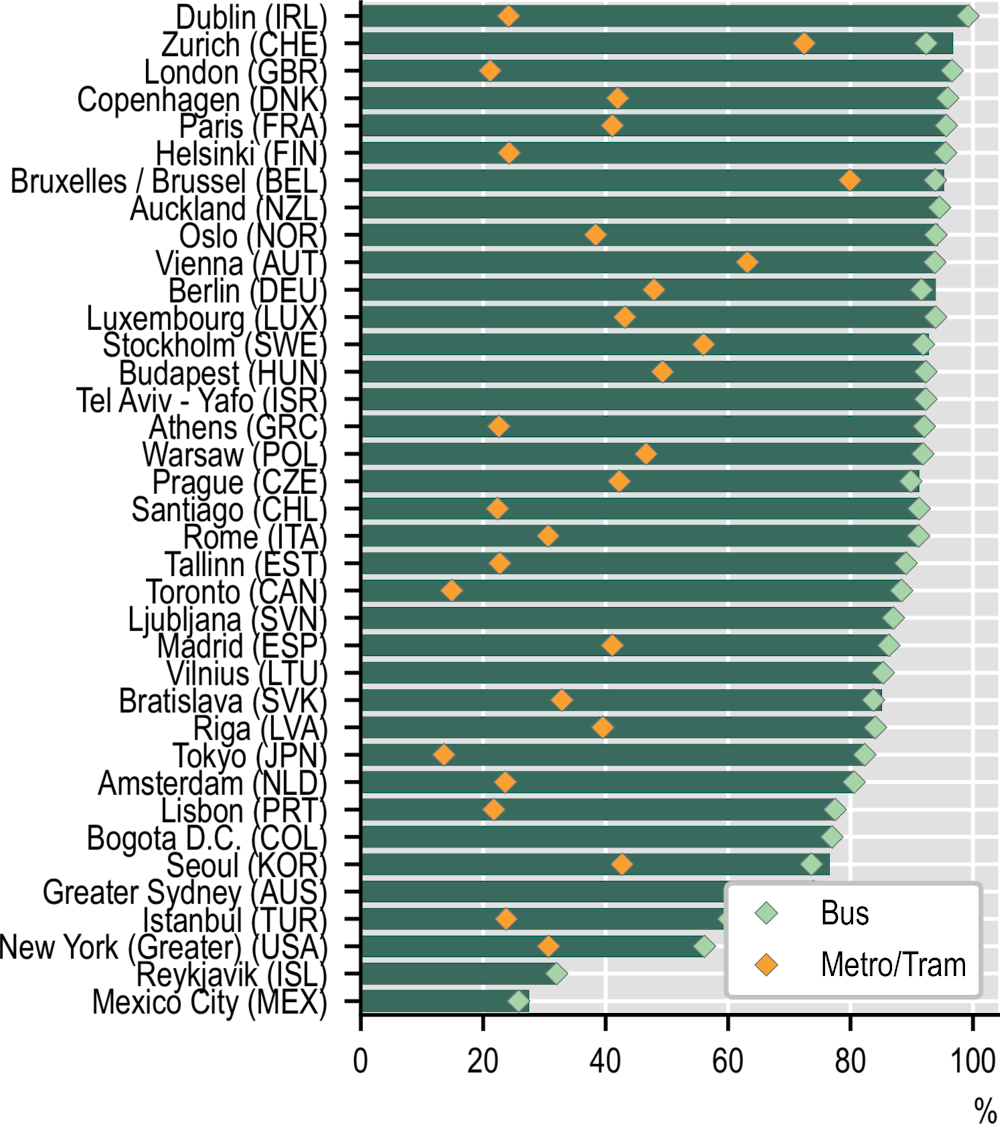
Ensuring good accessibility to public transport in cities is essential not only to reduce GHG emissions but also to reduce congestion and air pollution, and to improve quality of life. On average, across the OECD’s largest cities, 83% of the population can access a bus stop and 31% can access a metro or tram stop within a 10-minute walk. Buses provide better coverage across a city transport network but their frequency tends to be more variable and their speed is lower than metros. Northern and Western European cities, as well as Auckland (New Zealand), tend to have the best access to public transport. In terms of metro or tram stops, Southern European cities show relatively lower accessibility (e.g. Lisbon 21% or Athens 22%) than Central and Northern European cities (Figure 2.19).


