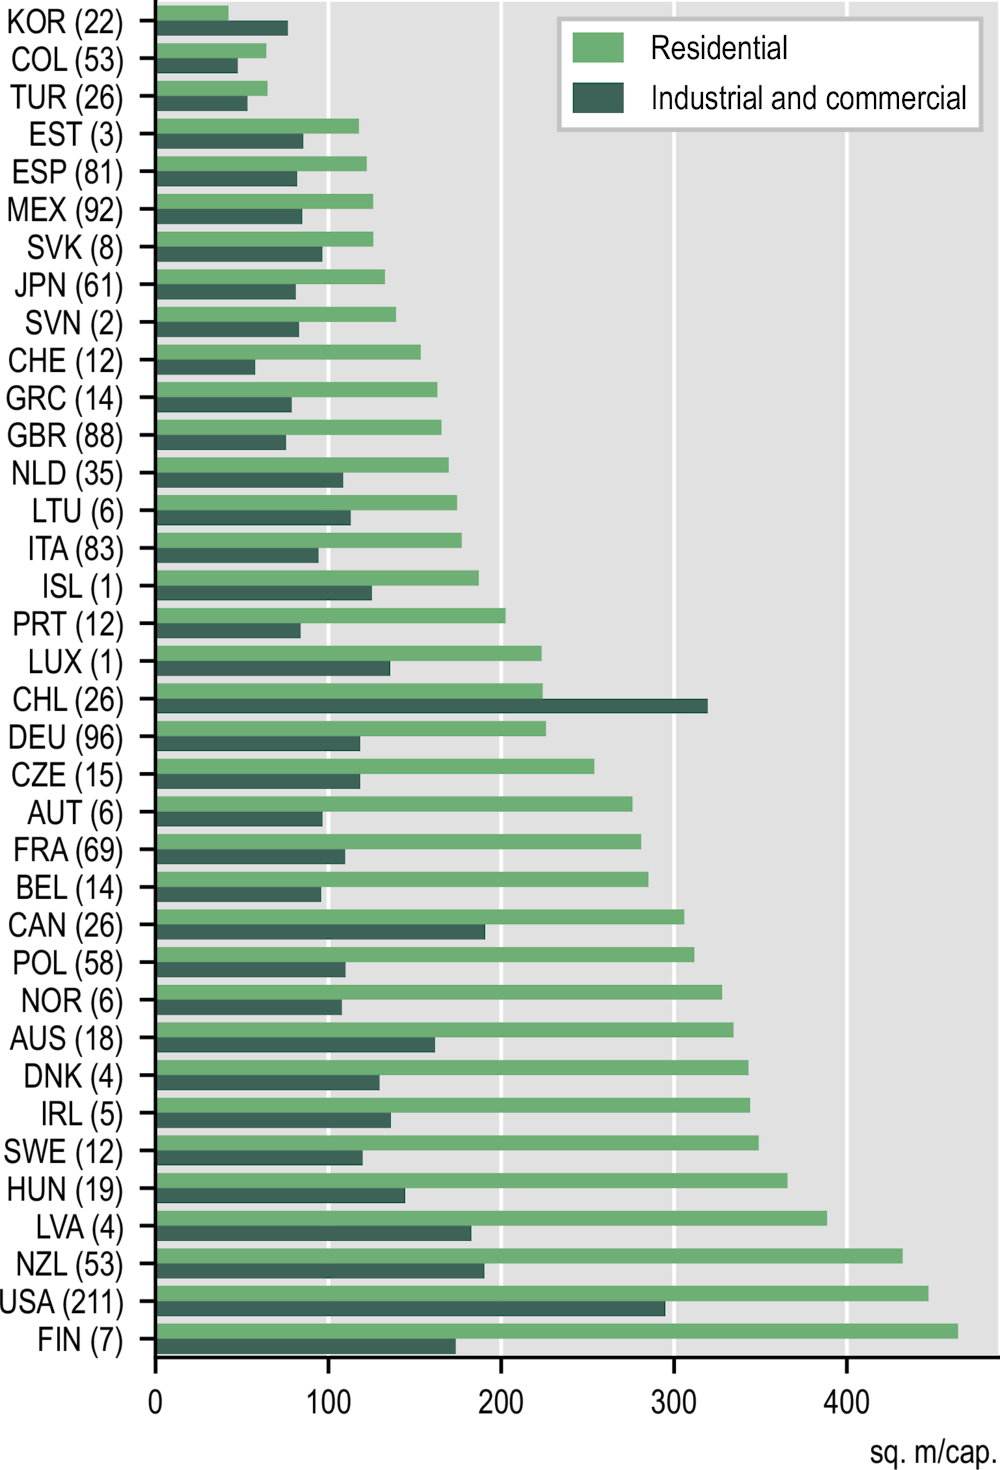
The average amount of residential built-up area per inhabitant varies substantially across OECD countries, from 40 m2 per capita in Korea to 460 m2 in Finland.
Cities are continuing to concentrate on increasing shares of the global population. Over the last few decades, cities’ population has been characterised by both physical expansion and increasing densities (OECD/EC, 2020). Both processes affect the shape of their built environment, which in turn can have implications in terms of environmental footprint and capacity to provide services. For example, cities with fragmented and sprawling structures can make it more difficult to provide public transport and increase energy consumption and related CO2 emissions (UN-Habitat, 2018).
The amount of residential space per capita in cities differs remarkably across countries and tends to be higher in countries with high gross domestic product (GDP) per capita. Cities’ residential built-up area can range from about 40-60 m2 per inhabitant in Colombia, Korea and Türkiye to about 450 m2 per inhabitant in Finland, New Zealand and the US. Notwithstanding the large variation in residential built-up areas per capita, there is no common pattern across countries. Within several countries, such as Australia, Chile, New Zealand and the US, the residential built-up area per capita varies relatively widely between FUAs (Banquet et al., 2022) (Figure 2.22).
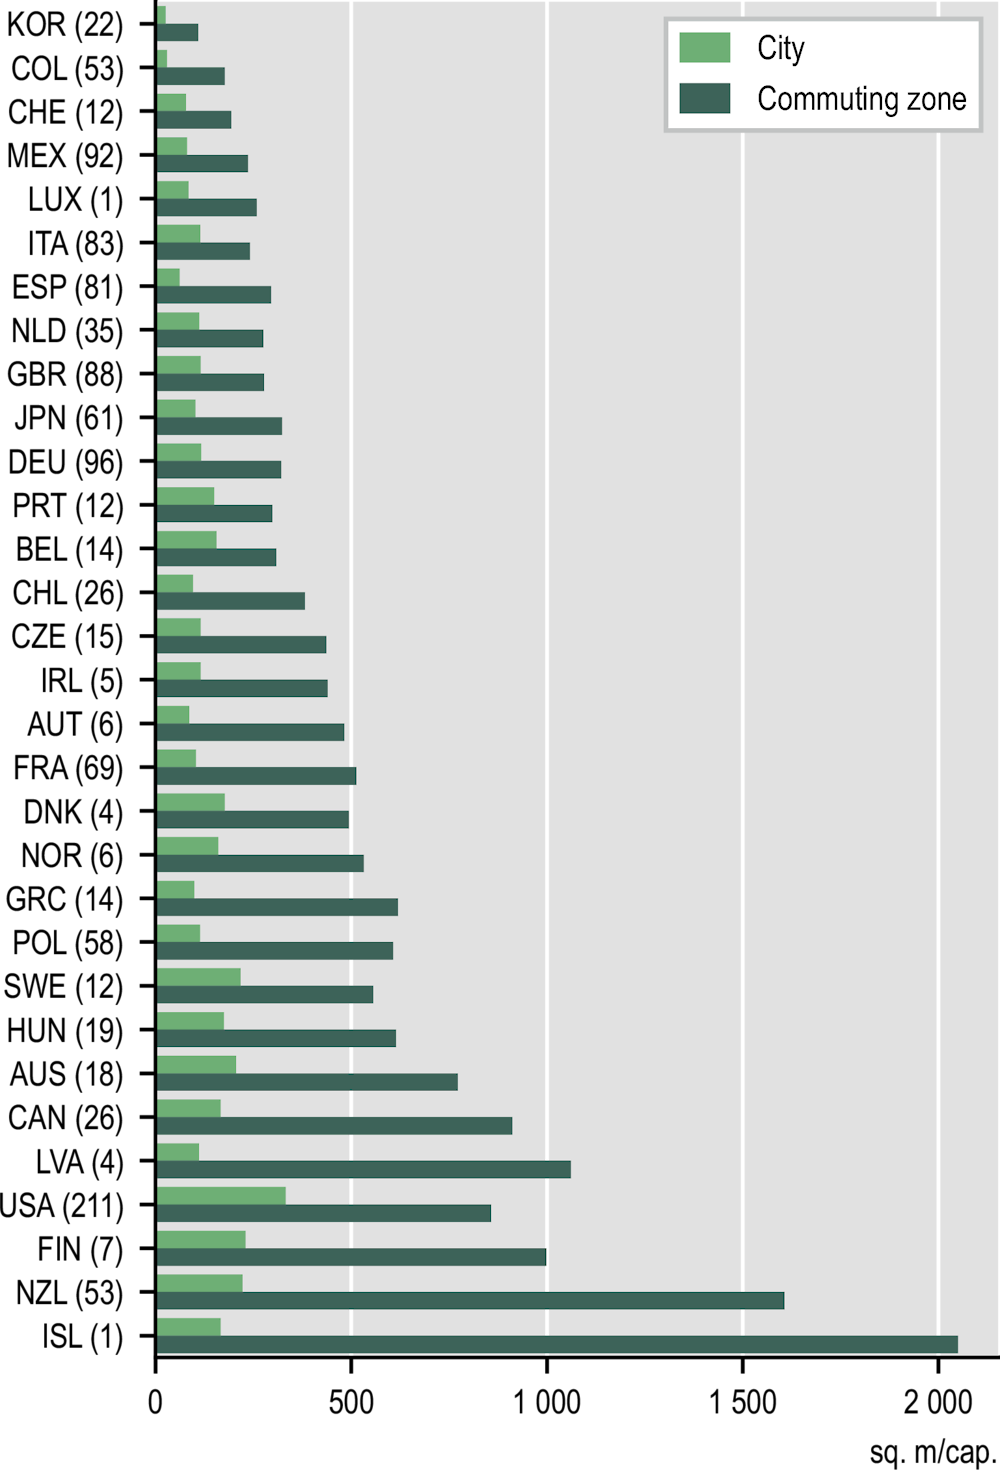
Commuting zones drive up the total built-up area per capita of OECD metropolitan areas. As land prices are lower and developing land tends to be easier outside of the dense urban centres, land in commuting zones tends to be used more extensively. In several countries, such as Ireland and Latvia, cities with relatively low built-up area per capita coexist with others showing very high levels. In those countries, the relatively large FUA-wide built-up areas are primarily driven by spread-out land use in commuting zones (rather than in cities) (Figure 2.23).
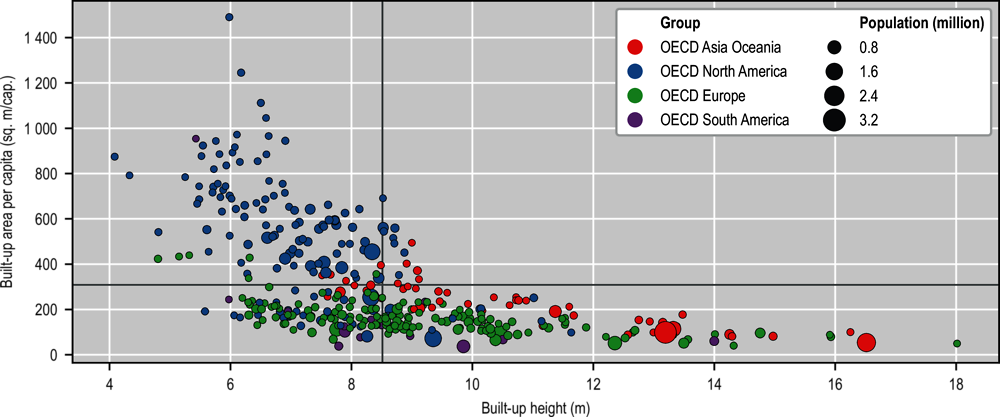
A second dimension to characterise the shape of urban settlements is the height of buildings. The recent estimates of building heights released by the European Commission (EC) Joint Research Centre (JRC) at the global level allowed for assessing differences in average building heights between OECD metropolitan areas. FUAs in Korea and Japan record the highest average building height across OECD countries (more than 8 m). As expected, due to the higher demand for central locations, building height in the city is higher than in its commuting zone, with a difference of 3.4 metres, on average. The average building height tends to increase with city size. Cities with more than 1.5 million inhabitants record an average building height of 9.3 m, while those with less than 250 000 people have an average building height of 7.7 m. Comparing average building height with built-up area per capita enables to find consistent patterns within different macro-regions. Metropolitan areas located in OECD North America tend to have low average building height and higher built-up area per capita, reflecting a higher horizontal spread compared to the OECD average. Cities in OECD Asia and Oceania are on the other hand much more “compact” as they register both relatively low levels of built-up area per capita and higher average building heights. Cities in OECD Europe and South America show both low levels of built-up area per capita and medium levels of building height (Figure 2.24).


