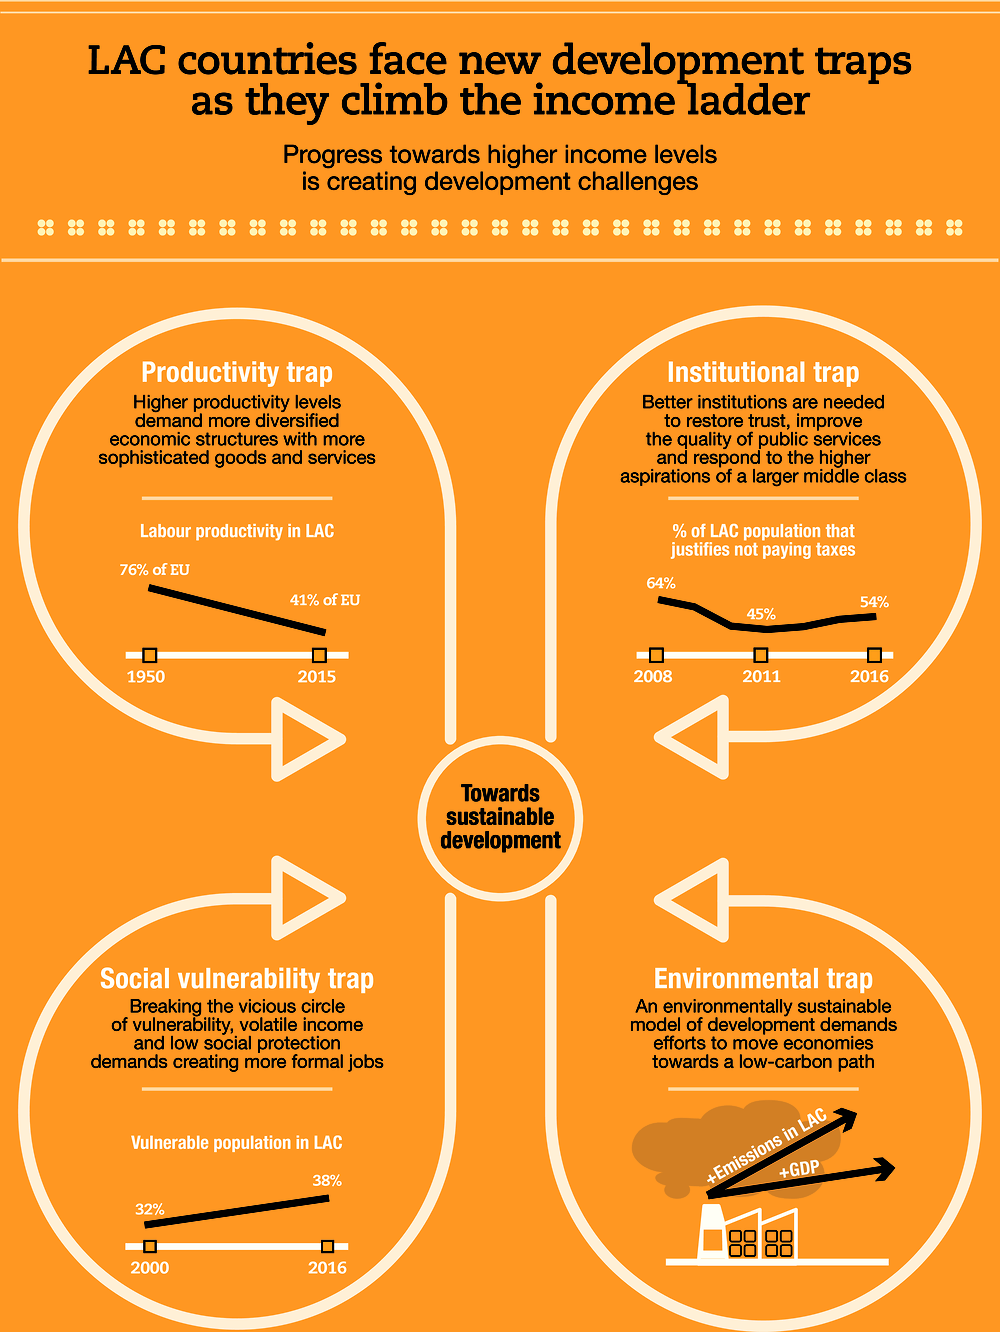
There are different symptoms that suggest that Latin American and Caribbean (LAC) countries are facing a number of “new” development traps that act as a barrier to further inclusive and sustainable growth. While these traps reflect some longstanding issues, they are new – or increasingly important – in the sense that they are also the result of progress towards higher income levels, which is surfacing – as well as creating – new development challenges. This highlights the relevance of the “development in transition” approach for LAC. These development traps are vicious circles that limit the capacity of LAC countries to move towards greater levels of development. This chapter highlights the existence of four main development traps: the productivity trap, the social vulnerability trap, the institutional trap and the environmental trap. These interlinked traps are particularly relevant in a rapidly changing global context, which poses new and increasingly complex challenges. Overcoming these traps and turning these vicious circles into virtuous circles will set LAC on a path of greater sustainable development and higher well-being for all.
Latin American Economic Outlook 2019

Chapter 3. The “new” development traps
Abstract
Introduction
Different symptoms suggest that countries in Latin America and the Caribbean (LAC) are facing a number of “new” development traps that stand in the way of further inclusive and sustainable growth. The traps themselves result from longstanding weaknesses, but progress towards higher income levels is surfacing – as well as creating – new development challenges. In this sense, as countries advance in their respective development pathways, these weaknesses have been exacerbated and gained relevance. This is one of the main reasons why the development in transition (DiT) approach – described in the Overview Chapter – is relevant for LAC today.
Several factors indicate that the earlier drivers of progress are no longer sufficient. These include stagnant – or even declining – levels of productivity; persistent and increasing vulnerability of large segments of the population, with unequal access to public services across socio-economic groups; growing dissatisfaction of citizens with public institutions; and an increasing pressure on natural resources that is deemed to be unsustainable.
Development traps involve circular, self-reinforcing dynamics that limit the capacity of LAC countries to move forward. The literature has consistently used the image of a “trap” to illustrate certain dynamics that leave countries stuck with a particular development challenge. As an example, the poverty trap is understood as “a self-reinforcing mechanism which causes poverty to persist” and whereby “poverty begets poverty, so that current poverty is itself a direct cause of poverty in the future” (Azariadus and Stachurski, 2005). In a similar vein, the theory of development economics has been built around concepts such as the “circular and cumulative causation” (Myrdal, 1957), which stresses the self-fulfilling nature of poverty traps. There is also the idea of “unbalanced growth” (Hirschman, 1958), which introduced interest in policies that can support economies in moving from a “bad equilibrium” to a “good” one (Ray, 2007). More recently, a relatively large body of literature has pointed to a “middle-income trap” that affects countries’ ability to sustain long-lasting growth when they reach the middle-income range (Gill and Kharas, 2007; Kharas and Kohli, 2011; Melguizo et al., 2017).
The concept of development trap used here refers to a combination of mutually reinforcing factors that limit further progress. Hence, they demand co-ordination and/or collective action to be overcome. In this respect, development traps in LAC can result from two sets of factors:
a vicious circle, understood as the combination of certain dynamics that are intertwined to create a negative spiral. The abovementioned “poverty trap”, for example, affects countries at early stages of development. Countries cannot save because they are poor, and precisely because they cannot save – and hence invest – they remain poor;
a low-level equilibrium, which is locally stable owing to the presence of factors that mutually reinforce each other. The persistence of high levels of informality in various LAC countries could be an example of this kind of undesired equilibrium. In this case, workers and employers do not find sufficient incentives to reach formal work agreements, and hence remain informal.
This chapter refers to “new” development traps in LAC since they have become particularly relevant in the current regional context. Specifically, after a period of socio-economic progress since the beginning of the century, the region has witnessed structural limits to achieving greater levels of development. Furthermore, the global context poses new and increasingly complex challenges, with some megatrends (globalisation, migration flows, climate change and rapid technological change, among others) that demand new policy responses (see Chapter 4 Chapter 5). The four main “new” development traps identified revolve around productivity, social vulnerability, institutions and the environment.
Productivity trap: Persistently low productivity levels and poor productivity performance across sectors in LAC are symptoms of a productivity trap. The concentration of exports of many LAC countries on primary and extractive sectors undermines the participation of LAC in global value chains (GVCs). This, in turn, is associated with low levels of technology adoption and few incentives to invest in productive capacities. In all, competitiveness remains low, making it difficult to move towards higher added-value segments of GVCs. This fuels a vicious circle that negatively affects productivity. Such a dynamic has gained relevance given the decline of demand for commodities derived from the current stage of “shifting wealth” (i.e. the shift of the People’s Republic of China [hereafter “China”] from an investment-based economic model to one based on consumption) and where new drivers of growth are needed in LAC to boost productivity.
Social vulnerability trap: Income growth paired with strong social policies since the beginning of the century have reduced poverty remarkably. Yet most of those who escaped poverty are now part of a new vulnerable middle class that represents 40% of the population. This comes with new challenges, as more people are now affected by a social vulnerability trap that perpetuates their vulnerable status. Those belonging to this socio-economic group have low quality, usually informal jobs associated with low social protection and low – and often unstable – income. Because of these circumstances, they do not invest in their human capital, or lack capacity to save and invest in an entrepreneurial activity. Under these conditions, they remain with low levels of productivity, hence only with access to low quality and unstable jobs that leave them vulnerable. This trap operates at the level of the individual, who is locked into a vulnerable status; this contrasts with the productivity trap, which refers to the whole economy.
Institutional trap: The expansion of the middle class in LAC has been accompanied by new expectations and aspirations for better quality public services and institutions. However, institutions have not been able to respond effectively to these increasing demands. This has created an institutional trap, as declining trust and satisfaction levels are deepening social disengagement. Citizens are seeing less value in committing to the fulfilment of their social obligations, such as paying taxes. Tax revenues are thus negatively affected, limiting available resources for public institutions to provide better quality goods and services, and to respond to the rising aspirations of society. This creates a vicious circle that jeopardises the social contract in the region.
Environmental trap: This is linked to the productive structure of most LAC economies, which is biased towards high material and natural resource-intensive activities. This concentration may be leading these countries towards an environmentally and economically unsustainable dynamic for two reasons. A concentration on a high-carbon growth path is difficult – and costly – to abandon; and natural resources upon which the model is based are depleting, making it unsustainable. This has also gained importance in recent years, with the stronger commitment to global efforts to fight climate change.
The growing importance of these development traps has relevant policy implications. A new set of structural reforms are needed for ever-more complex issues, requiring more sophisticated policy mixes and further policy co-ordination and coherence. Overcoming these traps and turning these vicious circles into virtuous circles will set LAC on a path of greater sustainable development and higher well-being for all. In this light, Chapter 3 analyses these “new” development traps in detail. It aims to identify underlying causes and consequences, and hence guide the action of the development in transition approach in LAC.
The productivity trap
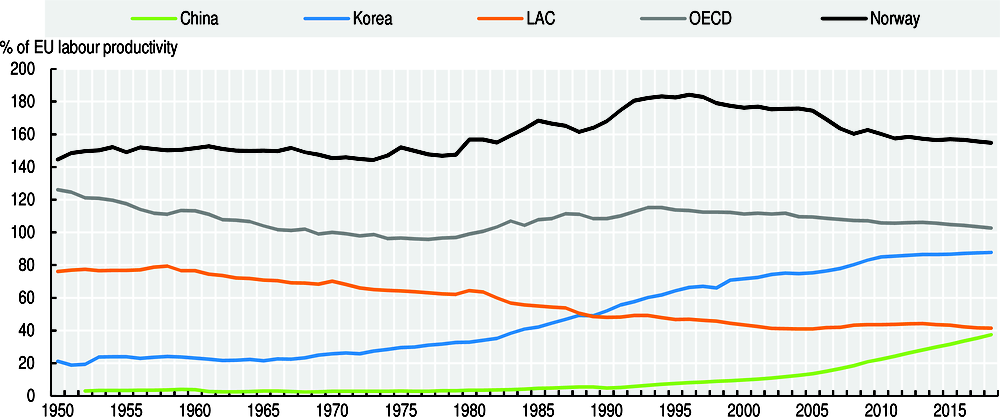
Most LAC countries have been middle-income economies for various decades, mainly because of their inability to raise productivity levels. Despite significant heterogeneity across countries, on average, LAC countries have stayed in the middle-income range for 65 years. Under the current growth pace, it would take another 40 years to reach sustainable high-income levels (Melguizo et al., 2017; OECD/CAF/ECLAC, 2018).1 One of the main explanations for this persistence in the middle-income range is the stagnation – and even decline – of labour productivity levels relative to most advanced economies. In 2017, LAC’s labour productivity represented around 40% of the European Union countries’ labour productivity, relative to more than 75% in 1950. These results contrast with the performance of some fast-growing Asian economies (such as Korea or China) or European commodity-abundant countries, such as Norway (Figure 3.1).
Figure 3.1. Labour productivity in LAC, OECD, China, Korea and Norway
(Percentage of labour productivity in the European Union)
Low productivity growth has a negative impact on potential growth, which has been declining and is lower than expected. In spite of the region’s cyclical heterogeneity, potential growth has slowed down since 2011 across the board. In addition, medium-term growth projections suggest that it is close to 3%, which is less robust than previously thought. This stands in sharp contrast to the 5% average annual growth rate that characterised the mid-2000s (OECD/CAF/ECLAC, 2018, 2016).
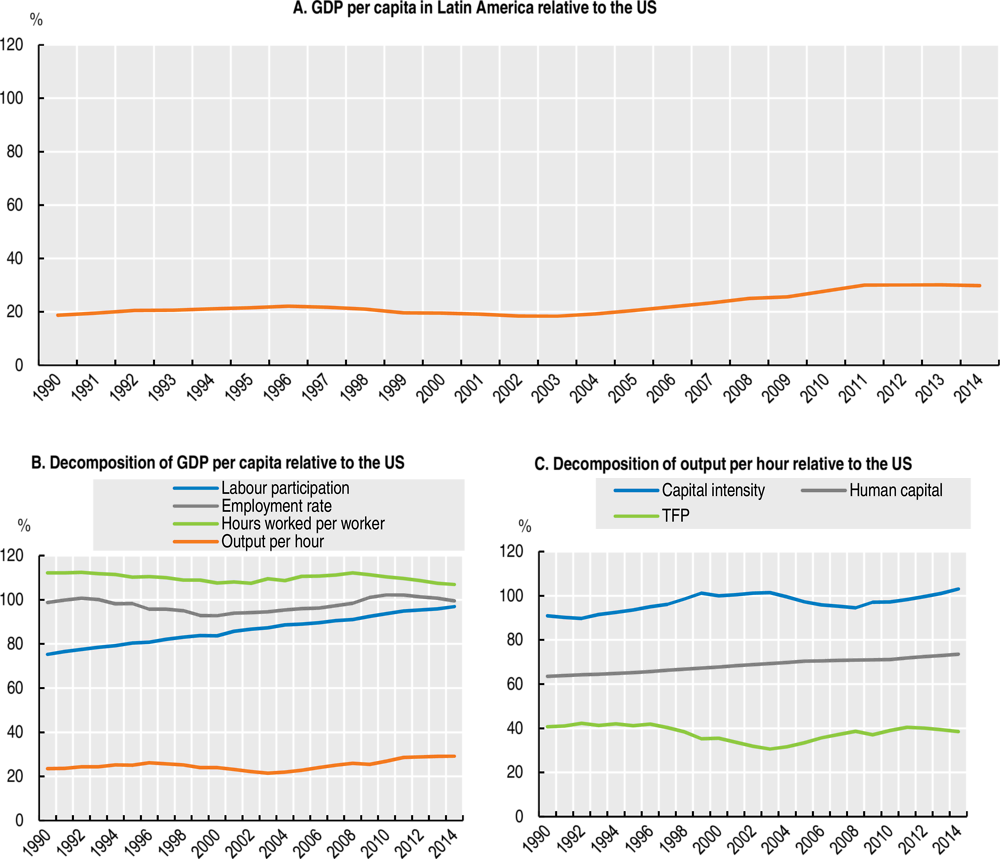
After a period of growth driven by factor accumulation and favourable external conditions, LAC countries need to ignite new sources of growth based on improving productivity. The lag on gross domestic product (GDP) per capita relative to most advanced economies (Figure 3.2, Panel A) is mostly explained by low labour productivity. GDP per capita can be understood through four components: labour market participation, employment rate, hours worked per worker and output per hour.2 A breakdown of these components shows that low labour productivity, defined by output per hour, is the main determinant of low levels of GDP per capita (Figure 3.2, Panel B). In this sense, the differences between LAC and the United States are not related to the quantity of work. Indeed, the hours worked by each worker in LAC, or the number of workers that contribute to GDP, have been catching up with levels in the United States. Rather, the key difference relates to quality of work – i.e. the amount of output produced in one hour of work. In fact, if LAC could increase output per hour to the level observed in the United States, the income gap between the two would disappear (CAF, 2018).
Figure 3.2. Decomposition of GDP per capita and output per hour in Latin America relative to the United States
Note: Countries included in the sample are Argentina, Brazil, Chile, Colombia, Costa Rica, Ecuador, Mexico, Peru, Uruguay and Venezuela.
Source: Own calculations based on Penn World Table 9.0 (database) and World Bank’s World Development Indicators.
The efficiency in the use of inputs in the production process – i.e. total factor productivity (TFP) – remains poor in LAC countries. Applying a development accounting exercise, output per hour can be broken down into three components: a measure of physical capital intensity, human capital per worker and TFP.3 TFP, which is about 37% of that of the United States, appears as the main explanation for low productivity levels (Figure 3.2, Panel C). If TFP in LAC were to rise to US levels, output per hour and income per capita relative to the United States would increase to 76% and 78%, respectively.
Differences in human capital are also important, although not as much as TFP. The average worker in Latin America has about three-quarters of the human capital of the average worker in the United States. Closing the gap in human capital would raise both output per hour and income per capita to about 40%. In this respect, LAC will only significantly reduce the income gap with respect to the developed world if it increases its aggregate TFP. In other words, convergence will only be possible if productivity grows consistently and significantly above what is observed in developed countries (CAF, 2018). Several factors are behind poor performance in productivity in the region, including lack of credible and capable institutions, as well as poor regulatory frameworks (Pérez Caldentey and Vernengo, 2017; CAF, 2018).
Low productivity is a concern for all economic sectors in LAC. Indeed, a breakdown of ten sectors of the economy shows that sectoral labour productivity was, on average, 33% that of the United States. In no sector was it above 50% (Table 3.1) (CAF, 2018). Low levels of productivity across all sectors of the economy suggest this is a cross-cutting issue and that enabling conditions for productivity growth are missing in LAC. In this respect, deep, long-term structural reforms are needed to overcome the slowdown in productivity growth. However, differences in productivity levels across sectors of activity are not negligible. This suggests that there is scope for productivity-enhancing structural transformation through labour flows from low-productivity activities to high-productivity ones (McMillan and Rodrik, 2011).
Table 3.1. Sectoral output per worker in Latin America relative to the United States (2010)
|
Sector |
Relative labour productivity |
|---|---|
|
Agriculture |
0.21 |
|
Mining |
0.50 |
|
Manufacturing |
0.34 |
|
Electricity, gas and water supply |
0.36 |
|
Construction |
0.37 |
|
Trade services |
0.29 |
|
Transport services |
0.39 |
|
Business services |
0.19 |
|
Government services |
0.40 |
|
Personal services |
0.28 |
|
Average |
0.33 |
Note: Labour productivity for all countries is expressed as a fraction of that of the United States. Countries included in the sample are Argentina, Brazil, Bolivia, Chile, Colombia, Costa Rica, Mexico and Peru.
Source: Own calculations based on GGCD 10-Sector database (Timmer, de Vries and de Vries, 2015).
A focus on the formal manufacturing sector shows the productivity gap with respect to the United States is mainly due to low productivity across all manufacturing sub-sectors rather than by a particularly poor allocation of employment across them. In fact, labour productivity of the average manufacturing sub-sector is 30% that of the United States.4 The low productivity within each sub-sector, in turn, is not due to an inefficient distribution of labour across establishments.5 Rather, it is mostly explained by the low average productivity of establishments, which is on average about 35% that of the United States. That is, the low productivity of the average establishment largely explains the productivity gap in the manufacturing sector (though only formal firms are included in this analysis and the productivity gap with informal firms is expected to be significant). Conversely, misallocation across sub-sectors and establishments plays a larger role in explaining the labour productivity gap in the service sector, compared to what is observed in manufacturing (CAF, 2018).6
Poor productivity performance is associated with the existence of a productivity trap, which is mainly related to an export structure concentrated in sectors of low levels of sophistication. Notwithstanding the fact that productivity is low across all sectors, there are large differences between certain sectors, particularly between the formal and informal economy. These differences suggest that additional specific features of LAC’s economic structure and export model are limiting the capacity of igniting a virtuous circle of productivity growth.
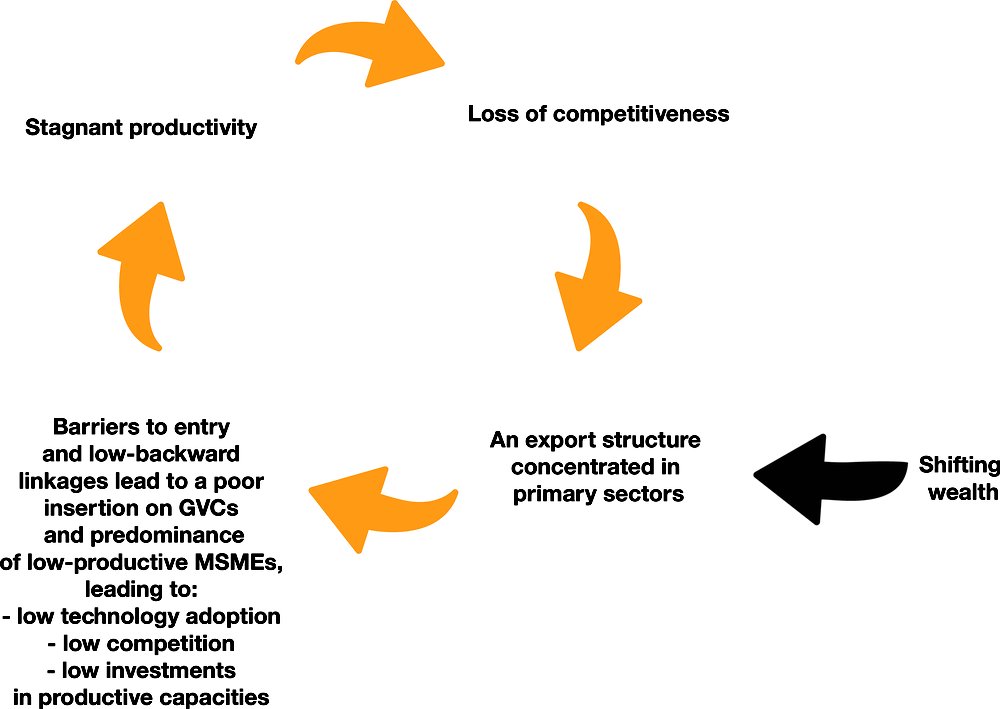
A productivity trap is at play in LAC: the stagnant productivity performance is associated with an export structure biased towards primary sectors with low levels of sophistication (such as agriculture, fisheries or mining) (Figure 3.4). This has created an export structure that presents barriers to entry and does not generate backward linkages in the economy. This, in turn, makes it difficult for micro, small and medium-sized enterprises (MSMEs), which are abundant in LAC, to connect to international markets. Hence, the region has poor insertion into GVCs. Poor participation of LAC in GVCs is associated with low levels of technology adoption and few incentives to invest in productive capacities. In all, competitiveness remains low, making it difficult to move towards a more sophisticated export structure and higher added-value segments of GVCs. This fuels a vicious circle that negatively affects productivity (Figure 3.3).
Figure 3.3. The productivity trap in Latin America and the Caribbean
Source: Own elaboration.
This dynamic has gained relevance in light of declining demand for commodities and the need to ignite new drivers of growth that boost productivity. The process of shifting wealth, by which the centre of gravity of the global economy has been moving eastwards, is entering a new phase. This is mainly due to China’s shift from an economic model based on investment to one of consumption, which has a large impact on global demand for commodities (OECD/CAF/ECLAC, 2015). The shift also has an impact on international commodity prices, critical for LAC’s export model.
In addition, LAC is entering a new phase: given that the region cannot grow by merely accumulating factors of production, it needs to ignite new sources of growth based on improved productivity. More precisely, productivity must be raised, but in a way that it enables a more equal distribution of income, sectoral diversification of exports and environmental sustainability (what is called by ECLAC “genuine productivity”; ECLAC, 2015).
Disentangling the productivity trap
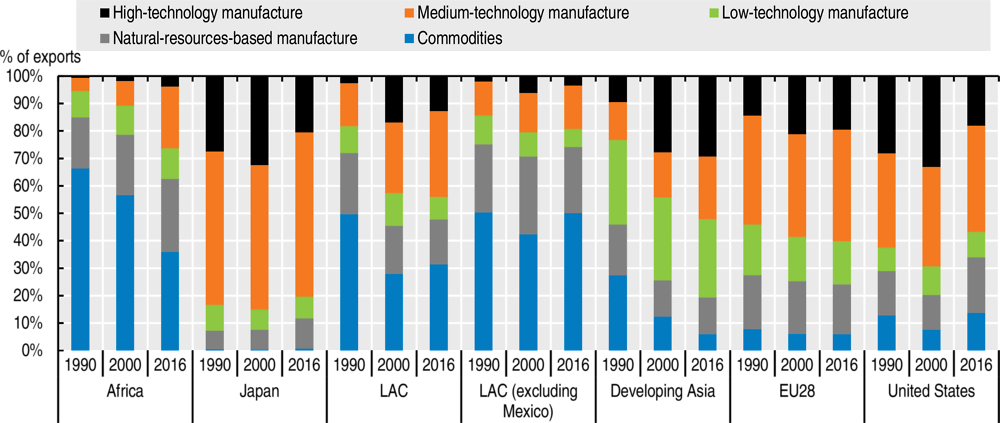
Low competitiveness in LAC has been associated with a relatively high concentration of exports on primary sectors with low technology levels. Since the beginning of the century, exports in the region have further concentrated on primary goods and on the basic manufacturing of natural resources. In 2016, on average for LAC (excluding Mexico), 50% of exports were commodities (up from 42% in 2000). Another 23% were natural-resource-based manufactures, with less than 5% being manufactures with high technology and only around 15% manufactures with medium technology (Figure 3.4).
Figure 3.4. Export structure by technology level, world regions (1990-2016)
The low value-added of LAC’s productive structure is reflected in the weak integration of the region into GVCs. The region’s participation as a source of foreign value-added in world exports (forward linkages) remains negligible. Meanwhile, the share of foreign value-added in Latin American exports (backward linkages) is considerably lower than that of other regions. The seven Latin American countries for which data are available had a joint participation of only 4% as origin of the foreign value-added embodied in world exports in 2014 (compared with nearly 3% in 1995).
The role these seven countries play as a source of foreign value-added is nearly 10% for the United States and Canada, 5% for China, 3% for the rest of Southeast Asia and 2% for the European Union. Moreover, along with low levels of forward linkages, Argentina, Brazil, Chile, Colombia, Costa Rica and Peru also have considerably lower backward linkages than other regions, particularly the European Union and Southeast Asia. In 2014, only 13% of the value exported by these six countries was generated in other economies. This compares with 19% for the United States, Canada and Mexico and some 30% in the case of the European Union, China and the rest of Southeast Asia (OECD/CAF/ECLAC, 2018).
This export profile is linked to the predominance of low-productive MSMEs in LAC. LAC’s economic structure is composed of 99.5% MSMEs, which account for 61% of formal employment. However, they only represent 25% of total production (Table 3.2). The low contribution of MSMEs to GDP stands in sharp contrast to their contribution in the European Union, where they represent around 56% of total production (Dini and Stumpo, 2018).
Table 3.2. Latin America: Share of firms’ number, employment and production for different types of enterprises (percentages)
|
Firms |
Employment |
Production |
|
|---|---|---|---|
|
Micro enterprises |
88.4 |
27.4 |
3.2 |
|
Small enterprises |
9.6 |
19.7 |
8.8 |
|
Medium enterprises |
1.5 |
14.0 |
12.6 |
|
Large enterprises |
0.5 |
38.9 |
75.4 |
Source: Dini and Stumpo (2018).
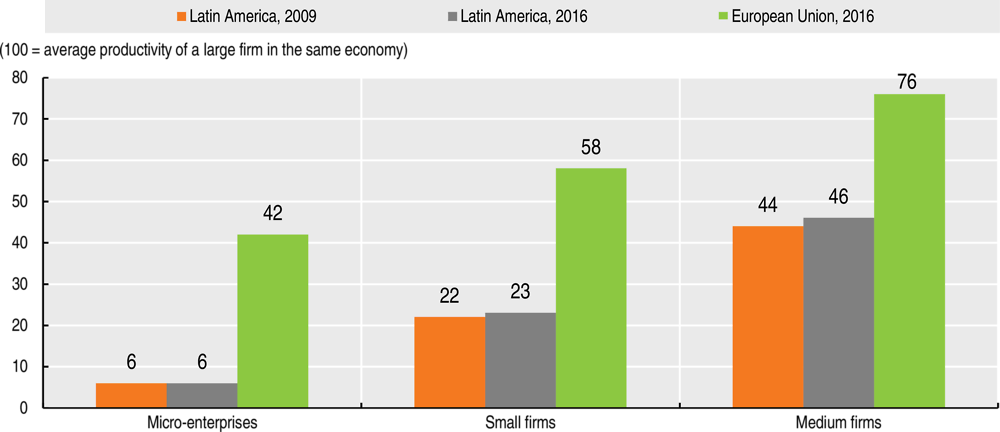
The low contribution of MSMEs to total production shows they have low levels of productivity and tend to be concentrated in low-productive sectors. This, in turn, leads to a low contribution to exports. Relative internal productivity measures show that, in 2016, the labour productivity of a medium-sized company in LAC was, on average, less than half that of big companies. Small and micro enterprises were exhibiting an even poorer performance, reaching only 23% and 6% of big companies’ productivity, respectively. Conversely, in the European Union, MSMEs reach 42%, 58% and 76% of big companies’ productivity, respectively (Figure 3.5).
Figure 3.5. Relative internal productivity of MSMEs in Latin America and the European Union
Note: Relative internal productivity refers to the productivity of MSMEs relative to the productivity of large firms.
Source: Dini and Stumpo (2018).
The productivity gap between MSMEs in LAC is also higher than in the European Union. In fact, the productivity of a medium-sized enterprise is less than twice that of a micro establishment in the European Union. In LAC, this gap is larger than seven times. Low productivity levels across MSMEs in LAC translate into a scarce contribution to total exports. While MSMEs in the European Union generate more than half of total exports, large companies in LAC account for more than 80% of regional exports (Dini and Stumpo, 2018).
The concentration of LAC’s exports on primary sectors further limits the capacity of MSMEs to improve their productivity. At the same time, the predominance of low-productive MSMEs represents a barrier towards achieving an upgraded export structure. In this sense, LAC’s export profile is both cause and consequence of an economic structure where low-productive MSMEs are predominant.
Two self-reinforcing effects are at play. First, the export profile of LAC makes it more difficult for MSMEs to connect to GVCs, adopt technology and compete in international markets, leaving them unproductive. This export profile is characterised by few large companies specialised in natural resource-intensive sectors and some high-intensity capital services. In this context, MSMEs face barriers and disincentives to participate in activities with higher value-added. This occurs both because these activities demand high capital investments and because they do not create backward linkages that help them in accessing international markets. In this situation, the role of MSMEs is limited to providing employment with low levels of quality, stability and wages. They remain in low-productive sectors where they do not face barriers to entry. They serve local markets, and have few incentives to connect with firms in other stages of a productive chain. The productive structure thus significantly conditions the modalities of insertion of MSMEs into the regional economy, their potential contributions and ultimately the global level of productivity that can be achieved.
Second, many MSMEs remain small and unproductive. They have no incentives to invest in productive capacities or to incorporate technology, and face no international competition. As a result, their productivity stagnates. They remain concentrated in low-productive sectors, which eventually favours an export structure focused in sectors of low sophistication. This is aligned with the self-selection hypothesis of the new “new trade theory”, which predicts that more productive firms self-select into export markets, and hence that less-productive firms remain serving local markets (Melitz, 2003). In all, the concentration in these sectors leads to low levels of productivity, which make it difficult to upgrade the productive structure.
The political economy in LAC further complicates these dynamics. In economies with high levels of corruption companies may adopt rent-seeking practices and use policy capture to avoid competition through legal protection, rather than by gaining a competitive edge through innovations. This has an impact on productivity, as there is undue influence on politicians and the administration to create market entry barriers and avoid competition – which enhances productivity – and also because innovation becomes a relatively less interesting choice than policy capture, hence creating another barrier to productivity growth (OECD, 2018a).
The social vulnerability trap
The vulnerable middle class has become the largest socio-economic group in LAC. Poverty reduction since the beginning of the century has been remarkable. In fact, poverty (defined as daily income below USD 5.50 [2011 PPP]) fell in LAC from 42.9% to 24.6% over 2000-16. Yet most of those who escaped poverty are now part of a vulnerable group. A negative shock, such as unemployment, sickness or ageing, among others, could force them back into poverty. This vulnerable middle class (USD 5.50-13.00 a day in 2011 PPP) jumped from 32.0% to 37.6% between 2000-16. Today it represents the largest socio-economic group in the region (Figure 3.6) (CEDLAS and World Bank, 2018).
Figure 3.6. Latin American population by socio-economic groups
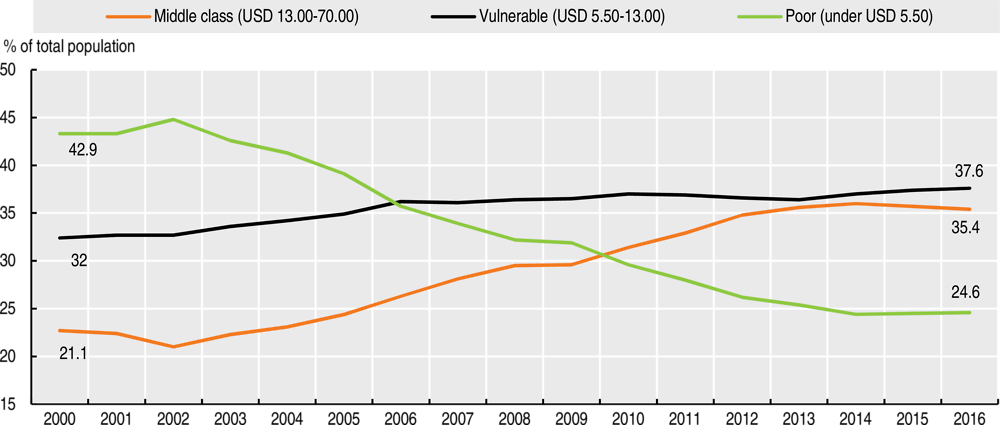
Note: Socio-economic classes are defined using the world classification: “Poor” = individuals with a daily per capita income of USD 5.50 or lower. “Vulnerable” = individuals with a daily per capita income of USD 5.50-13.00. “Middle class” = individuals with a daily per capita income of USD 13.00-70.00. Poverty lines and incomes are expressed in 2011 USD PPP per day (PPP = purchasing power parity). The LAC aggregate is based on 17 countries in the region for which microdata are available: Argentina (urban), Bolivia, Brazil, Chile, Colombia, Costa Rica, Dominican Republic, Ecuador, El Salvador, Guatemala, Honduras, Mexico, Nicaragua, Panama, Paraguay, Peru and Uruguay (urban).
Source: Own calculations based on LAC Equity Lab tabulations of SEDLAC (CEDLAS and the World Bank, 2018).
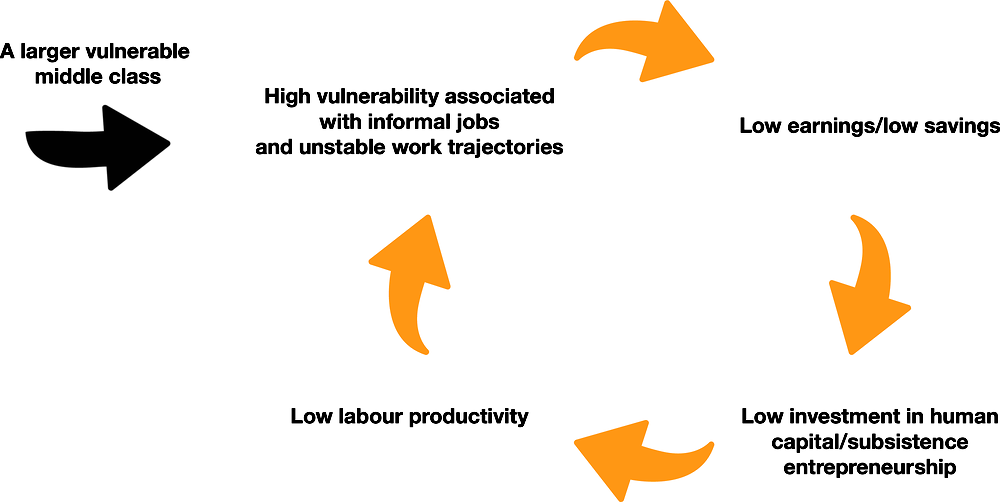
The expansion of the vulnerable middle class has come with new challenges. More people are affected by a vicious circle – the social vulnerability trap – that perpetuates their vulnerable status. The mechanism of this vicious circle works as follows: those belonging to the vulnerable middle class have low quality, usually informal jobs associated to low social protection and low – and oftentimes unstable – income. Consequently, they face more limitations to invest in their human capital or to have the capacity to save and invest in a dynamic entrepreneurial activity; in these conditions, they remain with low levels of productivity, hence only with access to low quality and unstable jobs that leave them in a vulnerable situation (Figure 3.7). This trap operates at the level of the individual, who is locked in a vulnerable status; conversely, the productivity trap refers to a circular relationship affecting the whole economy.
Figure 3.7. The social vulnerability trap in Latin America and the Caribbean
Source: Own elaboration.
The incidence and policy relevance of the social vulnerability trap have increased in recent years for several reasons. First, more people are affected today by this vicious circle. Second, external conditions are increasing pressure on vulnerable populations. The favourable global context that has helped lift a large share of the population out of poverty since the beginning of the century is no longer as supportive. In fact, poverty reduction has been slowing down, and has even increased from 24.0% to 24.6% between 2014 and 2016. In addition, some trends, such as the ageing population or the potential impact of technological change on jobs, are putting additional pressure on some vulnerable populations. In all, the social vulnerability trap is exacerbated by both domestic and external factors and is affecting a larger share of the population, thus making the policy response more urgent.
Disentangling the social vulnerability trap
One of the most salient characteristics of people in the vulnerable middle class, and a key determinant of their vulnerability, is the low quality of their jobs. In particular, labour informality is predominant among the vulnerable, with a rate of informality of 56% for the LAC average. This is significantly above the level for the consolidated middle class, at 36% (Figure 3.8) (OECD/CAF/ECLAC, 2018). Informality levels for the vulnerable have been relatively stable over time (56% also in 2004), suggesting its main drivers remain unchallenged. While heterogeneities across countries are large, the rate of informality for the vulnerable consistently appears above 40%. Informal jobs are characterised by low levels of income, poor working conditions, low or no access to social protection and difficulties in accessing public services, such as transport and housing in cities, among others (CAF, 2017; OECD/CAF/ECLAC, 2016; OECD, 2017). In sum, jobs are not a source of sufficient levels of income and social protection for many, particularly for members of the poor and vulnerable socio-economic groups.
Figure 3.8. Labour informality by socio-economic group in selected Latin American countries (2014 or latest year available)
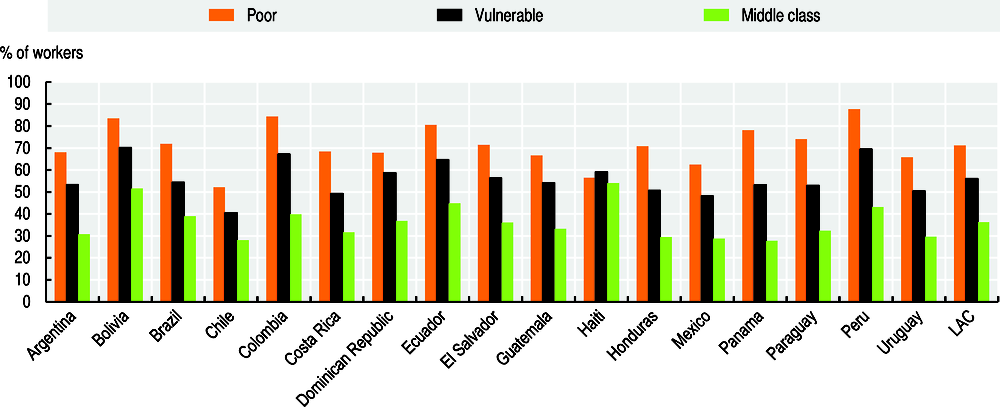
Note: Legal definition of informality: workers without the right to a pension, health insurance, social protection, work contracts and the general entitlements of the formal sectors.
Source: Own calculations based on OECD and World Bank tabulations of SEDLAC (CEDLAS and the World Bank, 2018).
Work trajectories are unstable in LAC, with predominance of short-term jobs and high levels of rotation, particularly among most disadvantaged socio-economic groups. One in four Latin American workers aged 25-54 has been working for his or her current firm for one year or less (IDB, 2015). Similarly, between 20% and 40% of workers aged 25-45 in Argentina, Colombia, Brazil, Mexico, Paraguay, Peru and Venezuela have been in unemployment or inactivity at least once for between 1.5-5.0 years depending on the country; and 50% have been in informality at least once (IDB, 2015).
In addition, there appear to be barriers to escaping informality. Only 30% of the unemployed who find a job do it in the formal sector (IDB, 2015). Likewise, yearly transitions out of informality of adults aged 30-55 in Argentina, Brazil, Chile and Mexico show that, on average, 70% of men and 67% of women move to another informal job; only 21% and 10%, respectively, move to a formal job (OECD/CAF/ECLAC, 2018). Yearly transitions for young people (aged 15-29) in these same countries show that, on average, 57% of men and 50% of women who leave an informal job move to another informal job (OECD/CAF/ECLAC, 2016) (Figure 3.9). In all, these dynamics suggest high levels of rotation. This implies that most workers, particularly among vulnerable populations, will experience in their work trajectories periods of inactivity, unemployment and informality.
Figure 3.9. Yearly labour market transitions out of informality in Latin America
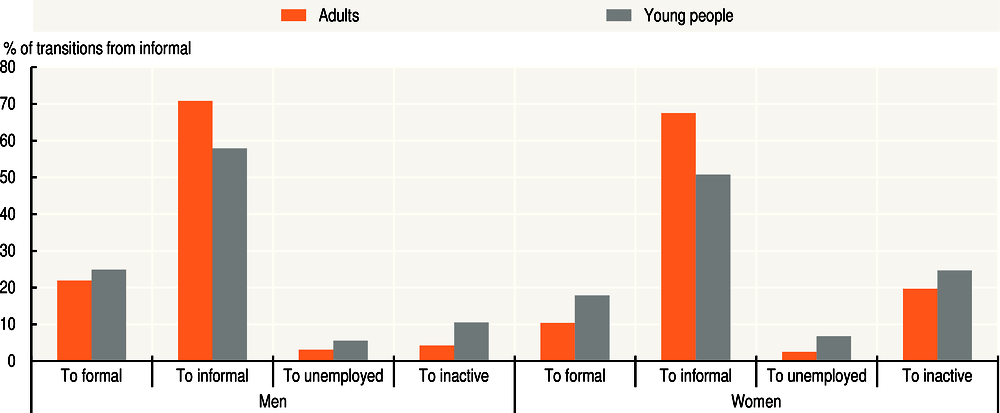
Note: Results show the average for Argentina, Brazil, Chile and Mexico. These are yearly transition rates out of informal jobs for the pooled period 2005-15. Transition rates are calculated as the ratio between flow of people moving that transitioned from Condition 1 to Condition 2 between time 0 and time 1, over the total stock of people in the population in Condition 1 in time 0 (i.e. informal employment to formal employment). The transitions are year to year (from year t to year t+1). This analysis is limited to urban populations because of data availability. Data for Argentina are representative of urban centres of more than 100 000 inhabitants.
Source: Own calculations based on OECD and World Bank tabulations of LABLAC (CEDLAS and the World Bank, 2018).
The predominance of low quality, informal jobs, alongside the high level of rotation between precarious labour situations, leaves many workers vulnerable. They experience low and unstable income flows and poor levels of social protection. Hourly wages for informal workers represented, on average for LAC, half of hourly wages for formal workers (CEDLAS and the World Bank, 2018). These income flows are unstable, given the levels of job rotation (IDB, 2015). In addition, most people in this group have poor access to social protection through jobs. For instance, their contributions to a pension system, if any, can be limited and not sufficient to reach a minimum pension level when retired. In fact, only around 40% of the population aged 65+ had access to a contributory pension in 2010 (Bosch, Melguizo and Pagés, 2013).
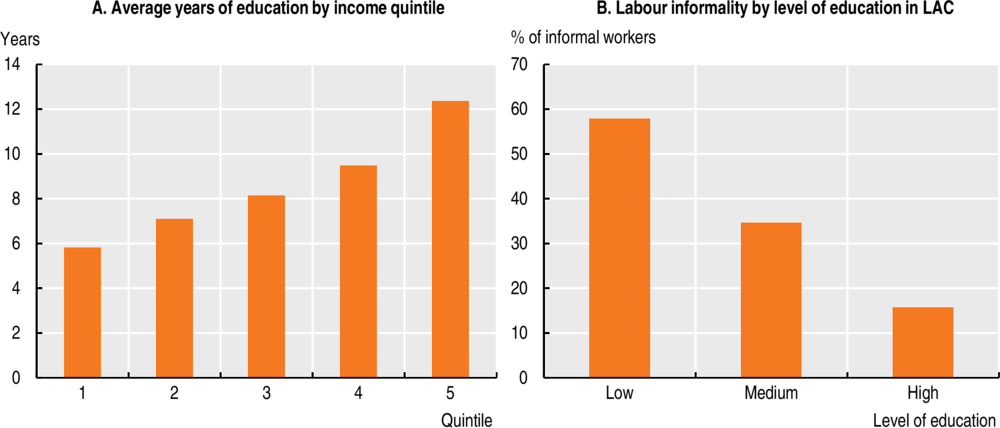
Low and unstable income flows, together with low social protection and a general perception of vulnerability, lead to low investments in education. In fact, despite broad improvements in access to education across LAC countries, differences are still large between socio-economic groups. Average years of education for individuals in the 2nd and 3rd income quintile – those where most of the vulnerable are found – are approximately seven and eight years, respectively, relative to almost ten years of average education for people in the 4th income quintile (Figure 3.10). Three main reasons support the idea that workers in the vulnerable middle class do not invest in their human capital. First, given their low income and vulnerability, they cannot afford to spend long periods unemployed or inactive. Hence, they cannot devote significant time to invest in their own human capital. Second, as these workers usually work in low quality, short-term jobs, learning processes at the workplace are poor, and investment in training by firms scarce. Indeed, informal jobs usually take place in work settings of low value-added; the skills that workers learn are not applicable in more productive establishments. Also, firms have no incentives to train their workers. These firms tend to be small and fear their investment in training will be lost if workers are employable in larger, better-paying firms. Furthermore, they have limited resources to invest in training. Third, because these workers are usually outside formal channels of training, they do not have access to training programmes.
Figure 3.10. The link between education, income and labour informality in Latin America
In sum, a large – and growing – share of the population in LAC is trapped in its vulnerable status. Workers in this group usually hold informal jobs and rotate a lot between different labour statuses. This leaves them vulnerable as they have insufficient and unstable income flows and poor access to social protection. This, in turn, prevents them from saving and investing either for their own human capital or to start a dynamic entrepreneurial activity. Eventually, this leaves people in this group with low levels of productivity and little capacity to escape their vulnerable situation.
The institutional trap
Citizens’ demands are rising and remain unmet
The expansion of the middle class in LAC – which today represents a third of the population – has been accompanied by larger aspirations and demands for better quality public services and institutions. This consolidated middle class (USD 13.00-70.00 a day PPP 2011) grew from 21.1% to 35.4% between 2000 and 2016. This expansion is not only related to income, but also to self-perceptions; some people have middle-class aspirations even when their income levels are not necessarily those attributed to middle-class groups. In fact, around 40% of the population in LAC considers itself as middle class (Latinobarometro, 2015). These phenomena have implications in terms of values and social demands, as middle-class citizens are believed to be strong supporters of democracy, while being critical of how it functions (OECD, 2010).
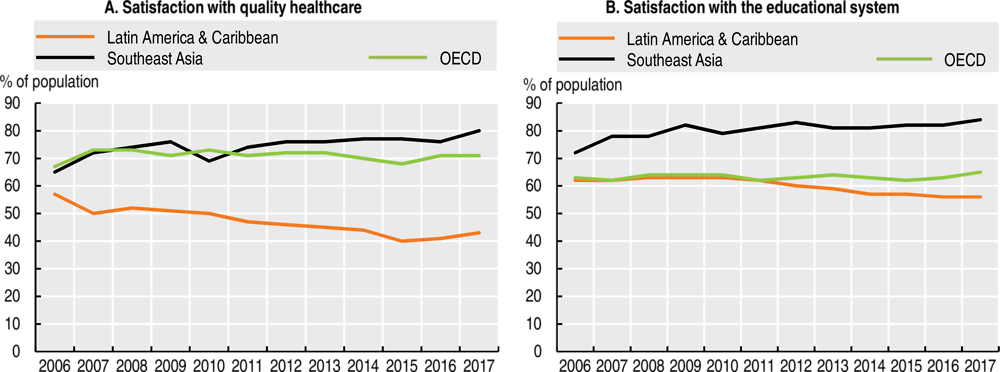
The increased expectations of the consolidated middle class and the sense of instability of the vulnerable class add up as relevant drivers of falling satisfaction levels with public services witnessed in LAC in recent years (Daude et al., 2017). From 2006 to 2017, the share of the population satisfied with the quality of healthcare services fell from 57% to 43%, well below levels in the OECD economies of around 70%. Likewise, satisfaction with the education system fell from 63% to 56% over the same period, below the OECD levels of 65% in 2017 (Figure 3.11) (OECD/CAF/ECLAC, 2018).
Figure 3.11. Satisfaction with public services in Latin America, Southeast Asia and OECD
Note: The results are weighted averages (based on the population of each individual country belonging to these regions).
Source: Own calculations based on Gallup (2019).
Various indicators of trust and openness are also symptomatic of the magnitude of citizen dissatisfaction: almost 63.9% of Latin American citizens have no confidence in their national governments. Many citizens also perceive politics as not being inclusive (OECD, 2018a; OECD/CAF/ECLAC, 2018). Finally, increasing interconnectedness favoured by technological advances may have created new paradigms of social progress. It is easier to compare progress in LAC against societies of higher levels of development, thus inflating aspirations among younger generations (OECD/CAF/ECLAC, 2018).
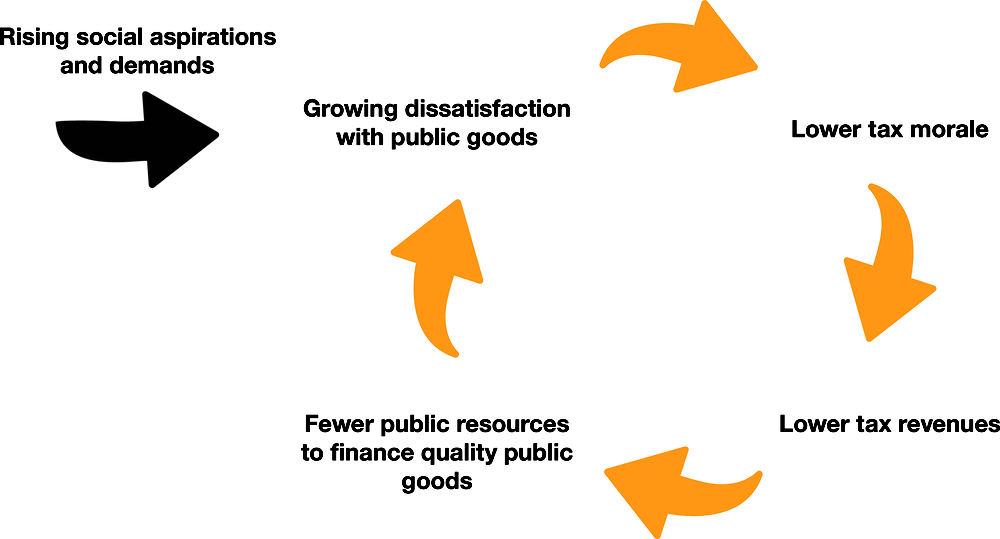
The unmet demands of a large share of the population fuel an institutional trap in Latin America that jeopardises the sustainability of the social contract. Rising aspirations are putting additional pressure on institutions, which are unable to respond to evolving citizens’ demands. In addition, longstanding institutional weaknesses and the incidence of policy capture are relevant issues in LAC, as suggested by the high levels of perception of corruption and broad mistrust in institutions declared by citizens (OECD/CAF/ECLAC, 2018). All these elements create social disengagement, with citizens seeing less value in fulfilling social obligations such as paying taxes. Tax revenues are thus negatively affected, hence limiting the available resources for public institutions to provide better quality goods and services and respond to the rising aspirations of society. This institutional trap is a vicious circle (Figure 3.12) that has large implications. It perpetuates inequalities and creates a social fracture that strongly weakens the social contract.
Figure 3.12. The institutional trap in Latin America and the Caribbean
Source: Own elaboration.
Disentangling the institutional trap
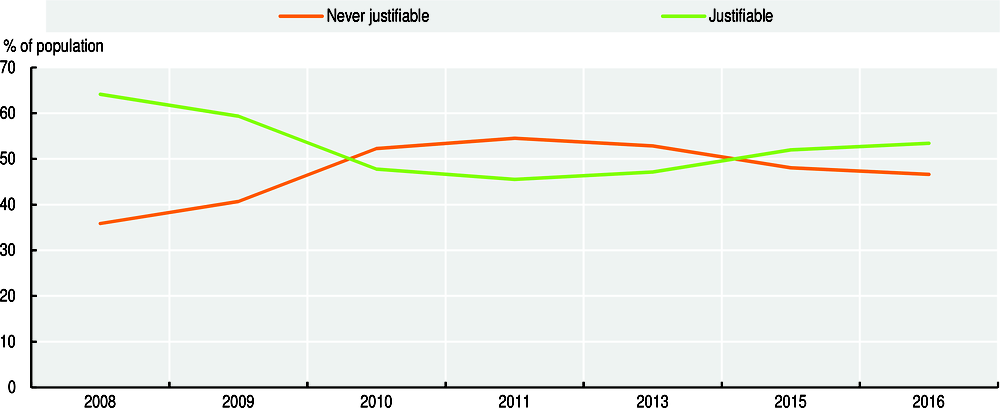
Lower levels of satisfaction with public goods, together with declining levels of trust in public institutions, have eroded “tax morale” in the region. “Tax morale” refers to the willingness of citizens to pay taxes, which has declined in recent years. Indeed, after a period between 2008 and 2011 where “tax morale” increased, 53.4% of the population justified not paying taxes in 2016, up from a level of 46% in 2011 (Figure 3.13).
Figure 3.13. Tax morale in Latin America: Do citizens find it justifiable not to pay taxes?
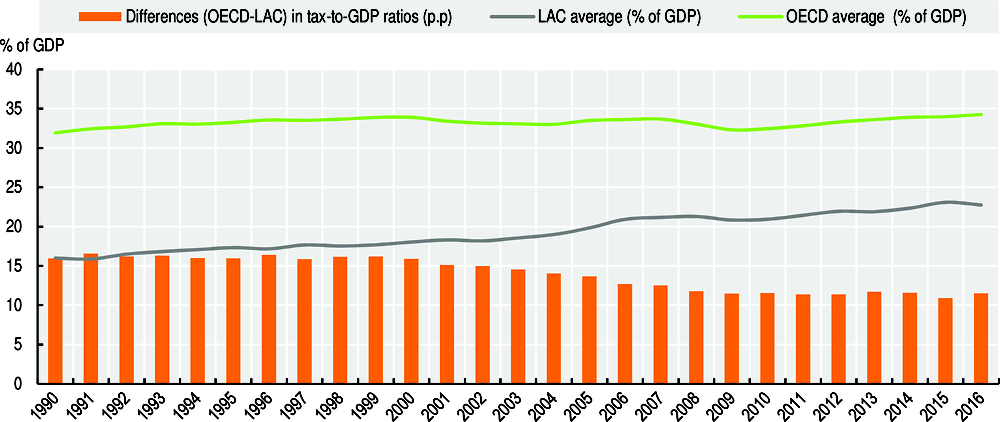
Lower tax morale negatively affects the capacity of the state to expand tax revenues, which are already low in LAC. This, in turn, limits resources available to improve public goods and services. In 2016, despite steady increases since the 1990s, tax revenues in LAC (22.7% of GDP) remained well below the corresponding OECD figure (34.3% of GDP). This was the case despite large disparities across LAC countries ranging from 12.6% in Guatemala to 41.7% in Cuba (Figure 3.14) (OECD/ECLAC/CIAT/IDB, 2018). This illustrates the limited resources that are available to improve public services and the functioning of institutions, and reinforces the importance of building trust and fiscal legitimacy to break the institutional trap at play.
Figure 3.14. Tax-to-GDP ratios, LAC and OECD averages, 1990-2016
Low fiscal resources limit the capacity of public institutions to respond to society’s rising aspirations, fuelling a vicious circle that is weakening the social contract in LAC. In fact, this dynamic can aggravate inequalities across socio-economic groups and further increase disengagement from public matters.
On the one hand, individuals from high- and middle-class households usually channel their dissatisfaction with public services by opting out, moving towards better quality private services they can afford. This may explain why a large share of Latin Americans with sufficient income choose private education and health over universal public services. For instance, the share of secondary students enrolled in private schools is strongly linked to household income, with a drastic increase for the fourth- and fifth-income quintile.
On the other hand, individuals from the vulnerable middle class and poor households are also dissatisfied with the quality of public services. However, since they do not necessarily have the income to opt out, they continue using low-quality public services. These groups, which together represent around 70% of the population, are dissatisfied for different reasons. They find few incentives to firmly engage in the social contract. Consequently, the quality of public services deteriorates, affecting mostly those who continue to use the services because their lack of resources leaves them no choice (OECD/CAF/ECLAC, 2018).
The environmental trap
Environmental challenges remain pressing and diverse in LAC. A crucial one is related to forest loss. Indeed, the rate of deforestation remains among the highest in the world, though it has slowed down in recent years. The largest cause of forest loss is land clearing for agriculture, which is often exacerbated by unclear or lack of land tenure. Another pressing environmental challenge is linked to water. While water resources are relatively abundant, many arid and semi-arid regions are facing increasing scarcity as a result of growing water demand and reduced water availability due to climate change. Air and water pollution also represent a relevant environmental issue for LAC. In particular, local air pollution is a concern in some large cities in the region (OECD, 2018b; OECD, 2018c).
These environmental challenges are putting pressure on the conservation and sustainable use of biodiversity. This is particularly relevant for LAC, which is one of the most important regions in the world in terms of biodiversity and ecosystems. In fact, it holds an estimated 40% of the world’s biological diversity, and 6 of the 17 “megadiverse countries” are in LAC (OECD, 2018b).
Climate change is another crucial environmental challenge which is having physical and economic consequences in LAC. Significant changes in rainfall patterns and temperature have been observed, affecting yields and agriculture. As well, the region has experienced more catastrophic events linked to climate change (Magrin et al., 2014; ECLAC, 2018). This is particularly pressing for small Caribbean states (see Chapter 6). In 2015, the economic cost of climate change in the region was estimated at USD 100 billion (Vergara, Fenhann and Schletz, 2014). A temperature rise of around 2.5ºC could reduce economic output by 1.5-5% of GDP (ECLAC, 2015). Moreover, the increase of environmental disputes over scarce resources, the spread of vector-borne diseases, population movements and resource mobilisation due to extreme climatic events all pose a major risk for social and economic achievements.
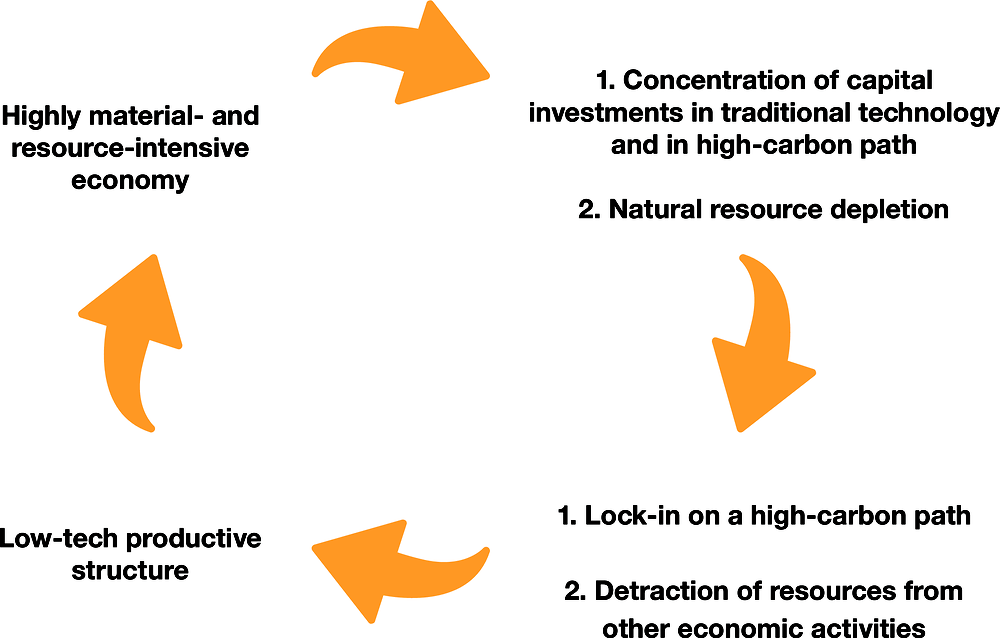
The environmental challenge in LAC is aggravated by an environmental trap towards which the region seems to be heading. In essence, this trap is linked to the productive structure of most LAC economies, which is biased towards high material and natural resource-intensive activities. This concentration may be leading these countries towards an environmentally and economically unsustainable dynamic for two reasons. A concentration on a high-carbon growth path is difficult – and costly – to abandon; and natural resources upon which the model is based are depleting, making it unsustainable (Figure 3.15). This has also gained importance in recent years, with LAC countries showing an increasingly stronger commitment to global efforts to fight climate change.
Figure 3.15. The environmental trap in Latin America and the Caribbean
Source: Own elaboration.
Disentangling the environmental trap
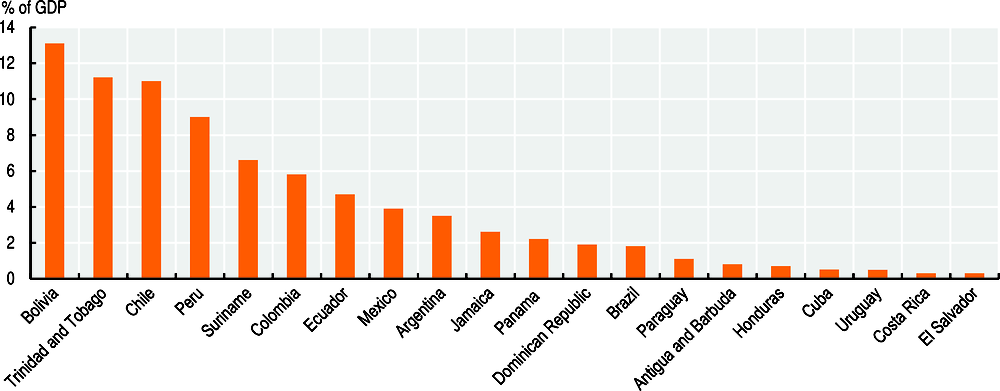
Growth in many LAC countries is characterised by large environmental inefficiencies. The economic model in LAC depends on the exploitation of natural resources as one of its main engines of growth. For example, mining and fossil fuels currently represent a significant share of GDP in many countries (Figure 3.16).
Figure 3.16. Fossil fuels and mining: Contribution to countries’ GDP, 2017
Most countries in the region have succeeded in crossing over from an agricultural base to one more sophisticated. However, this transition has been associated with some environmental issues, mainly industrial pollution and higher greenhouse gas (GHG) emissions. Mining and energy extraction and infrastructure are also important drivers of biodiversity loss, because of the land-use change, high groundwater extraction, soil and water contamination and the hazardous waste generation they involve. Agriculture is still a relevant activity with a significant environmental impact. For example, agriculture is a threat to biodiversity, as a result of overgrazing, pesticide use and high water use. In all, the economic model, together with population growth, are driving land-use change, creating pollution and increasing resource demand (OECD, 2018b).
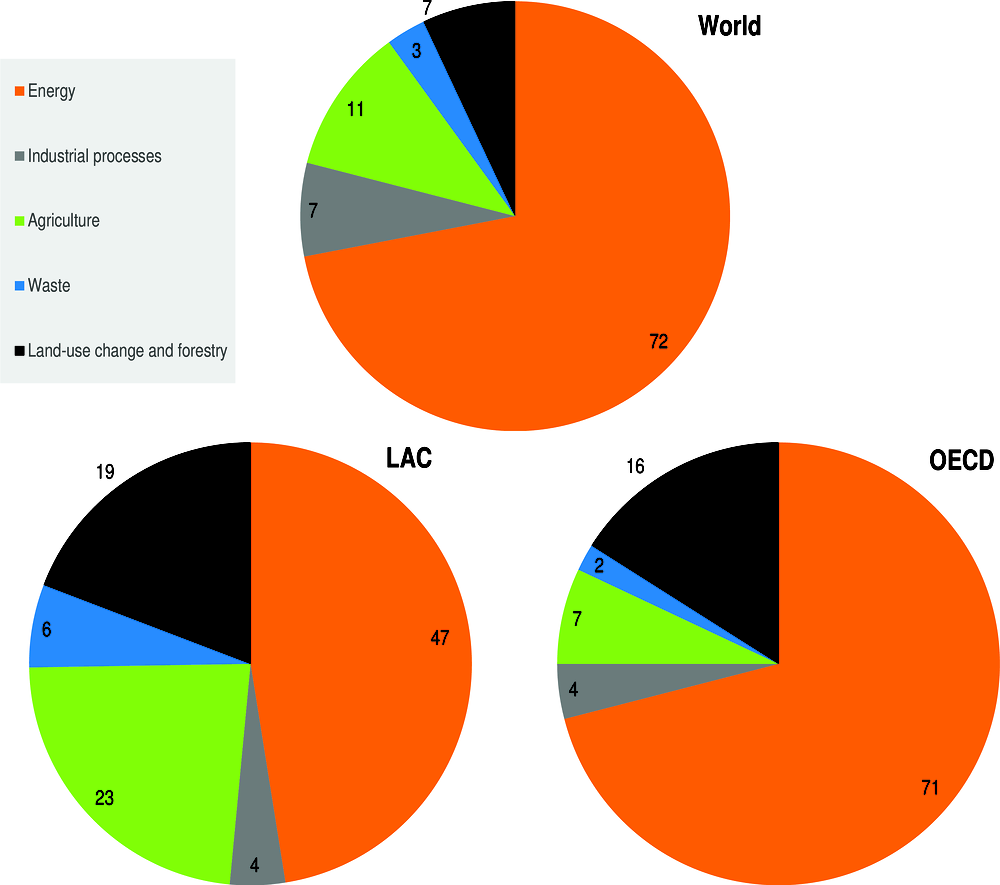
The economic structure that dominates in LAC countries is reflected in its composition of CO2 emissions. Agriculture, and land-use change and forestry generate 23% and 19%, respectively, of LAC’s emissions, versus an average of 11% and 7% for the world (Figure 3.17).
Figure 3.17. Greenhouse gases’ emissions by region and sector
(Percentage of total emissions)
The carbon intensity of the energy mix in LAC has grown in the last decades. GHG emissions related to energy use are the most important factor driving the upward trend in total emissions in LAC, as fossil fuels are the main energy source (coal, oil and natural gas). Between 1990 and 2014, energy use grew by 87% (2.7% per year), leading to a growth of energy-related GHG emissions of 96% in the same period (2.9% per year). The difference in growth rates between energy use and energy-related GHG emissions is explained by changes in the carbon content of energy use or carbon intensity of energy use (GHG emissions per unit of GDP), which has increased. In fact, the carbon intensity of energy use increased in LAC by 5% from 1990 to 2014 (0.2% per year). This increase has taken place even with a larger share of natural gas in the mix, and the reduction of oil’s share in 2015 with respect to 1990. This is mainly explained by a lower share of biomass in the energy mix and higher use of coal.
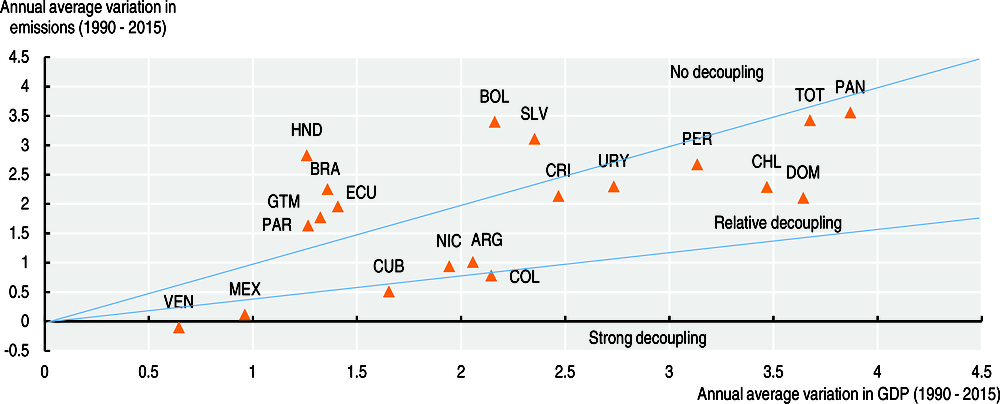
In sum, economic growth for many LAC countries has been strongly associated with growth in GHG emissions. The rate of growth of GHG emissions has been higher than GDP growth in many LAC countries, which have been unable to decouple the economic model from a high-carbon path (Figure 3.18). Other countries have had higher rates of GDP growth than the growth of GHG emissions, but still have remained in a relatively high-carbon path.
Figure 3.18. GDP growth vs. GHG emissions growth in Latin America and the Caribbean (1990-2015)
The concentration of many LAC countries in resource-intensive sectors following a high-carbon path is leading these economies into an environmental trap, mainly through two channels.
First, most investments in these kinds of economies are oriented towards activities based on traditional technologies and dependent on materials and fossil fuels. Hence, they are building a high-carbon economic model. As this model is consolidated, it becomes more difficult to move towards a low-carbon economy. In practice, reversing course requires more investment to dismantle and/or transform the existing infrastructure (e.g. an energy system based on fossil fuels, use of forest land for extensive agriculture, or a transport system mainly based on hydrocarbon). In addition, there are international considerations. Increasing low-carbon and low-material competition from countries that are shifting to these models, alongside a global stance on the fight against climate change, may impose further costs on high-carbon economic models. In this context, many LAC countries can find it increasingly difficult to compete and grow based on the current economic structure.
Second, this economic model is unsustainable in that it leads to depletion of the natural resources on which it is based. Indeed, resource-intensive economic models are intensive both in the extraction and use of natural resources. Extraction pollutes the environment, and it also exhausts the resources that are extracted, as they are generally finite. Also, the use of large amounts of energy and water in extraction depletes the very resources the model relies upon. In this sense, the model is unsustainable. Further, pollution deviates resources – i.e. investment – from other activities, hence fostering a concentration on extractive sectors. In all, countries can become “locked into” an environmentally and economically unsustainable model. This makes it difficult to move to more sophisticated and sustainable growth pathways with fewer environmental risks.
Overcoming the environmental trap and turning this vicious circle into a virtuous one will require bold policy reforms to move to a low-carbon economy and foster green growth. Existing policy frameworks and economic interests continue to be geared towards fossil fuels and carbon-intensive activities, as coal, oil and natural gas have fuelled economic development to date. To reverse this, an unprecedented infrastructure and technological transformation is needed, and policies and incentives need to be largely changed (OECD, 2018b; OECD/IEA/NEA/ITF, 2015). Also, enhanced international co-operation through the Paris Agreement or other international fora is an essential part of the transformation, and LAC countries have gradually shown a stronger commitment to these global efforts (OECD/World Bank/UN Environment Programme, 2018).
Interactions between these development traps
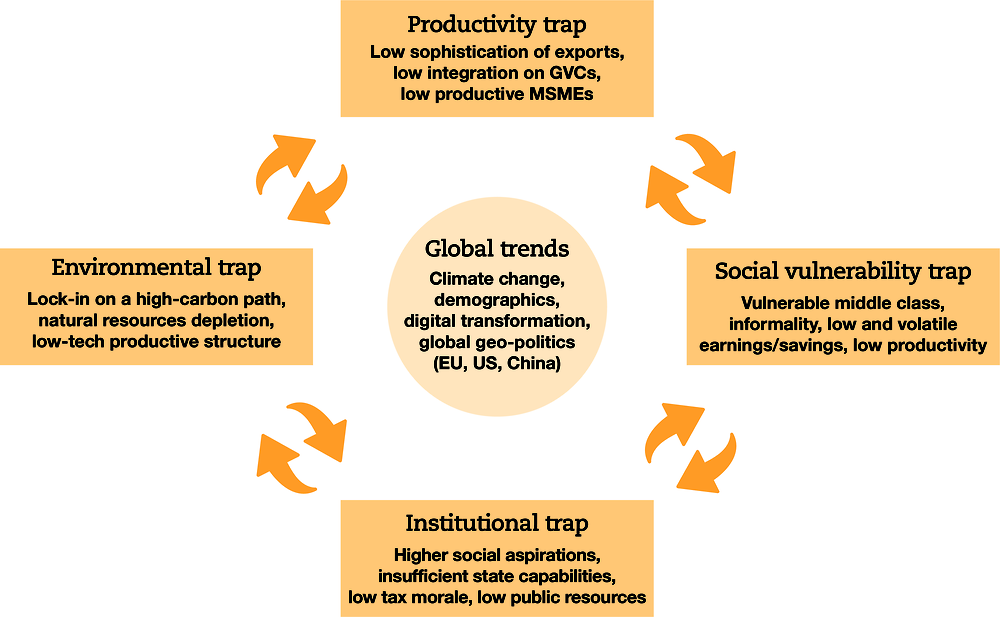
The four development traps interact and reinforce each other. This makes development challenges particularly complex and the need for sound analytical tools and co-ordinated policy responses increasingly relevant (Figure 3.19).
Figure 3.19. Development in transition traps in Latin America and the Caribbean
Source: Own elaboration.
There are many examples of how the traps are mutually reinforcing. With respect to the social vulnerability and productivity traps, the vulnerability associated with informal jobs is largely a by-product of low levels of productivity that characterise LAC countries. Meanwhile, informality itself acts as a strong barrier to increases in productivity and tax revenues (Busso, Fazio and Levy, 2012). Likewise, weak institutions and social vulnerability are mutually reinforcing. Populations are vulnerable because they lack an adequate safety net or because weak institutions do not provide them with quality public services such as education and health. At the same time, vulnerability weakens the capacity and willingness to pay taxes and comply with formal rules, weakening the institutional setup. The productivity trap is also directly linked to institutions, which appear as one of the main determinants of success for countries that overcame this challenge. Eventually, the environmental trap is also directly linked to diversification of the productive structure, and to the ability of the institutional setup to direct investments from resources and carbon-intensive sectors into environmentally efficient technologies. At the same time, environmental degradation and depletion reinforce the vulnerability trap by increasing the overall level of uncertainty.
Policy responses to overcome these development traps in LAC must consider their interactions. Better understanding the links and common causalities between different policy issues and objectives will be critical to develop responses that address their complex interactions effectively (see Chapter 4 Chapter 5). In this respect, it is critical to identify win-win policies that can promote synergies and help deal with trade-offs. The productivity-inclusiveness nexus, for example, suggests numerous linkages between these two policy objectives and calls for policies that can boost both at the same time (OECD, 2018d).
Overall, the development in transition narrative resonates with – and complements – the 2030 Agenda for Sustainable Development, which has 17 Sustainable Development Goals (United Nations, 2015).
Conclusions
LAC economies represent a good example of development in transition (DiT). In DiT countries, income indicates that economies are growing, but vulnerabilities confirm challenges in several other development outcomes. Progress since the beginning of the century has been considerable in these countries. However, stagnation in different dimensions suggests large structural vulnerabilities. Economic growth is slowing down, poverty reduction has stagnated, citizens’ rising demands remain unmet and the sustainability of the economic model is questionable owing to its environmental impact.
In addition, new development challenges add to the persistent weaknesses. These challenges have sometimes emerged precisely as a result of progress or owing to changing global conditions. This is why the region is facing mainly four structural development traps that demand new, more complex policy responses. These are the productivity trap, the vulnerability trap, the institutional trap and the environmental trap.
This is a context where the DiT approach gains importance for Latin America as a way to respond to these new development challenges and turn these vicious circles into virtuous ones. In particular, the DiT approach calls for a rethinking of the development model to achieve lasting and shared prosperity. It also advocates new approaches to international relations that support domestic development strategies (see Chapter 4 Chapter 5).
References
Azariadis, C. and J. Stachurski (2005), “Poverty traps”, in Handbook of Economic Growth, Aghion, P. and S. Durlauf (eds.), Elsevier, Amsterdam.
Bosch, M., Á. Melguizo and C. Pagés (2013), Better Pensions, Better Jobs: Towards Universal Coverage in Latin America and the Caribbean, Inter-American Development Bank, Washington, DC.
Busso, M., M.V. Fazio and A. Levy (2012), (In)Formal and (Un)Productive: The Productivity Costs of Excessive Informality in Mexico, Inter-American Development Bank, Washington, DC.
Busso M., L. Madrigal and C. Pagés (2013), “Productivity and resource misallocation in Latin America”, B.E. Journal of Macroeconomics, Vol. 13/1, June, De Gruyter, Berlin, Boston, pp. 1-30.
CAF (2018), Informe RED 2018, “Instituciones para la productividad: hacia un mejor entorno empresarial”, Development Bank of Latin America, Caracas, http://scioteca.caf.com/handle/123456789/1343 (accessed December 2018).
CAF (2017), “Informe RED 2017, Crecimiento urbano y acceso a oportunidades: un desafío para América Latina”, Development Bank of Latin America, Bogotá, http://scioteca.caf.com/handle/123456789/1090.
CEDLAS and the World Bank (2018), LAC Equity Lab tabulations based on SEDLAC.
Conference Board (2018), Total Economy (database), www.conference-board.org/data/economydatabase/ (accessed August 2018).
Daude, C., et al. (2017), “On the middle 70%: The impact of fiscal policy on the emerging middle class in Latin America using commitment to equity”, Working Papers, No. 1 716, Department of Economics, Tulane University, New Orleans.
Dini, M. and G. Stumpo (co-ords.) (2018), “Mipymes en América Latina: un frágil desempeño y nuevos desafíos para las políticas de fomento”, Documentos de Proyectos (LC/TS.2018/75), Economic Commission for Latin America and the Caribbean, Santiago.
ECLAC (2018), The Inefficiency of Inequality, Economic Commission for Latin America and the Caribbean, Santiago.
ECLAC (2017), Economic Survey of Latin America and the Caribbean 2017, Economic Commission for Latin America and the Caribbean, Santiago.
ECLAC (2015), The Economics of Climate Change in Latin America and the Caribbean: Paradoxes and Challenges of Sustainable Development, Economic Commission for Latin America and the Caribbean, Santiago.
Gill, I. and H. Kharas (2007), An East Asian Renaissance, World Bank, Washington, DC.
Hirschman, A. (1958), The Strategy of Economic Development, Yale University Press, New Haven.
IDB (2015), “Empleos para crecer”, Inter-American Development Bank, Washington, DC, www.iadb.org/es/empleosparacrecer
Kharas, H. and H. Kohli (2011), “What is the middle income trap, why do countries fall into it, and how can it be avoided?”, Global Journal of Emerging Market Economies, Vol. 3/3, Emerging Markets Institute, Beijing, pp. 281-289.
Latinobarometro (2015), http://www.latinobarometro.org/latNewsShow.jsp.
Magrin, G.O. et al. (2014), “Central and South America,” Climate Change 2014: Impacts, Adaptation, and Vulnerability. Part B: Regional Aspects. Contribution of Working Group II to the Fifth Assessment Report of the Intergovernmental Panel of Climate Change, V.R. Barros et al. (eds.), Cambridge University Press, United Kingdom and New York, pp. 1499-1566.
McMillan, M. and D. Rodrik (2011), “Globalization, structural change and productivity growth”, Working Paper, No. 17143, National Bureau of Economic Research, June 2011, www.nber.org/papers/w17143.
Melguizo, A., S. Nieto-Parra, J.R. Perea and J.A. Perez (2017), “No sympathy for the devil! Policy priorities to overcome the middle-income trap in Latin America”, Working Paper, No. 340, OECD Development Centre, Paris.
Melitz M.J. (2003), “The Impact of Trade on Intra-Industry Reallocations and Aggregate Industry Productivity”, Econometrica, Volume 71, Issue 6, pp. 1695-1725, November 2003.
Myrdal, G. (1957), Economic Theory and Underdeveloped Regions, Duckworth, London.
OECD (2018a), Integrity for Good Governance in Latin America and the Caribbean: From Commitments to Action, OECD Publishing, Paris, https://doi.org/10.1787/9789264201866-en.
OECD (2018b), Biodiversity conservation and sustainable use in Latin America: Evidence from Environmental Performance Reviews, OECD Environmental Performance Reviews, OECD Publishing, Paris, https://doi.org/10.1787/9789264309630-en.
OECD (2018c), OECD.Stat (database), accessed January 2019, https://stats.oecd.org/Index.aspx?DataSetCode=EXP_MORSC
OECD (2018d), The Productivity-Inclusiveness Nexus, OECD Publishing, Paris, https://doi.org/10.1787/9789264292932-en.
OECD (2017), Enhancing Social Inclusion in Latin America: Key Issues and the Role of Social Protection Systems, OECD Publishing, Paris, http://www.oecd.org/latin-america/regionalprogramme/Enhancing-Social-Inclusion-LAC.pdf.
OECD (2010), Latin American Economic Outlook 2011: How Middle-Class is Latin America?, OECD Publishing, Paris, http://dx.doi.org/10.1787/leo-2011-en.
OECD/CAF/ECLAC (2018), Latin American Economic Outlook 2018: Rethinking Institutions for Development, OECD Publishing, Paris, https://doi.org/10.1787/leo-2018-en.
OECD/CAF/ECLAC (2016), Latin American Economic Outlook 2017: Youth, Skills and Entrepreneurship, OECD Publishing, Paris, https://doi.org/10.1787/leo-2017-en.
OECD/CAF/ECLAC (2015), Latin American Economic Outlook 2016: Towards a New Partnership with China, OECD Publishing, Paris, https://doi.org/10.1787/9789264246218-en.
OECD/ECLAC (2011), Latin American Economic Outlook 2013: SME Policies for Structural Change, OECD Publishing, Paris, https://doi.org/10.1787/leo-2013-en.
OECD/ECLAC/CIAT/IDB (2018), Revenue Statistics in Latin America and the Caribbean, OECD Publishing, Paris, https://doi.org/10.1787/rev_lat_car-2018-en-fr.
OECD/IEA/NEA/ITF (2015), Aligning Policies for a Low-carbon Economy, OECD Publishing, Paris, http://dx.doi.org/10.1787/9789264233294-en.
OECD/World Bank/UN Environment Programme (2018), Financing Climate Futures: Rethinking Infrastructure, OECD Publishing, Paris, https://doi.org/10.1787/9789264308114-en.
Pérez Caldentey, E. and M. Vernengo (eds.) (2017), Why Latin American Nations Fail: Development Strategies in the Twenty-First Century, University of California Press, Oakland, California.
Puebla, D. (2018), Análisis de las empresas ecuatorianas y comercio exterior con un enfoque de tamaño, Economic Commission for Latin America and the Caribbean, Santiago.
Ray, D. (2007), “Introduction to development theory”, Journal of Economic Theory, Vol. 137/1, Elsevier, Amsterdam, pp. 1-10.
Stumpo, G. and F. Correa Mautz (2017), Brechas de productividad y cambio estructural. Políticas industriales y tecnológicas en América Latina [Productivity Gaps and Structural Change. Industrial and Technological Policies in Latin America], Economic Commission for Latin America and the Caribbean, Santiago.
Timmer, M., G.J. de Vries and K. de Vries (2015), “Patterns of structural change in developing countries”, in Routledge Handbook of Industry and Development, Routledge, Abingdon.
UNDP (2016), Progreso multidimensional: bienestar más allá del ingreso, Informe Regional sobre Desarrollo Humano para América Latina y el Caribe, Programa de las Naciones Unidas para el Desarrollo, http://hdr.undp.org/sites/default/files/50228-undplac-web.pdf.
United Nations (2015), Transforming Our World: The 2030 Agenda for Sustainable Development, https://sustainabledevelopment.un.org/content/documents/21252030%20Agenda%20for%20Sustainable%20Development%20web.pdf.
Vergara, W., J.V. Fenhann and M.C. Schletz (2014), Zero Carbon Latin America: A Pathway for Net Decarbonization of the Regional Economy by mid-Century, UN Environment–DTO Partnership, Copenhagen.
World Bank (2018), World Bank World Development Indicators (database), http://data.worldbank.org/ (accessed 1 May 2018).
World Resources Institute (2017), CAIT Climate Data Explorer (database), http://cait.wri.org (accessed November 2018).
Notes
← 1. Middle-income countries in the region comprise a heterogeneous group in terms of size, development and economic potential. The average per capita GDP level over the period 2007-16 ranges from a minimum of 4 130 dollars to a maximum of 18 722 dollars. In upper middle-income countries the GINI index varies between 42.4 and 58.4 while poverty rate oscillate between 0% and 40.6%.
← 2. This is an accounting identity Y/N = L/N * E/N * H/E * Y/H, where Y is GDP, N is total population, L is the labour force, E is the total number of employed workers and H is the total hours worked in the economy. Each one of those four ratios on the right-hand side of this expression correspond to the four components listed above: participation rate, employment rate, hours per worker and output per hour. It is worth noting that L/N is not the standard participation rate because N includes the whole population, not only those of working age.
← 3. This decomposition is based on a Cobb-Douglas production function of the form  , where Y is GDP, A denotes TFP, K is the capital stock, L is total hours worked, and h represents units of human capital of a typical worker. From this equation, one can obtain
  Thus, output per hour is made up of three components: capital intensity
  , human capital per worker h, and TFP
  We calculate these components with data from the Penn World Tables 9.0 assuming
  = 1/3. It is worth pointing out that we calculate our own measure of TFP by using the equations above. The Penn World Tables, however, include a measure of TFP based on a different methodology. For a similar decomposition, see Jones (2015).
← 4. For the case of manufacturing (which is a 1-digit sector according to the ISIC, revision 3.1), a sub-sector is defined as a 4-digit activity that distinguishes, for instance, between processing fish or fruits as well as manufacturing engines or pumps. In total, there are 55 sub-sectors. This analysis uses survey data for Chile, Colombia and Mexico during the period 2003-07. This period is the only common years for which we have data for the three countries. Also, the data exclude establishments with fewer than ten employees.
← 5. Busso, Madrigal and Pagés (2013, BMP hereafter) apply Hsieh and Klenow’s (2009) methodology for ten Latin American economies and find much larger gains from efficiently reallocating capital and labour within each sub-sector. They find that output increases between 45% and 127% whereas CAF (2018) finds that output increases by about 20% (output per worker in the whole manufacturing sector goes from 0.34 to 0.41). There are a number of reasons that explain this seemingly large discrepancy. First, when one restricts the analysis to establishments with ten or more workers, the gains in BMP are around 50-60%. Second, and perhaps more importantly, the two counterfactual exercises are different. BMP consider a reallocation of both capital and labour whereas CAF only reallocates labour. In addition, BMP’s exercise completely eliminates misallocation within each sub-sector. In contrast, CAF asks what the gains would be if the level of allocative efficiency within each sub-sector is the same as the observed in the US, which is not fully efficient.
← 6. For the case of services, the analysis is based on social security administrative data from Uruguay, and firm-level survey data from Colombia during the period 2008-12. The findings are consistent with those of Busso, Madrigal and Pagés (2013).
