Despite positive labour market trends over the past decades, the ongoing COVID-19 pandemic crisis poses new and unexpected challenges to labour markets in Canada, with some places likely to be hit harder than others. The pandemic could also accelerate automation in the workplace, as firms seek to replace the production of goods and services with machines. This chapter highlights the potential threats and opportunities posed by automation with a special focus on regions within the Province of Ontario, Canada’s largest economy and most populous province. It highlights places that have the highest risk of being impacted by automation as well as which types of jobs are most at risk.
Preparing for the Future of Work in Canada

2. The local impacts of automation in Canada
Abstract
In Brief
The ongoing COVID-19 pandemic crisis is causing widespread disruption in Canadian labour markets, leading to a new spike in unemployment. Following a drop of over 1 million in March 2020, employment fell by about 2 million in April 2020, bringing the total employment decline since the beginning of the COVID-19 economic shutdown to over 3 million. The magnitude of the decline in employment between February and April (-15.7%) far exceeds declines observed in previous labour market downturns. As some provinces gradually lift restrictions, employment has started to rebound in May 2020, with the creation of 290 000 jobs. The unemployment rate has also declined in some provinces, but continued to increase in Canada overall to 13.7%, the highest rate since comparable data became available in 1976. Before COVID-19, Canada had enjoyed a low unemployment rate. Unemployment sat at 5.7% in 2019 – the lowest point in more than 40 years.
The COVID-19 crisis could accelerate automation in the workplace. There is a wide body of evidence which shows that firms are more likely to invest in automation following economic crisis periods.
Automation could re-shape labour markets in Canada. OECD estimates show that a number of jobs are at high risk of automation in Canada (15.0% of total employment in 2018) but many more are likely to face significant change (30.6%). Canadian provinces face a similar risk of automation, but disparities within provinces are significant. For example, looking at economic regions, there are almost 15 percentage points of difference between the economic regions with the highest and lowest share of jobs at risk of automation within British Columbia, while in Ontario, the difference is 8.3 percentage points.
Some factors affect local labour market vulnerability to automation. In Ontario, the share of jobs at risk of automation varies from a low of 41.1% in Ottawa to a high of 49.4% in Stratford-Bruce Peninsula. Ontario regions facing a higher risk of automation are characterised by a lower share of working age population, a higher prevalence of rural areas, poorer employment and skills levels, and higher employment shares in good-producing sectors.
Many places are making the transition. The good news is that 23 out of 65 economic regions in Canada, accounting for about 60% of the overall Canadian labour force, created jobs predominantly in less risky occupations between 2011 and 2018. New jobs are going to be created, providing new sources of growth if places are ready to seize the opportunity. The future of work can also provide more flexible working opportunities for both people and firms.
Introduction
Megatrends related to digitalisation, automation and artificial intelligence (AI) are having a profound impact on local labour markets across the OECD. Some people and places are more at risk than others. The ongoing COVID-19 pandemic crisis is posing unprecedented challenges to local labour markets across Canada, and risks accelerating automation going forward. This chapter is structured as follows. Section 2.1 provides an overview of regional labour market trends across Canada. Sections 2.2 and 2.3 analyse the impact of automation on local labour markets in Canada with a special focus on the Province of Ontario. Section 2.4 shows trends in the rise of non-standard work, which provides both challenges and opportunities for individuals.
2.1. The ongoing COVID-19 crisis is posing unprecedented challenges to Canadian labour markets, which had performed well before the outbreak
2.1.1. The COVID-19 outbreak is disrupting labour markets in Canada
While necessary for public health reasons, the COVID-19 confinement and social distancing measures have put unprecedented pressure on local labour markets in Canada. As of May 2020, many provinces have gradually eased restrictions and re-opened the economy. However, the longer-term impacts will depend on the length of lockdowns, the scale of indirect impacts such as drops in consumer spending, and the effectiveness of the policy responses. The employment impacts of COVID-19 have exceeded initial estimates, dwarfing those of the 2008 financial crisis and any other recession in recent memory.
As a result of COVID-19, Canada has experienced a historical job loss between February and April 2020. Following a drop of over 1 million in March, employment fell by about 2 million in April, bringing the total employment decline since the beginning of the COVID-19 economic shutdown to over 3 million. The magnitude of the decline in employment between February and April (-15.7%) far exceeds declines observed in previous labour market downturns. Compared with February, employment in April declined by more than 10% in all provinces, led by Quebec (-18.7% or -821 000). The unemployment rate rose 5.2 percentage points in April to 13.0%, and it increased in all provinces. This followed an increase of 2.2 percentage points in March. Total unemployment grew by 1 285 000 (+113.3%) from February to April 2020. By comparison, during the 1981-1982 recession unemployment rose by 763 000 (+88.6%) over the course of 16 months. In April, almost all (97.0%) of the newly-unemployed were on temporary layoff (not seasonally adjusted), indicating that they expected to return to their former employer as the shutdown is relaxed (Statistics Canada, 2020[1]) (Statistics Canada, 2020[2]).
Employment has started to rebound in May 2020, but there is uncertainty on how the economic recovery will unfold. In May, employment rose by 290 000 (+1.8%), while the number of people who worked less than half their usual hours dropped by 292 000 (-8.6%). Combined, these changes in the labour market represented a recovery of 10.6% of the COVID-19-related employment losses and absences recorded in the previous two months. The unemployment rate started to decline in some provinces, but increased in Canada overall, standing at 13.7% in May 2020, the highest recorded since comparable data became available in 1976. The gradual easing of COVID-19 restrictions and the re-opening of the economy presents both opportunities and challenges for employers and workers. For employers, this includes adapting workplaces while adjusting to disruptions in global supply chains and uncertainties in consumer demand. For workers, the challenges vary, from returning to a previous employer, to looking for a new job, adapting to new ways of working, or making child care arrangements (Statistics Canada, 2020[3]).
Figure 2.1. Unemployment has increased across all provinces in Canada due to COVID-19

Source: Statistics Canada. Table 14-10-0287-01 Labour force characteristics, monthly, seasonally adjusted and trend-cycle, last 5 months. DOI: https://doi.org/10.25318/1410028701-eng.
2.1.2. The impacts of the pandemic outbreak could be geographically concentrated
The economic consequences of COVID-19 are likely to affect local economies throughout Canada differently, with tourist destinations and large cities suffering the most in the short-term. Regions have different sectoral specialisations, exposure to global value chains, focus on tradable vs. non-tradable sectors, and shares of non-standard employment. Recent OECD work shows that sectors most at risk during the confinement period include manufacturing of transport equipment; construction; wholesale and retail trade; air transport, accommodation and food services; real estate services; professional service activities; and arts, entertainment and recreation (OECD, 2020[4]).
Some sectors have experienced larger employment losses than others. In March, almost all employment losses were observed in the services-producing sector. In April, by contrast, employment losses were proportionally larger in goods (-15.8%; -621 000) than in services (-9.6%; -1.4 million). Losses in the goods-producing sector were led by construction (-314 000; -21.1%) and manufacturing (-267 000; -15.7%). Within the services sector, employment losses continued in several industries, led by wholesale and retail trade (-375 000; -14.0%) and accommodation and food services (-321 000; -34.3%). Industries which continued to be relatively less affected by the COVID-19 economic shutdown included utilities; public administration; and finance, insurance and real estate (Statistics Canada, 2020[2]). In May, employment rebounded more strongly in the goods-producing sector (+5.0% or +165 000) than in the services-producing sector (+1.0% or +125 000) (Statistics Canada, 2020[3]).
2.1.3. Before COVID-19, the unemployment rate stood at a record low in Canada, but this masked regional labour market variations
Before the COVID-19 outbreak, Canada’s labour market had performed well, with economic growth underpinning strong employment growth over recent years. The unemployment rate has been decreasing over the last decades, hitting a 40-year low of 5.7% in 2019, which was slightly above the OECD average of 5.2%.
Despite historical low unemployment rates at the federal level, labour markets in Canada witnessed strong provincial variation. Unemployment rates ranged from 11.9% in Newfoundland and Labrador to 4.7% in British Columbia in 2019, with Ontario and Quebec standing around the OECD average (see Figure 2.2). The relatively weaker performance of Newfoundland and Labrador is linked to the province’s ageing population and emigration of high-skilled workers, as well as to spikes in employment linked to large construction projects (Moore, 2018[5]). In addition, the province enjoys a rich endowment of natural resources, with offshore oil and mining accounting for nearly a quarter of GDP. This level of concentration in natural resource sectors means that the local economy is highly exposed to fluctuations in global commodity prices (McKinsey & Company, 2019[6]).
To better understand the duration of labour market shocks, it is useful to analyse unemployment performance between 2008 (just before the financial crisis) and 2019. This can provide some indication about the time needed for recovery after a labour market shock. In 2019, the unemployment rate was still higher compared to 2008 in Alberta (+3.3 percentage points), Saskatchewan (+1.4), Manitoba (+1.1) and British Columbia (+0.1), showing that some provinces indeed did not fully recover in terms of unemployment from the 2008 financial crisis.
Regional employment disparities are also present when looking at economic regions across Canada (see Box 2.1 for more information on the definition of an economic region). Within four provinces in Canada (British Columbia, Nova Scotia, New Brunswick and Ontario), trends in regional employment have gone in opposite directions over the last decade, with some regions having recovered to their 2008 level while others still struggle with higher unemployment (see Figure 2.3). All economic regions in Newfoundland and Labrador and Quebec had lower unemployment rates in 2019 than in 2008. Looking at Ontario, the unemployment rate in 2019 was slightly higher than in 2008 only in Muskoka-Kawarthas and Northeast, while in all other economic regions it had decreased (see Figure 2.4). On the other hand, in Manitoba, Saskatchewan and Alberta, unemployment rates were higher in 2019 across all economic regions compared to 2008, largely reflecting difficulties in the oil sector and consequent negative impacts across the economy.
Figure 2.2. Unemployment varied substantially across provinces in Canada

Note: The unemployment rate is the number of unemployed persons expressed as a percentage of the labour force. Estimates are percentages, rounded to the nearest tenth. The figure excludes the territories.
Source: Statistics Canada. Table 14-10-0090-01 Labour force characteristics by province, territory and economic region, annual, https://doi.org/10.25318/1410009001-eng.
Figure 2.3. Almost half of Canadian regions had not recovered to 2008 unemployment levels before the COVID-19 outbreak

Note: The number in each column denotes the number of economic regions facing lower/higher unemployment rates in 2019 compared to 2008 within each province.
Source: OECD calculations on Statistics Canada.
Figure 2.4. Unemployment in Ontario had decreased in most regions between 2008 and 2019

Note: Economic regions are ranked in descending order of 2019 unemployment rates.
Source: Statistics Canada. Table 14-10-0090-01 Labour force characteristics by province, territory and economic region, annual. DOI: https://doi.org/10.25318/1410009001-eng.
Box 2.1. What do we mean by “economic region”?
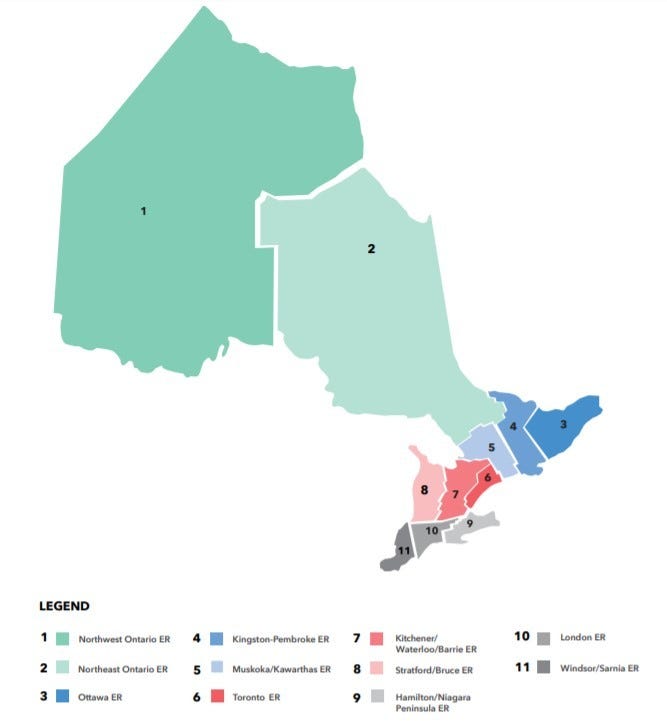
An economic region (ER) is a grouping of complete census divisions (with one exception in Ontario) created as a standard geographic unit for analysis of regional economic activity. According to the 2016 Canadian Census data, there are a total of 76 economic regions across Canada. However, some areas are too small to enable production of independent estimates and are grouped with a neighbouring region with similar economic characteristics, to obtain a total of 65 economic regions. Within the province of Quebec, economic regions (régions administratives) are designated by law. In all other provinces and territories, economic regions are created by agreement between Statistics Canada and the province/territory concerned. In Ontario, there is one exception where the economic region boundary does not respect census division boundaries: the census division of Halton is split between the ER of Hamilton--Niagara Peninsula and the ER of Toronto. Figure 2.5 presents a map of Ontario’s 11 economic regions.
Figure 2.5. Ontario economic regions
Source: Statistics Canada (2019[7]), Table 1.1 Geographic areas by province and territory, 2016 Census, https://www12.statcan.gc.ca/census-recensement/2016/ref/dict/tab/t1_1-eng.cfm (accessed on 7 May 2020); Ontario Chamber of Commerce (2019[8]), The Great Mosaic: Reviving Ontario’s Regional Economies, https://occ.ca/wp-content/uploads/The-Great-Mosaic-Reviving-Ontarios-Regional-Economies.pdf (accessed on 10 March 2020); Statistics Canada (2018[9]), Economic region (ER), https://www150.statcan.gc.ca/n1/pub/92-195-x/2011001/geo/er-re/er-re-eng.htm (accessed on 10 July 2019); Statistics Canada (2016[10]), Economic Regions -Variant of SGC 2016 -Introduction -Definitions, http://www23.statcan.gc.ca/imdb/p3VD.pl?Function=getCET_Page&VD=318020&Item=318531 (accessed on 10 July 2019).
2.1.4. Job creation has been concentrated in some regions and within the services sector between 2008 and 2019
Disparities in local labour market outcomes are reflected in job creation trends across Canada. At the federal level, Ontario, Quebec, British Columbia and Alberta, which are Canada’s most populous provinces, have led job creation over the past decade, adding 842 300, 457 200, 317 100 and 289 100 jobs to the economy respectively between 2008 and 2019. Most Canadian provinces, including less populated ones, have experienced employment growth over the past decade, with the only exception of New Brunswick. Provincial employment growth has lagged behind population growth in most provinces (see Figure 2.6).
Job creation has been particularly uneven within provinces, with a concentration in urban regions. For example, in Ontario, employment has grown by 20.8% in the economic region of Toronto over the 2008-19 period, followed by Kitchener-Waterloo-Barrie at 15.2% (see Figure 2.7). Toronto recently led all of North America (including Canada, the United States, and Mexico) in tech job creation and is now home to 240 000 tech workers (InvestinOntario, 2019[11]). On the other hand, negative growth occurred in the Northeast, Muskoka-Kawarthas, Windsor-Sarnia and Kingston-Pembroke regions. A similar picture emerges when looking at other provinces. For example, in British Columbia, Lower Mainland-Southwest experienced strong job growth between 2008-19, amounting to 21.8%, while some economic regions, such as North Coast and Nechako and Cariboo have lost jobs (-4.5% and -3.2% respectively). In Quebec, most regions have created jobs over the last decade but some have experienced decline, including Bas-Saint-Laurent (-2.6%) and Gaspésie-Îles-de-la-Madeleine (-6.4%).
Figure 2.6. Most provinces have created jobs over the last decade, although population has grown faster in most of them

Note: Data does not include the territories.
Source: Statistics Canada. Table 14-10-0312-01 Employment by economic regions and occupation, annual (x 1,000). DOI: https://doi.org/10.25318/1410031201-eng; and Statistics Canada. Table 17-10-0005-01 Population estimates on July 1st, by age and sex. DOI: https://doi.org/10.25318/1710000501-eng.
Figure 2.7. Toronto has been an engine of job growth in Ontario

Source: Statistics Canada. Table 14-10-0312-01 Employment by economic regions and occupation, annual (x 1 000). DOI: https://doi.org/10.25318/1410031201-eng.
Trends in job creation have gone hand in hand with changing patterns in sectoral employment in Canada, which mirror OECD trends. Jobs in the services sector have expanded, while goods-producing jobs, such as manufacturing and agriculture, have shrunk both in Canada and across the OECD over the past decades. The services sector accounts for 79.2% of Canadian employment in 2019, compared to 20.8% for goods-producing sectors, which includes manufacturing, construction, agriculture, forestry, fishing and mining, and utilities. Manufacturing alone accounted for 9.1% of total employment in 2019. In addition, over the last decade, the Canadian labour market has experienced a considerable shift away from manufacturing towards services such as professional, scientific and technical services and health care and social assistance (see Figure 2.8). The drop in manufacturing employment has been widespread across regions in Canada, with about 80% of regions having experienced a drop in manufacturing employment. Similarly, agriculture employment has declined, with almost 70% of economic regions across Canada witnessing decreased shares of agriculture employment over the last decade.
The sectoral composition of employment remains diverse across Canada. Looking at Ontario, employment has grown in recent years in the health care and social assistance sectors, driven by the ageing of Ontario’s population, and in technology, the fastest growing industrial sector in Canada in 2018 (Fields, Bourbeau and Patterson, 2018[12]) (Patterson, Hazel and Saunders, 2019[13]). Although services are the main source of employment across all Ontario regions, manufacturing remains a relevant employer, especially in Windsor-Sarnia, where it accounts for 18.4% of total employment, followed by London (15.5%) and Kitchener-Waterloo-Barrie (14.5%) in 2019 (see Figure 2.9).
Figure 2.8. Services employment has grown in Canada over the last decade, while agriculture and manufacturing have shrunk

Note: Data does not include the territories.
Source: Statistics Canada. Table 14-10-0023-01 Labour force characteristics by industry, annual (x 1,000). DOI: https://doi.org/10.25318/1410002301-eng.
Figure 2.9. Manufacturing remains an important source of employment across Ontario regions

Source: Statistics Canada. Table 14-10-0092-01 Employment by industry, annual, provinces and economic regions (x 1 000). DOI: https://doi.org/10.25318/1410009201-eng.
2.2. Automation could re-shape labour markets across Canada
2.2.1. Fewer jobs are at risk of automation in Canada than on average across the OECD, but many jobs risk disappearing or changing significantly
Automation offers the opportunity to boost productivity, increasing prosperity and raising living standards. Automation can however also create losers, as workers who lose jobs to automation may not always have the skills needed in a changing labour market and might struggle to find new jobs. Automation can also put downward pressure on wages and lead to a polarisation of the skills required in the labour market, potentially exacerbating inequalities (OECD, 2018[14]). The labour share, defined as the share of total federal income that is paid in wages, has been decreasing over recent decades. While there are different potential explanations, the decline in the labour share was at least partially due to greater automation. In addition, the expanding use of robots is also associated with a reduction in wages and in the employment rate (Acemoglu and Restrepo, 2016[15]).
The spread of robots particularly affects sectors with a high concentration of occupations entailing routine tasks, which are easier to automate (Dao et al., 2017[16]) (Autor and Salomons, 2018[17]). These include middle-skill/middle-wage jobs, such as manufacturing and clerical jobs, that typically entail routine and repetitive tasks. While at the beginning of the century 100 000 industrial robots were delivered each year across the world, by 2016 the number of new industrial robots reached 300 000 annually (OECD, 2018[18]). In Canada, robot sales surged by 72% to 4 003 units in 2017, the highest level ever reached. The number of industrial robots per 10 000 employees in the manufacturing industry amounted to 161 in 2017, above both the world (85) and American average (91). Canada’s robot density increased to 1 354 units per 10 000 employees in the automotive industry, attaining the highest level in the world for this sector (International Federation of Robotics, 2018[19]).
While only one in seven jobs may be lost to automation, many more could experience significant change in Canada. The OECD has developed a methodology to calculate the probability of losing jobs to automation, building on the model elaborated by Frey and Osborne (Frey and Osborne, 2013[20]) (see Box 2.2). Previous OECD research suggested that 14% of total jobs across the OECD faced a high risk of automation in 2013, while 32% may experience significant change to how they are carried out, with Canada experiencing lower automation risk than the OECD average (see Figure 2.10). Estimates developed for this report, looking at total employment data in 2018, show that 15.0% of jobs are at high risk of automation in Canada, while 30.6% are at significant risk.
The ongoing COVID-19 pandemic crisis is likely to accelerate the speed of automation in the workplace. Automation has historically taken place in bursts, concentrated especially in bad times such as in the wake of economic shocks, when human labour become relatively more expensive as firms’ revenues rapidly decline. In these periods, employers are more likely to shed less-skilled workers and replace them with technology and higher-skilled workers, increasing labour productivity in the face of recessions (Muro, Maxim and Whiton, 2020[21]). Acceleration in the adoption of automation poses a dual challenge for Canada. On the one hand, it will be important for Canadian companies to adopt technology during and after the pandemic. This will help companies to solve some immediate challenges, and enjoy the productivity benefits of technology investments during and after the pandemic. On the other hand, accelerated automation can mean that certain workers may see longer-term dislocation from the labour market (Lamb, 2020[22]).
Figure 2.10. Jobs at risk of automation across OECD countries

Note: ‘High risk of automation’ refers to the share of workers featuring a risk of automation of 70% or above. ‘Significant risk’ reflects the share of workers with a risk of automation between 50% and 70%.
Source: Nedelkoska, L. and G. Quintini (2018[23]), “Automation, skills use and training”, OECD Social, Employment and Migration Working Papers, No. 202, OECD Publishing, Paris, https://dx.doi.org/10.1787/2e2f4eea-en.
Box 2.2. Estimating the risk of automation across OECD countries
Frey and Osborne (FO) estimated the number of occupations at high risk of automation in the United States using a two-step methodology. They conducted a workshop with a group of experts in machine learning, whom they provided with a list of 70 occupations and their corresponding O*NET1 task descriptions. Experts were asked “Can the tasks of this job be sufficiently specified, conditional on the availability of big data, to be performed by state of the art computer-controlled equipment?”. This allowed for the coding of each occupation as automatable or non-automatable. FO then used a machine learning algorithm to find out more about the links between the coding to automate and the list of O*NET variables. They were able to identify those variables (and their associated bottlenecks) with higher prediction power. High scores on these bottlenecks are likely to mean that an occupation is safe from automation. They could then compute a “probability of computerisation” for each occupation in the US, leading to the aggregate estimate that 47% of US jobs have a probability of automation of more than 70%.
Table 2.1. Automation bottlenecks
|
Computerisation bottleneck |
O*NET variable |
|---|---|
|
Perception and Manipulation |
Finger dexterity Manual dexterity Cramped workspace; awkward positions |
|
Creative intelligence |
Originality Fine arts |
|
Social intelligence |
Social perceptiveness Negotiation Persuasion Assisting and caring for others |
Note: Please refer to (Frey and Osborne, 2013[20]) for further details on the definition of automation bottlenecks.
Source: Frey, C. and M. Osborne (2013[20]), The Future of Employment: How Susceptible are Jobs to Computerisation?, University of Oxford, https://www.oxfordmartin.ox.ac.uk/downloads/academic/The_Future_of_Employment.pdf (accessed on 10 July 2019).
Building on this approach, (Nedelkoska and Quintini, 2018[23]) (NQ) calculated the risk of automation across 32 OECD countries. The approach is based on individual-level data from the OECD Survey of Adult Skills (PIAAC), providing information on the skills composition of each person’s job and their skillset. While drawing on FO, this methodology presents four main differences: (i) training data in the NQ model is taken from Canada to exploit the country’s large sample in PIAAC; (ii) O*NET occupational data for FO’s 70 original occupations were manually recoded into the International Standard Classification of Occupations (ISCO); (iii) NQ uses a logistic regression compared to FO’s Gaussian process classifier; (iv) NQ found equivalents in PIAAC to match FO’s bottlenecks. PIAAC includes variables addressing the bottlenecks identified by FO, but no perfect match exists for each variable. No question in PIAAC could be identified to account for job elements related to “assisting and caring for others”, related to occupations in health and social services. This implies that risks of automation based on NQ could be slightly overestimated.
Table 2.2. Automation bottleneck correspondence
|
FO computerisation bottleneck |
PIAAC variable |
|---|---|
|
Perception and manipulation |
Finger dexterity |
|
Creative intelligence |
Problem solving (simple) Problem solving (complex) |
|
Social intelligence |
Teaching Advising Planning for others Communication Negotiation Influence Sales |
Note: Please refer to (Nedelkoska and Quintini, 2018[23]) for further details on the definition of the PIAAC variables.
Source: OECD (2018[18]), Job Creation and Local Economic Development 2018: Preparing for the Future of Work, OECD Publishing, Paris, https://dx.doi.org/10.1787/9789264305342-en; Nedelkoska, L. and G. Quintini (2018[23]), “Automation, skills use and training”, OECD Social, Employment and Migration Working Papers, No. 202, OECD Publishing, Paris, https://dx.doi.org/10.1787/2e2f4eea-en.
Recent studies have pointed out the difficulty in predicting the risk of automation, as different models and variables come into play. Frey and Osborne’s original examination of the impact of automation on jobs was focused on machine learning and mobile robotics, but these are not the only key technological developments likely to impact the future of skills. Others have identified the rise of various forms of telepresence and virtual/augmented/mixed forms of reality, as well as the expansion of digital platforms as trends that will have important impacts on the future. The inherent unpredictability of technological progress means that within the growing literature, estimates of the jobs at risk of automation can vary widely, and the timeframes within which these impacts are predicted to occur are similarly broad, ranging from 10 to 50 years. Both the shape disruption will take, and its extent, are uncertain. What is certain is that workers will need to learn new skills and develop new competencies to adapt to changes are on their way (Crawford Urban and Johal, 2020[24]).
2.2.2. Regional differences in the risk of automation exist within Canadian provinces
Automatable tasks are more prevalent in certain occupations and sectors, and neither occupations nor sectors are evenly distributed within Canada. Across Canada, provinces face a similar risk of losing jobs to automation (see Figure 2.11), compared to other OECD countries where the gap between the region at highest and lowest risks can be substantial (e.g. 12 percentage points in Spain). Similar automation risks across Canadian provinces reflect similar job creation trends and sectoral employment structures across provinces (OECD, 2018[18]). In the 2011-16 period, the share of jobs at high risk of automation in nine out of ten Canadian provinces fell, due to the creation of jobs in less risky occupations and loss of jobs in riskier occupations. Since 2011, Quebec, Ontario, Manitoba, Saskatchewan, Alberta and British Columbia have created jobs mostly in occupations presenting a lesser risk of automation, although this may entail greater job market polarisation. In Alberta, employment grew in the health sector, education, and business administration, which are at lower risks of automation. Meanwhile, in Prince Edward Island, Nova Scotia and New Brunswick, jobs have disappeared in occupations at higher risk of automation such as food processing, woodworking and garment workers. Standing out among provinces, Newfound and Labrador’s economy has created jobs mostly in occupations at a higher risk of automation (OECD, 2018[18]).
However, the provincial picture does not capture substantial differences that exist within provinces (see Figure 2.12). For example, there are almost 15 percentage points of difference between regions facing the highest risk and lowest risk within British Columbia (Northeast with 59%, and Vancouver Island and Coast with 45.2% of jobs at risk of automation respectively). Northeast is a vast area of mountains, forests and lakes. The region’s economy is based on natural resources, particularly mining and oil and gas activities. Other important industries in the region include forestry, agriculture and utilities (Government of British Columbia, n.d.[25]). Disparities in terms of risk of automation are also pronounced in Ontario, Quebec and Alberta. This could be partly explained by the coexistence of regions around large metropolitan areas in all provinces, typically drivers of high-skill jobs, and regions where manufacturing and agriculture are a large source of employment. Annex 2.A provides estimates of the risk of automation for economic regions within all Canadian provinces.
Figure 2.11. Canadian provinces face a similar risk of losing jobs to automation

Source: OECD calculations on Labour Force Surveys.
Figure 2.12. Some provinces have wide regional disparities in terms of risk of automation

Note: The number of economic regions in each province is included in parenthesis.
Source: OECD calculations on Labour Force Surveys.
Box 2.3. How are the provincial and regional risks of automation calculated?
In order to produce provincial and regional estimates on the risk of automation, the results of Nedelkoska and Quintini (2018[23]) are applied at the provincial and regional scale in Canada. For each province and economic region, the share of jobs at risk of automation is calculated using data on provincial and regional employment by occupation and the estimated probabilities of automation from (Nedelkoska and Quintini, 2018[23]). As an approximation, the method assumes that jobs within the same job category have the same risk of automation across all provinces and regions of Canada.
Importantly, the methodology to estimate the risk of automation in an occupation can account for differences in the risk across countries but it cannot show how the risk of automation within an occupation changes over time. This introduces an important caveat. Countries or regions might respond to the threat of automation not only by shifting into economic sectors that have a lower risk of automation, but also by adapting the task profile of occupations so that they become less susceptible to automation. With the current methodology, it is impossible to capture the latter effect. Estimates that show how the number of jobs at risk of automation changes over time are based on how the number of jobs in different occupations changes over time. In other words, they show how regions gain or lose jobs in risky and less risky occupations.
Annex Table 2.A.1 presents details on the mean, high and significant risk of automation by occupation in Canada and the number of workers affected. These probabilities are defined for each occupation based on the Nedelkoska and Quintini (2018) methodology using PIAAC. Occupations with the highest mean risk of automation typically do not require specific skills or training, and include food preparation assistants, assemblers, labourers, refuse workers, cleaners and helpers. At the other end of the spectrum are occupations that require high level of education and training and which involve high degree of social interaction, creativity, problem-solving and caring for others. The high and significant risk of automation probabilities for each occupation in Canada are used to calculate the number of people at risk in each economic region in the country.
Source: OECD (2018[18]), Job Creation and Local Economic Development 2018: Preparing for the Future of Work, OECD Publishing, Paris, https://dx.doi.org/10.1787/9789264305342-en; Nedelkoska, L. and G. Quintini (2018[23]), “Automation, skills use and training”, OECD Social, Employment and Migration Working Papers, No. 202, OECD Publishing, Paris, https://dx.doi.org/10.1787/2e2f4eea-en.
2.3. What could the local impacts of automation look like in Ontario?
2.3.1. Some regions and segments of the population in Ontario face a higher risk of automation
The Province of Ontario is the largest economy in Canada and the most populous province. Ontario’s GDP accounts for about 40% of Canada’s GDP. With a population of almost 15 million people, Ontario is also home to almost 40% of the Canadian population. The province is made of eleven economic regions, of which the largest by economy and population is Toronto.
Within Ontario, the share of total jobs at risk of automation ranges from 41.1% in Ottawa to 49.4% in Stratford-Bruce Peninsula (see Figure 2.13). The two regions face the lowest and highest shares of jobs at high risk of automation and jobs at risk of significant change. The share of jobs at high risk of automation ranges from 12.6% in Ottawa to 17.4% in Stratford-Bruce Peninsula. On the other hand, many more jobs are at risk of significant change across Ontario, ranging from 28.5% in Ottawa to 31.9% in Stratford-Bruce Peninsula. Stakeholder interviews conducted for this study show that the Ontario workforce perceives that automation is already affecting them and that it will do even more so in the near future, disrupting many sectors. In addition, the prevailing view among Ontario employers is that jobs will be simply lost to automation. Businesses and workers in Ontario have a general sense that automation is here, that its scope is increasing, and that it will disrupt many sectors and change how Ontario works (Birnbaum and Farrow, 2018[26]). Box 2.4 presents estimates of the risk of automation across Census Metropolitan Areas (CMAs) in Ontario.
Differences in the occupational profile of regional labour markets are the drivers behind differences in the risk of automation within Ontario. Occupational differences largely reflect differences in the industrial structure of regions. Industries such as agriculture, manufacturing, food and beverage services, transport and forestry have a higher probability of losing jobs to automation (Nedelkoska and Quintini, 2018[23]). Regions facing a higher risk of automation in Ontario tend to also present relatively high employment shares in goods-producing sectors, including agriculture, utilities, forestry, construction and manufacturing (see Figure 2.14). Stratford-Bruce Peninsula has the highest share of employment in construction and agriculture among Ontario region, amounting to 11.6% and 8% respectively in 2018, while manufacturing employment is highest in Windsor-Sarnia across regions in Ontario.
At the same time, the risk of automation is present in some services sectors, where occupations entailing routine tasks, such as sales workers, administration and personal services, represent a notable share of employment across Ontario regions. For example, London and Muskoka-Kawarthas face a high risk of automation, despite relatively lower employment shares in the goods-producing sector. The risk is driven by services occupations, including for example personal services and sales workers. On the other hand, regions facing lower risks have higher employment shares in services that typically face lower risk of automation as jobs in these sectors involve fewer routine tasks. Toronto is the region in Ontario with the largest share of jobs in professional, scientific and technical services, and finance, insurance, real estate, rental and leasing (11.3% and 10.9% respectively). In Ottawa, public administration remains the largest employer at 17.4%, while employment shares in agriculture, construction and manufacturing are the lowest across all Ontario regions.
Figure 2.13. The share of jobs at risk of automation varies across regions in Ontario

Source: OECD calculations on Labour Force Surveys.
Box 2.4. How could the future of work affect cities in Ontario?
Digging deeper to look at Census Metropolitan Areas (CMAs) in Ontario, OECD estimates show that the variation in the share of jobs at risk of automation is even more pronounced. About 52.1% of jobs are at risk of automation in Brantford, amounting to about 30 000 jobs, the highest share across all Ontario CMAs. On the other hand, the share of jobs at risk of automation is lowest in Ontario’s part of Ottawa-Gatineau (39.5%). However, this represents a large number of jobs, given the CMA’s total employment, with almost 220 000 jobs at risk.
Table 2.3. Jobs at risk of automation across Ontario CMAs
|
Jobs at high risk of automation |
Jobs vulnerable to significant change |
||||
|---|---|---|---|---|---|
|
CMA |
Total employment (2018) |
Number of jobs |
Share of total employment |
Number of jobs |
Share of total employment |
|
Barrie |
106 750 |
17 150 |
16.1% |
33 460 |
31.3% |
|
Brantford |
55 500 |
10 402 |
18.7% |
18 550 |
33.4% |
|
Greater Sudbury |
68 289 |
10 449 |
15.3% |
21 448 |
31.4% |
|
Guelph |
75 695 |
11 596 |
15.3% |
23 078 |
30.5% |
|
Hamilton |
409 971 |
60 307 |
14.7% |
123 319 |
30.1% |
|
Kingston |
77 470 |
10 539 |
13.6% |
22 701 |
29.3% |
|
Kitchener-Cambridge-Waterloo |
287 332 |
44 721 |
15.6% |
87 691 |
30.5% |
|
London |
245 879 |
39 093 |
15.9% |
76 550 |
31.1% |
|
Oshawa |
215 875 |
32 376 |
15.0% |
66 001 |
30.6% |
|
Ottawa-Gatineau, Ontario part, Ontario/Quebec |
551 893 |
64 444 |
11.7% |
153 335 |
27.8% |
|
Ottawa-Gatineau, Ontario/Quebec |
733 355 |
89 634 |
12.2% |
207 593 |
28.3% |
|
Peterborough |
50 871 |
8 278 |
16.3% |
16 567 |
32.6% |
|
St. Catharines-Niagara |
196 620 |
32 195 |
16.4% |
62 961 |
32.0% |
|
Thunder Bay |
49 280 |
7 533 |
15.3% |
15 618 |
31.7% |
|
Toronto |
3 336 159 |
467 656 |
14.0% |
992 912 |
29.8% |
|
Windsor |
159 836 |
26 817 |
16.8% |
49 977 |
31.3% |
Source: OECD calculations on Labour Force Surveys.
Figure 2.14. Ontario regions most at risk present higher employment shares in goods-producing sectors

Note: Goods-producing sector includes agriculture; forestry, fishing, mining, quarrying, oil and gas; utilities; construction and manufacturing.
Source: OECD elaboration on Labour Force Surveys and Statistics Canada Table 14-10-0092-01 Employment by industry, annual, provinces and economic regions (x 1,000). DOI: https://doi.org/10.25318/1410009201-eng.
In addition, some segments of the population are more likely to be employed in high-risk occupations than others. Male-dominated occupations face a higher risk of automation, which typically results in men, rather than women, being mostly affected by equipment modernisation in Ontario (see Figure 2.15). This is typically related to higher male employment shares in occupations that entail repetitive and routine tasks. Around 150 000 men working as drivers and mobile plant operators face a risk of automation, compared to less than 30 000 women in Ontario. Similarly, more than 100 000 men working in metal, machinery and related trades face a risk of automation, compared to less than 15 000 women. There are however more women than men working as business and administration associate professionals and sales workers, who face a risk of automation. In addition, OECD work shows that across regions in the OECD, the low-skilled and young people are often in jobs at a higher risk of automation than the rest of the population. Low-skilled jobs are often those at higher risk as they entail elementary tasks easily automatable (OECD, 2019[27]). Young people also tend to be more employed in elementary occupations across the OECD (OECD, 2018[18]).
Figure 2.15. Men typically face a higher risk of automation than women in Ontario

Note: Automation estimates by gender are done using the same methodology as used for other automation calculations, but calculating the estimates for men and women separately instead of for the total number of people employed. The shares of high and significant risk are the same for both genders, the differences come from the allocation of men and women into different occupations.
Source: OECD calculations on Labour Force Survey.
2.3.2. Ontario regions facing a higher risk are characterised by a lower share of working age population and more rural communities
Several studies support the notion that shrinking prime-age working populations pushes firms to source for alternative injections of productivity beyond local labour, such as automation. Using data on robot adoption from the International Federation of Robotics and data on ageing from the United Nations, Acemoglu and Restrepo (2019[28]) have shown that between 40% and 65% of cross-country variation in the adoption of industrial robots can be explained by ageing alone. The analyses focuses on the manufacturing sector and industrial automation. An ageing workforce leads to automation, particularly through robotics, as employers react to a scarcity of middle-aged workers. The relative scarcity of middle-aged workers with the skills to perform manual production tasks increases the value of technologies that can substitute for them. In industries most amenable to automation, ageing can trigger the adoption of robots and as a result lead to greater productivity (Acemoglu and Restrepo, 2019[28]). The increase in the adoption of robots is greater in countries and regions where ageing has occurred more rapidly (Mercer and Oliver Wyman, 2018[29]).
Ontario regions facing a higher risk of automation tend to have a lower share of working age population (i.e. population aged 15-64). On the other hand, regions with lower risk tend to have higher shares of working age population, driven by net migration inflows over the past decades. Toronto, Ottawa and Kitchener-Waterloo-Barrie have the highest shares of working age population, amounting to 68.8%, 66.7% and 66.7% respectively. On the other hand, only 61.4% of the population is in working age in Stratford-Bruce Peninsula and 61.7% in Muskoka-Kawarthas. Toronto is also the region with the lowest share of population aged 65 and more, amounting to 14.5% of the total regional population. On the other hand, almost one in four is older than 65 in Muskoka-Kawarthas. Northeast, Kingston-Pembroke and Stratford-Bruce Peninsula also have more than 20% of the local population in the over 65 year group. Acknowledging the difficult labour market prospects of older workers, the Government of Canada has measures in place to help them transition into new jobs. These include for example specific funding transferred from the federal government to provincial and territorial governments in support of older workers through the Workforce Development Agreements (WDAs).
A prevalence of rural areas2 is also a feature of regions facing a higher risk of automation in Ontario. Muskoka-Kawarthas and Stratford-Bruce Peninsula are the two economic regions with the largest share of rural population, with one in two inhabitants living in rural areas. On average, 14% of the population is rural in Ontario, compared to 19% for the Canadian average. Regions, which have a low share of the population living in urban areas, have a higher share of jobs at risk of automation. OECD work shows that rural economies tend to have a lower share of service sector jobs that are better protected from automation. Smaller towns and rural areas are also more likely to be highly reliant on a handful of employers or on a single industry. While this does not necessarily increase the risk of automation in and of itself, it makes it more difficult to absorb displaced workers if one of the employers automates on a large scale (OECD, 2018[18]). Developing innovative solutions to provide education and apprenticeship training in rural areas is an important tool to support job transitions, as young people living in rural areas face a number of uniquely rural barriers, particularly concerning access to transport, careers advice, employment and training support, and youth services (OECD/ILO, 2017[30]).
2.3.3. Regions at higher risk also present lower levels of skills and poorer employment outcomes
The risk of automation tends to be higher in regions attaining lower levels of education in Ontario. Jobs facing a lower risk of automation typically require high education levels. Looking across the OECD, high-skill workers are geographically concentrated, often in more urban areas, and this concentration has increased over time. In Ottawa and Toronto, the two regions where the risk of automation is lowest, more than 30% of the population had a university certificate in 2016. On the other hand, less than 15% did so in Stratford-Bruce Peninsula and Northeast. OECD work shows that there is a negative relationship between the risk of automation and the share of workers with tertiary education. Regions that have the highest share of jobs at risk of automation also have the lowest share of workers with tertiary education (OECD, 2018[18]).
Poorer labour market outcomes are also a characteristic of regions showing a higher risk of automation. Looking at job creation trends over the last decade, regions that have experienced lower job creation (or job loss) tend to experience a higher risk. On the other hand, regions facing lower risks, such as Toronto and Ottawa, are those that have driven the creation of jobs. The combination of low jobs growth over the last decade and high risk of automation risks posing challenges for regional policy makers.
Regions with lower productivity have more potential for further automation and hence a higher risk of future job loss. OECD work highlights that automatable jobs are more likely to be concentrated in regions where productivity is low (OECD, 2018[18]). At least partially, this is because regions with low productivity make less use of advanced machines. Since automation tends to increase labour productivity, regions with low levels of productivity also tend to have low levels of automation.
Figure 2.16. Regions facing a higher risk in Ontario tend to have a less educated workforce

Note: Data on university attainment is from the 2016 Population Census.
Source: OECD elaboration on Labour Force Survey and 2016 Census.
2.3.4. The good news is that many regions in Ontario have created jobs in occupations at lower risk over the past decade
The creation of jobs in occupations at lower risk of automation has been sustained in Ontario over the 2011-2018 period (see Figure 2.17). The occupation that has grown the most is Business and Administration Associate Professionals, having added around 140 000 jobs. This is followed by other high-skill and professional occupations, such as Business and Administration Professionals and Science and Engineering Professionals, which have added around 70 000 and 60 000 new jobs respectively between 2011 and 2018. The number of Health Professionals and Teaching Professionals has also increased, by about 55 000 and 40 000. Some middle-skill occupations that typically face a rather high risk of automation, such as General and Keyboard Clerks, Customer Service Clerks and Numerical and Material Recording Clerks, have shed jobs. However, jobs have been created also in occupations facing a higher risk of automation over the 2011-2018 period, although not as many as in low-risk occupations. Two examples are Sales Workers and Drivers and Mobile Plant Operators, that have created around 30 000 jobs respectively. Other Canadian provinces have also created jobs predominantly in occupations at lower risk of automation between 2011 and 2018, including Alberta, Manitoba, Quebec and Saskatchewan. On the other hand, Newfoundland and Labrador and Prince Edward Island have lost jobs predominantly in riskier occupations, while New Brunswick and Nova Scotia have lost jobs predominantly in less risky occupations.
The Ontario economic regions of Hamilton-Niagara Peninsula, Kitchener-Waterloo-Barrie, Toronto and Windsor-Sarnia, have created jobs between 2011-2018 predominantly in occupations at a lower risk of automation (see Table 2.4). Box 2.6 and Box 2.7 present a spotlight on the economic regions of Hamilton-Niagara Peninsula and Kitchener-Waterloo-Barrie. In both regions, manufacturing, construction and transportation typically represent relevant sources of employment. However, recent years have seen the expansion of sectors such as professional and technical services, and information, culture and recreation. The risk of automation has also decreased in Muskoka-Kawarthas, but due to job loss in occupations at a higher risk of automation. Jobs at risk of automation have increased in other Ontario regions. London and Northwest have created jobs in riskier occupations. Job creation in occupations at risk of automation represents a critical trade-off for local policy makers. It can help improve labour market outcomes in the short term, but it also risks creating further risks for the future. Kingston-Pembroke, Ottawa, Northeast and Stratford-Bruce Peninsula have lost jobs predominantly in less risky occupations.
In the majority of regions across Canada, the risk of automation has decreased over the past decade (see Figure 2.18). Between 2011 and 2018, 35% of regions have created jobs predominantly in less risky occupations, while 20% have lost jobs predominantly in riskier occupations. However, the risk of automation has increased in the remaining regions, with 11% creating jobs predominantly in riskier occupations and 34% losing jobs predominantly in less risky occupations.
Figure 2.17. Ontario has mainly created jobs at lower risk of automation in the past decade

Note: Change in the number of jobs in thousands is a change between 2011 and 2018.
Source: OECD calculations on Labour Force Survey.
Table 2.4. Many regions have created jobs at lower risk in Ontario
Change between 2011 and 2018, economic regions in Ontario
|
A. Creating jobs, predominantly in less risky occupations |
B. Creating jobs, predominantly in riskier occupations |
C. Losing jobs, predominantly in riskier occupations |
D. Losing jobs, predominantly in less risky occupations |
|---|---|---|---|
|
Hamilton-Niagara Peninsula |
London |
Muskoka-Kawarthas |
Kingston-Pembroke |
|
Kitchener-Waterloo-Barrie |
Northwest |
Northeast |
|
|
Toronto |
Ottawa |
||
|
Windsor-Sarnia |
Stratford-Bruce Peninsula |
Note: Data is the change between 2011 and 2018. Type A and Type C regions experienced an increase in the share of jobs at low risk of automation with respect to occupations at high risk of automation. Type B and Type D regions experienced an increase in the share of jobs at high risk of automation. In both Type A and Type B regions aggregate employment grew, while in the Type C and Type D regions employment declined.
Source: OECD calculations on Labour Force Survey.
Box 2.5. A regional typology for employment creation in the face of digitalisation and automation
Regions can be classified into four categories depending on whether they gain or lose jobs and whether the gains or losses occur in sectors with high or low risk of automation. Ontario regions are classified according to whether they created jobs in the period 2011-2018, and further divided according to the type of occupation in which they created or shed employment. This classification provides insights into the short-term and long-term employment situation of a region (OECD, 2018[18]).
Table 2.5. The typology
|
Creating jobs |
Losing jobs |
||
|---|---|---|---|
|
Predominantly in less risky occupations |
Predominantly in riskier occupations |
Predominantly in riskier occupations |
Predominantly in less risky occupations |
|
These regions improve their job situation in the short term and also reduce their long-term risk of unemployment from automation |
These regions improve their short-term job situation, but do so at the expense of moving towards a riskier job profile in the future |
These regions have the typical profile of regions in the process of undergoing a structural change caused by automation. While jobs are being lost to automation today, the risk of further job losses due to automation decreases |
These regions face the greatest challenge. They suffer current job losses combined with an increasing risk of further job losses in the future due to automation |
Figure 2.18. Most Canadian regions have created jobs in less risky occupations

Source: OECD calculations on Labour Force Survey; OECD (2018[18]), Job Creation and Local Economic Development 2018: Preparing for the Future of Work, OECD Publishing, Paris, https://dx.doi.org/10.1787/9789264305342-en.
Box 2.6. Spotlight on Hamilton-Niagara Peninsula
The Hamilton-Niagara Peninsula region has experienced improving employment outcomes over the past decade. After peaking at 9.2% in 2009, in the aftermath of the global financial crisis, the unemployment rate has been steadily declining, but it has fluctuated since 2016. The rate stood at 5.4% in 2018, among the lowest in the province. However, labour force participation and employment rates remain relatively low in comparison with the rest of the province. Labour force participation has declined from 66.3% to 63.9% from 2008 to 2018, while the employment rate has decreased from 62% to 60.9% over the same period.
In Hamilton-Niagara Peninsula, 46.8% of jobs are at risk of automation, representing around 370 000 jobs. The risk of automation is slightly higher in Hamilton-Niagara Peninsula than across Ontario on average. About 15.8% of jobs (almost 120 000 jobs) are at high risk in Hamilton-Niagara Peninsula, while 31% (around 250 000 jobs) are at significant risk of change. Hamilton-Niagara Peninsula has been among the four regions in Ontario that have created jobs predominantly in occupations at lower risk of automation over the 2011-2018 period.
Professional, scientific and technical services and information, culture and recreation are the sectors that have experienced the largest increase in employment (33% and 26.4% respectively, adding a total of 11 700 and 7 300 new jobs to the economy). On the other hand, agriculture has experienced the largest drop (-18.8%, or -2 600 jobs), followed by utilities (-13.2%, or -700 jobs) and transportation and warehousing (-5.9% or -2 100 jobs). Manufacturing has traditionally represented an important source of employment in the region. More than 100 000 people were employed in manufacturing in Hamilton-Niagara Peninsula in 2008. Over the past decade manufacturing employment has experienced substantial decline. About 93 200 people were employed in manufacturing in 2018, accounting for 12.4% of regional employment. The manufacturing industry accounted for 14% of the Hamilton-Niagara Region’s total GDP in 2016. Only finance and insurance (17%) holds a larger share of GDP in the region. While manufacturing remains an important part of the region’s economy, its share of GDP has declined by more than 5% between 2006 and 2016 (Canadian Skills Training and Employment Coalition, 2016[31]).
Figure 2.19. What sectors have expanded and contracted the most in Hamilton?

Source: Statistics Canada. Table 14-10-0092-01 Employment by industry, annual, provinces and economic regions (x 1 000). DOI: https://doi.org/10.25318/1410009201-eng; Canadian Skills Training and Employment Coalition (2016[31]), Regional Manufacturing Profile: Hamilton-Niagara Region, http://cstec.ca/sites/cstec/files/reports/MANUFACTURING-PROFILE-%20Hamilton-Niagara.pdf (accessed on 28 February 2020).
Box 2.7. Spotlight on Kitchener-Waterloo-Barrie
The region of Kitchener-Waterloo-Barrie includes the census metropolitan areas (CMA) of Kitchener-Waterloo-Cambridge, Barrie, and Guelph, as well as Dufferin and Simcoe regions. The region had a total population of 1 299 265 in 2016. Important economic drivers in the region include a large high-tech sector, manufacturing and agriculture among other industries.
Businesses from the Kitchener-Waterloo-Barrie region were among the least confident in their organisation’s economic outlook, according to a 2014 survey from the Greater Barrie Chamber of Commerce, the Ontario Chamber of Commerce and Leger Marketing. A more recent survey undertaken by the ManpowerGroup however showed that the region was among the top 5 regions for hiring federally, as 35% of employers surveyed in 2018 expected to hire in the first quarter of 2019, while only 2% were expected to make job cuts. Among employers surveyed in 2019, 20% planned to hire in the first quarter of 2020, while 3% expected to make job cuts. The unemployment rate stood at 4.7% in 2018, lower than pre-crisis levels. The rate had substantially increased in 2009, when it totalled 9.1%, up from 5.7% in 2008. Although declining, labour force participation and employment rates are higher than on average across Ontario (67.3% versus 64.5% and 64.1% versus 60.9%).
Kitchener-Waterloo-Barrie faces a higher risk of automation than on average across Ontario, with 46.3% of jobs at risk of automation in 2018, corresponding to more than 450 000 jobs. About 15.6% of jobs (around 140 000 jobs) are at high-risk in Kitchener-Waterloo-Barrie, while 30.6% (around 310 000 jobs) are at significant risk of change. However, between 2011 and 2018 employment has grown predominantly in occupations facing a lower risk of automation. Looking at sectoral development, utilities (+ 29.3% or 1 200 new jobs), health care and social assistance (+17.6% or 12 400 new jobs), professional, scientific and technical services (16.3% or 7 100 new jobs), and information, culture and recreation (15% or 4 200 new jobs) are the sectors where employment has experienced higher growth rates. However, construction and transport sector employment has also grown (14.9% and 12%, adding 7 800 and 3 300 new jobs respectively). Manufacturing is the largest industry in the region by employment, accounting for 16.7% of total employment, or 121 300 jobs in 2018. In addition, manufacturing employment has continued to grow between 2011 and 2018 (+3.3%, or 3 900 new jobs). This poses potential labour market challenges for the future, as manufacturing and construction jobs are among those typically facing a higher risk of automation.
Figure 2.20. What sectors have expanded and contracted the most in Kitchener?

Source: Statistics Canada. Table 14-10-0092-01 Employment by industry, annual, provinces and economic regions (x 1 000), https://doi.org/10.25318/1410009201-eng; Nielsen, K. (2019[32]), Kitchener-Cambridge job market to cool in 2020: ManpowerGroup, https://globalnews.ca/news/6278877/kitchener-waterloo-region-jobs-market-2020-manpower-survey/ (accessed on 19 Feb 2020); Nielsen, K. (2018[33]), Kitchener, Cambridge job market looking solid for 2019: survey, https://globalnews.ca/news/4754727/kitchener-cambridge-job-market/ (accessed on 19 Feb 2020); Barrie Chamber of Commerce (2014[34]), Business confidence in Kitchener-Waterloo-Barrie region lower than provincial average*, http://barriechamber.wsiefusion.net/member-blog/business-confidence-in-kitchener-waterloo-barrie-region-lower-than-provincial-average (accessed on 19 Feb 2020); Greater Barrie Chamber of Commerce (2014[35]), Regional Economic Outlook: Kitchener-Waterloo-Barrie, http://barriechamber.com/2014/REO2014_GBCC_r1.pdf (accessed on 19 Feb 2020).
2.3.5. High-skill occupations are projected to drive job creation in Ontario
The demand for high-skill jobs is projected to grow in Canada over the coming decade. To take advantage of future developments in the labour market, re-skilling and up-skilling will be essential. While technological developments are likely to lead to the automation of tasks within different occupations, high-skill jobs, such as managerial jobs, are typically less vulnerable to automation, as they require fewer routine and repetitive tasks to be performed.
Employment and Social Development Canada (ESDC) has undertaken estimates of job growth in Canada for the period 2019-28 based on the 2016 National Occupational Classification (NOC). Occupations that usually require a university education are expected to have the fastest overall employment growth contributing also to the largest share (36%) of job creation among all skill levels. This is mostly the result of strong growth expectations in occupations related to professional services in health, as well as in the natural and applied sciences fields, including occupations in the information and technology sector. Occupations that usually require a college education or apprenticeship training are projected to have the second largest contribution to employment growth (33%). In comparison, occupations requiring high school education or on-the-job training are expected to account for a much lower share of total job creation (16% and 9% respectively). Sectors can be divided in three categories, based on their projected employment growth:
Sectors projected to experience above average employment growth (i.e. above or around 0.9% annually). These include professional and scientific services (such as computer system design), health care and social assistance, arts, entertainment and recreation services, food services, some transportation services, metal fabrication and machinery, and elementary and secondary schools;
Sectors projected to undergo average or moderate employment growth (i.e. between 0.4% and 0.9% annually). This is the case of some manufacturing and commercial services industries, as well as the construction, oil and gas, and mining industries;
Sectors projected to experience weak employment growth or declines in employment. These are mainly manufacturing and primary industries that have already experienced weak growth or decline over the past years, including wood products, textiles, clothing, furniture, paper, printing, agriculture, forestry and fishing.
Figure 2.21. High-skill occupations are projected to create thousands of jobs in Canada in the coming years

Source: Statistics Canada (historical) and ESDC 2019 COPS Projections.
2.4. What other challenges and opportunities could impact local labour markets in in Canada?
2.4.1. Non-standard forms of work can offer flexible work arrangements
A relevant labour market development witnessed across OECD countries over the last three decades is the gradual transition from the traditional open-ended contracts to non-standard forms of work (see Box 2.8 for information on the definition of non-standard work). Technological developments are an important mechanism behind the rise of non-standard forms of work. Consumers’ preferences on one hand have increasingly favoured customised services and just-in-time delivery. Technological developments within firms have also allowed to increase job flexibility and task outsourcing, including freelance contractors, temporary help agencies or others.
Box 2.8. Defining non-standard work
Non-standard work (NSW) arrangements are defined by what they are not: full-time dependent employment with a contract of indefinite duration – or what is generally considered the “standard” work arrangement. NSW therefore includes:
Temporary workers - workers in fixed-term contracts, including casual employees (duration is not fixed, but hours can vary), and seasonal workers in the Canadian context;
Part-time workers;
The self-employed.
While this definition may be considered problematic – as it lumps together precarious and non-precarious forms of work – the convention is followed by a large part of academic research as well as by international organisations. For this reason, this chapter adopts this definition.
An additional challenge lies in the fact that the distinction between different forms of employment has become increasingly intricate. In particular, there is a growing grey area between self-employment and wage employment. The growing numbers of self-employed working for just one company represent a group on the border between two categories. While these blurred lines are at the heart of the current debate on the benefits and downsides of the gig economy, data that allows researchers to settle the debate is scarce
Source: OECD (2018[18]), Job Creation and Local Economic Development 2018: Preparing for the Future of Work, OECD Publishing, Paris, https://dx.doi.org/10.1787/9789264305342-en; OECD (2015[36]), “Non-standard work, job polarisation and inequality”, in In It Together: Why Less Inequality Benefits All, OECD Publishing, Paris, https://dx.doi.org/10.1787/9789264235120-7-en.
Non-standard work represents an opportunity for some workers. For example, it can help people ensure a better matching between work time with family care, allowing many people – mostly women – to get a job at all. It can also help young people transition into the labour market and gain experience, which can lead to other job opportunities in the future (OECD, 2018[18]).
However, non-standard work can also be associated with a deterioration of working conditions. It reduces employment stability, increasing income volatility and potentially hampering career progression. Non-standard workers also traditionally have less access to training. Wages in fixed term contracts tend to be lower than in permanent ones, while work-related strain and job insecurity are higher. Flexible and more precarious forms of work may represent a way for firms to reduce labour costs, and, to the extent that they do not foster labour participation or career progression, these forms of work would reduce workers’ welfare. In particular, non-standard workers are usually worse off in terms of job security and social protection, and tend to receive less training and face barriers to accessing employment programmes (OECD, 2018[18]).
2.4.2. Temporary work has increased in Canada and across the OECD
Temporary work has been on the rise in Canada with some gender differences depending on its form. Around 12.8% of dependent workers were in temporary work in Canada in 2019. The latest share for the OECD average is 11.7% in 2018. Temporary jobs slightly increased from 12.3% in 2008. Although temporary employees represent a smaller share of total employment as compared to permanent workers, growth in temporary employment in Canada has outpaced permanent employment since 2000. Over the past two decades, the large share of growth in temporary employment in Canada can be attributed to increases in the number of people with a term or contract job. Women are as likely to be in temporary jobs as men in Canada (14% and 13% respectively in 2018). Among temporary employees, women are however more likely than men to have a casual, term or contract job (85% and 73%), but less likely to have a seasonal job (14% and 27% respectively). About 10% of women employed in temporary contracts had multiple jobs in 2018, compared to 6% of men (Statistics Canada, 2019[37]).
Temporary work is associated with lower earnings. In 2018, temporary workers earned on average CAD 21.80 per hour, compared to CAD 27.71 for permanent employees, and worked fewer hours on average per week (27.8 hours compared with 33.3), causing lower weekly earnings for temporary employees. Temporary workers also have lower median hourly wages than permanent employees (CAD 18.75 and 25 respectively). At the same time, about four out of ten temporary employees worked part-time, compared with 14% of permanent employees. Differences in the hourly wage also exist between unionised and non-unionised temporary workers across Canada, amounting to CAD 27.37 and CAD 19.56 per hour respectively (Statistics Canada, 2019[37]).
The pervasiveness of temporary contracts varies almost two-fold across provinces in Canada (see Figure 2.23). Seasonal employment is prevalent as a form of temporary work in Atlantic provinces, as it is highly dependent on fluctuations in commodity prices. The share of temporary employment was highest in Newfoundland and Labrador (23.6%) and Prince Edward Island (20.7%) across Canadian provinces in 2019. On the other hand, Manitoba, Alberta and Ontario had the lowest proportions of temporary employment in 2019 (11.7%, 12.1% and 12.2% respectively). Temporary employment has experienced limited fluctuations across provinces in Canada over the past decade. Alberta has experienced the largest increase in temporary employment between 2008 and 2019, amounting to 2.1 percentage points. On the other hand, temporary employment has decreased by 1.9 percentage points in Prince Edward Island and New Brunswick.
Figure 2.22. Non-standard employment has been on the rise in most OECD countries

Source: OECD (2018[18]), Job Creation and Local Economic Development 2018: Preparing for the Future of Work, OECD Publishing, Paris, https://dx.doi.org/10.1787/9789264305342-en; OECD (2018), "Labour Market Statistics: Employment by permanency of the job & Full-time part-time employment - common definition: incidence", OECD Employment and Labour Market Statistics (database), http://dx.doi.org/10.1787/lfs-data-en.
Figure 2.23. Temporary employment in some provinces is almost double the rate of others

Source: Statistics Canada. Table 14-10-0072-01 Job permanency (permanent and temporary) by industry, annual (x 1 000), DOI: https://doi.org/10.25318/1410007201-eng.
2.4.3. Part-time work has slightly increased in Canada
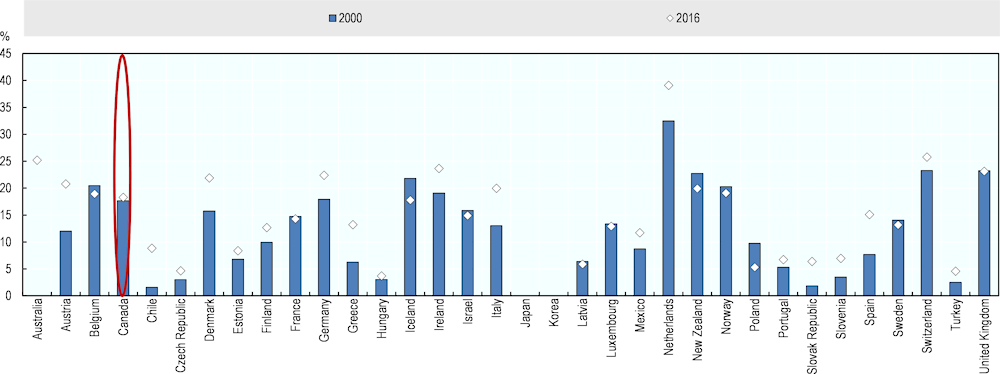
The share of part-time work, including those workers who usually work less than 30 hours per week at their main or only job, has increased in most OECD countries over the past decades, including a slight increase in Canada (see Figure 2.24). The share of part-time workers amounted to 18.9% in 2019 in Canada. The share was highest in British Columbia, where it amounted to 21.9% in 2019, followed by Manitoba at 19.6%. The share of part-time work is lowest in Prince Edward Island and New Brunswick, where 15.1% of employees work part-time. In Ontario, part-time work stood at 18.6% in 2019.
Part-time employment is more pronounced in some Ontario regions than others. A slight increase in part time employment was recorded in Ontario in the aftermath of the global financial crisis, with part-time employment up to 19.6% of total employment in 2009 and 2010. The incidence of part-time work over total employment was highest in Kingston-Pembroke than the rest of Ontario economic regions in 2019 (see Figure 2.25). Toronto has the lowest share of part-time work, amounting to 17.4% in 2019. Going to school and personal preference are the main reason for working part-time in Ontario, as in all other Canadian provinces (see Figure 2.26). However, compared to the Canadian average, a larger share of people in Ontario works part-time due to business conditions, whether they did or did not look for full-time employment over the past month (11.1% and 9.4% of part-time workers in Ontario and Canada respectively). There are also gender differences in the reasons for working part-time within Ontario. Caring for children is the reason why about 11.9% of women work part-time in the Province, compared to only 1.8% of men. On the other hand, men are more likely to be going to school compared to women, with about 34.8% of men who work part-time selecting this as the reason, compared to 26.3% of women.
Figure 2.24. Part-time work has increased in most OECD countries
Source: OECD (2018[18]), Job Creation and Local Economic Development 2018: Preparing for the Future of Work, OECD Publishing, Paris, https://dx.doi.org/10.1787/9789264305342-en; OECD (2018), "Labour Market Statistics: Employment by permanency of the job & Full-time part-time employment - common definition: incidence", OECD Employment and Labour Market Statistics (database), http://dx.doi.org/10.1787/lfs-data-en.
Figure 2.25. Part-time work is highest in Kingston-Pembroke across Ontario regions

Source: Statistics Canada. Table 14-10-0293-02 Labour force characteristics by economic region, three-month moving average, unadjusted for seasonality (x 1,000). DOI: https://doi.org/10.25318/1410029301-eng.
Figure 2.26. The main reasons for working part-time in Ontario are going to school and personal preference

Source: Statistics Canada. Table 14-10-0029-01 Part-time employment by reason, annual (x 1,000), https://doi.org/10.25318/1410002901-eng.
2.4.4. The number of self-employed workers has increased in Ontario
The proportion of self-employed workers across the OECD has remained constant at 15% over the last decade. The OECD defines the self-employed as those who own and work in their own business, including unincorporated business and own-account workers. Self-employed derive some economic benefit from their work, including for example wages, profits, in-kind benefits or family gains, which set them apart from those who undertake voluntary work. The nature of self-employment has substantially changed over the past decades. First, there has been a rise in the share of self-employed workers without employees, partly due to the increase in part-time self-employment—as is the case in the majority of OECD countries. Secondly, the emergence of the digital economy over recent years has created new markets, sectors and occupations, with some self-employed workers exploiting these new opportunities and creating high-value added work for themselves (e.g. freelancers, independent professionals). On the other hand, the digital economy has also generated new forms of precarious self-employment, with a growing number of self-employed workers who work for only one client and have a working arrangement which reflects that of an employee, but are registered as self-employed (OECD, 2018[18]).
In Canada there were 2.9 million self-employed in 2018, accounting for 15% of total employment, on an upward trend over the last decades. British Columbia emerges as the province with the highest share of self-employed workers (17.9%), followed by Saskatchewan (17.4%), Alberta (17.2%) and Ontario (15.5%) (see Figure 2.27). The largest majority of self-employed workers are men (62%), but the share of women being self-employed has increased over the past decade, mirroring an increase in women labour force participation. A growing share of self-employed workers are employed in professional, scientific and technical services, such as occupations in legal services, accounting, architecture, engineering and related services, computer system designs, management, scientific and technical consulting and scientific research and development, which require a high level of education. However, agriculture remains the sector with the highest prevalence of self-employment, with self-employed workers accounting for 57% of agriculture workers in 2018, although this has decreased over the past decades, mainly due to industrialisation and farm aggregation (Yssaad and Ferrao, 2019[38]).
The number of self-employed workers in Ontario has been on the rise over the last fifteen years. This has been led by increases in the number of self-employed unincorporated without paid help (e.g. working owners of businesses and farms, persons who do not have business such as baby-sitters and newspapers carriers), and incorporated self-employed without and with paid help. On the other hand, the number of unpaid family workers has decreased, partly reflecting the decrease in agricultural employment. Data from the 2016 Census shows that across Ontario, Stratford-Bruce Peninsula is the region with the largest share of self-employed workers, accounting for 17.5% of all workers, followed by Muskoka-Kawarthas at 14.5% (see Figure 2.28). The prevalence of self-employment in Stratford-Bruce Peninsula compared to other regions is partly linked to the higher shares of agriculture employment, which accounts for 8% of regional employment, compared to 1% on average across Ontario. On the other hand, less than 8% of workers are self-employed in Northwest.
Figure 2.27. Self-employment is highest in British Columbia
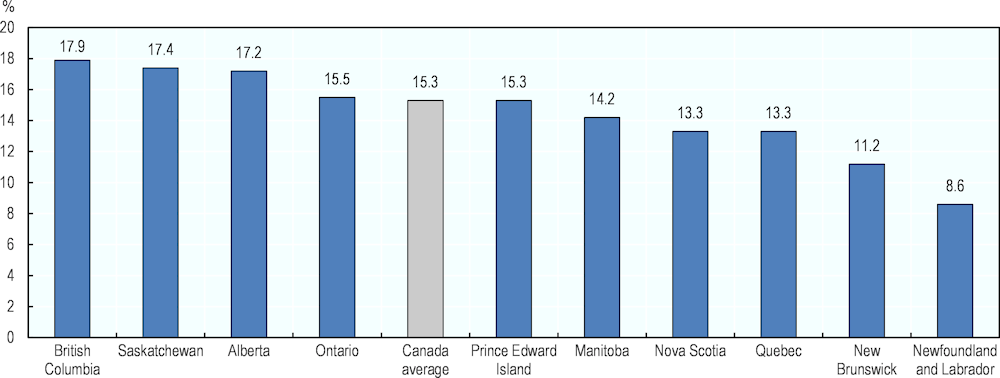
Source: Yssaad and Ferrao (2019[38]), Self-employed Canadians: Who and Why?, https://www150.statcan.gc.ca/n1/pub/71-222-x/71-222-x2019002-eng.htm (accessed on 1 October 2019).
Figure 2.28. Stratford-Bruce Peninsula has the highest share of self-employment in Ontario, driven by agriculture
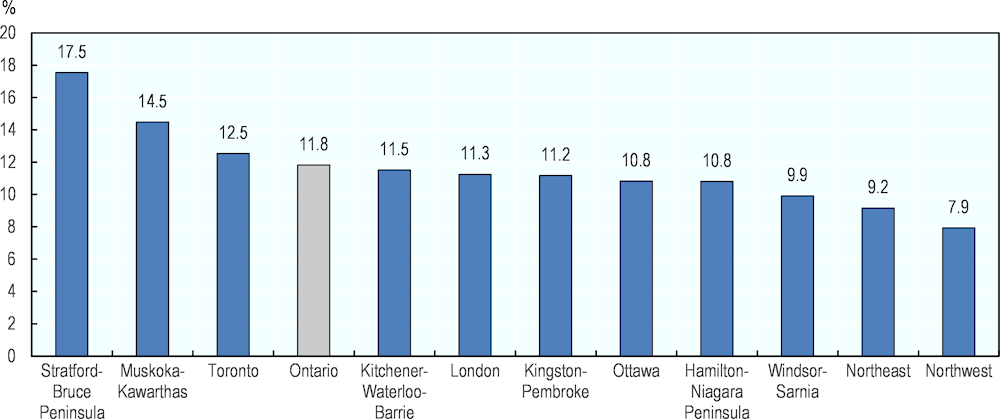
Source: OECD calculations on 2016 Census.
2.4.5. While it provides employment opportunities during the COVID-19 crisis, non-standard work risks posing further challenges to job quality
Non-standard workers are often required to continue working despite the health challenges linked to the COVID-19 outbreak. As an example, in the midst of the COVID-19 pandemic, food delivery drivers continue working, while they can lack sufficient protection against health risks by the platform providers. In the meantime, workers in e-commerce are under increasing work strain and pressure.
In addition, access to paid sick leave can be limited for non-standard workers. Heavy reliance on voluntary employer provisions can mean lower coverage in part-time jobs and for employees on short-time contracts. These gaps are a concern particularly when health risks are elevated for these groups, e.g., because of greater exposure to infection risks in the service sector. In Canada, access to paid and sick leave for temporary and part-time workers is the same as for standard workers, while self-employed rely on voluntary employer provision (OECD, 2020[39]).
With the objective of providing support to all categories of workers, the Canada Emergency Benefit (CERB), introduced in March 2020, targets both standard and non-standard workers. The CERB provides CAD 500 a week for up to 16 weeks to workers who have stopped working due to the COVID-19 outbreak. Eligibility criteria include residence in Canada; being at least 15 years old; having stopped working for reasons related to COVID-19; having had an income from employment or self-employment of at least CAD 5 000 in 2019; and having not quit the job voluntarily (Government of Canada, 2020[40]).
2.4.6. Building an inclusive labour market will be fundamental to sustain employment
Youth, women and vulnerable workers are being hit harder than others by the ongoing COVID-19 pandemic crisis. Among youth aged 15 to 24, employment decreased by 392 500 (-15.4%) in March 2020, the fastest rate of decline across the three main age groups. The decrease was almost entirely in part-time work, and brought the employment rate for youth to 49.1%, the lowest on record using comparable data beginning in 1976. Among people in the core working ages of 25 to 54, the monthly decline in employment for women (-298 500 or -5.0%) was more than twice that of men (-127 600 or -2.0%). Nearly half of the decrease among women was from part-time employment (-144,100 or -14.0%). In general, workers in less secure, lower-quality jobs, were more likely to see employment losses in March. The number of employees in temporary jobs decreased by 14.5% (-274 900) compared with a decline of 5.3% (-749 500) among employees with permanent jobs. Decreases were observed across all types of temporary work, led by those in casual employment (-23.5% or -136 000). There were 5.0% fewer temporary workers with a term or contract position (Statistics Canada, 2020[1]).
Youth had been facing challenging labour market conditions also before the COVID-19 outbreak. The youth (15-24) unemployment rate stood at 11.0% in 2019, almost double the rate for the overall population, mirroring trends across the OECD. Both the overall unemployment and youth unemployment rates went back to 2008 levels only in 2018 – a 10 year period of recovery. Canada’s youth unemployment has never fallen below 10% since 1976, even when the economy was doing particularly well and overall employment was high (Janzen, 2018[41]). The share of youth not in employment, education or training (NEET) was slightly lower in Canada than on average across the OECD in 2018, amounting to 11.9% and 13% respectively for the 15-29 year old population.
In addition, some segments of the population, including Indigenous People, older workers, immigrants, people with disabilities and the low-skilled, have typically participated less in the labour force in Canada (OECD, 2020[42]). In 2016, the unemployment rate for Indigenous People was 15.3%, compared to 7.4% for non-Indigenous people. Within Indigenous groups, unemployment was higher for Inuit (22.4%) and First Nations (18%) relative to Métis (11.2%). Indigenous People also have lower levels of education and skills outcomes, which represent a challenge for Indigenous People to access quality jobs (OECD, 2018[43]). The foreign-born population experiences lower labour force participation, and higher unemployment than the native-born population in Canada (OECD, 2019[44]). Labour force participation and unemployment rates stood at 64.5% and 5.9% in 2019 for landed migrants, compared to 66.2% and 5.5% for those born in Canada. Among landed migrants, unemployment is highest for those landed five years of less earlier, while participation is lowest for those landed more than ten years earlier (Statistics Canada, 2020[45]). Recent research shows that labour market challenges in Canada have been most acute for working age men without post-secondary qualifications, whose labour market outcomes outside of the oil-producing provinces have been poor. This cohort seems to be facing a series of secular challenges that threaten their inclusion in broader labour market gains (Speer, 2019[46]).
2.4.7. Ageing and sluggish productivity growth are other concerns for the long term
Challenges linked to an ageing population and weak productivity growth are other crucial concerns for labour market performance in Canada. Due to declining fertility rates and increased life expectancy, Canada, as most OECD economies, is experiencing population ageing. Ageing has reduced the contribution of labour utilisation to growth and the effects of population ageing on potential growth are predicted to intensify over the next decades (OECD, 2018[47]). The share of the population of working age in Canada (aged 15 to 64) has declined in recent years, standing at 66.9% in 2018, down from 69.5% in 2008. This is slightly above the OECD average of 65.1%. The median age was 39.4 years in 2008, while it rose to 40.8 in 2018. The median age in Canada is higher than for other OECD countries such as Australia and the United States (37.3 and 38.2 years in 2018 respectively). In addition, the median age varies across provinces, from 36.9 years in Alberta to 46.5 in Newfoundland and Labrador. Territories are characterised by substantially lower median age, only 34.8 years in Northwest Territories and 26.1 in Nunavut in 2018. The most populous Canadian provinces have witnessed a common trend characterised by a marked increase in the median age over the last decade. On the other hand, the median age slightly decreased in Manitoba and Saskatchewan.
Figure 2.29. Canada has aged more than Australia and the United States, with substantial differences across provinces
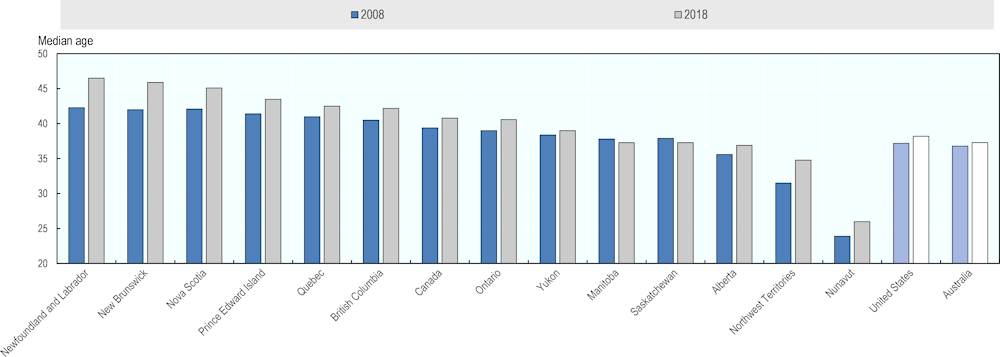
Source: Statistics Canada. Table 17-10-0005-01 Population estimates on July 1st, by age and sex DOI: https://doi.org/10.25318/1710000501-eng; Worldometer (n.d.[48]), Australia Population (live), https://www.worldometers.info/world-population/australia-population/ (accessed on 13 February 2020); Statista, (2019[49]), Median age of the U.S. population 1960-2018 | Statista, https://www.statista.com/statistics/241494/median-age-of-the-us-population/ (accessed on 13 February 2020).
Labour productivity growth in Canada has been subdued, lagging behind many Group of Seven (G7) economies (see Figure 2.30). Labour productivity as measured by hourly GDP (in constant prices 2010 and Purchasing Power Parity) amounts to USD 52.2 in Canada, compared to USD 62.4 across the G7 in 2018 (OECD, 2020[48]). Productivity growth in the Canadian economy has been considerably slower in the post-2000 period than in the pre-2000 period, but it has lagged behind the United States and other G7 since the 1980s (Sharpe and Tsang, 2018[49]) (Rao, Tang and Wang, 2008[50]). Business innovation is identified as an important lever that could help lift Canada’s overall productivity performance (The Conference Board of Canada, 2017[51]). It has been argued that the higher number of small firms in Canada relative to the United States may have lowered Canadian aggregate productivity levels. In addition, the gap between the productivity of small firms and that of large firms is estimated to be larger in Canada than in the United States (Statistics Canada, 2015[52]). Other factors that might have driven divergence in productivity between Canada and the United States include: the lower capital intensity of economic activity in Canada; an innovation gap relative to the United States; Canada’s relatively less developed high-tech sector; less developed human capital in Canada in terms of proportionately fewer university graduates and scientists and engineers in research and development; and more limited economies of scale and scope in Canada (Sharpe, 2003[53]).
Trends in labour productivity growth have differed by provincial economy in Canada. Manitoba and British Columbia lead labour productivity growth, averaging 1.5% and 1.4% per year between 2008 and 2018. British Columbia’s performance is partly linked to the province operating at or above its full capacity during much of the period when the local economy was booming due to activities tied to mortgage debt and real estate (Business Council of British Columbia, 2019[54]). Newfoundland and Labrador is the only province having experienced negative productivity growth over the same period (see Figure 2.31). However, Newfoundland and Labrador remains one of the provinces in Canada attaining the highest levels of labour productivity, amounting to CAD 76 per hour, preceded only by Saskatchewan and Alberta (79.6 and 78.8 respectively).
Dynamics in labour productivity across provinces in Canada depend on the sectoral composition of local economies. The tradable sector, which includes manufacturing, agriculture and extractive industries, as well as some services (parts of finance, advertising and publishing for example), has higher productivity growth rates than the non-tradable sector, which includes locally-rendered services, including health, education, retail and construction (OECD, 2018[55]). Saskatchewan, Alberta and Newfoundland and Labrador top the list when it comes to labour productivity as they have relatively large oil and gas extraction sectors. The large amount of capital investment involved in oil and gas extraction results in a higher overall output per worker. While mining, oil and gas are the sectors with by far the highest labour productivity in Canada, productivity growth has been particularly strong in agriculture, forestry, fishing and hunting, averaging an annual 5.1% between 2008 and 2018. This is partly due to the sector starting from low productivity levels in 2008. On the other hand, productivity growth has stalled or been negative in educational services, health care and social services, construction and administrative and support services.
Ontario has experienced labour productivity growth across sectors over the past decade, with the exception of manufacturing. Productivity growth has been driven by utilities and resource extraction, followed by agriculture, non-tradable and tradable services. The non-tradable services sector includes construction, distributive trade and transport, professional, scientific and technical activities as well as public administration and education. The tradable services sector includes information and communication, financial and insurance activities and other services. Productivity growth in utilities and resource extraction has gone hand in hand with employment losses in the sector. On the other hand, employment growth has been strong in non-tradable sectors, that have added around 730 000 jobs between 2008 and 2018. Also tradable services and agriculture have created jobs in Ontario, adding about 60 000 and 3 000 jobs respectively. Manufacturing has experienced both negative labour productivity growth and employment losses in Ontario over the same period.
Figure 2.30. Labour productivity growth in Canada has been lower than many G7 countries over the last two decades
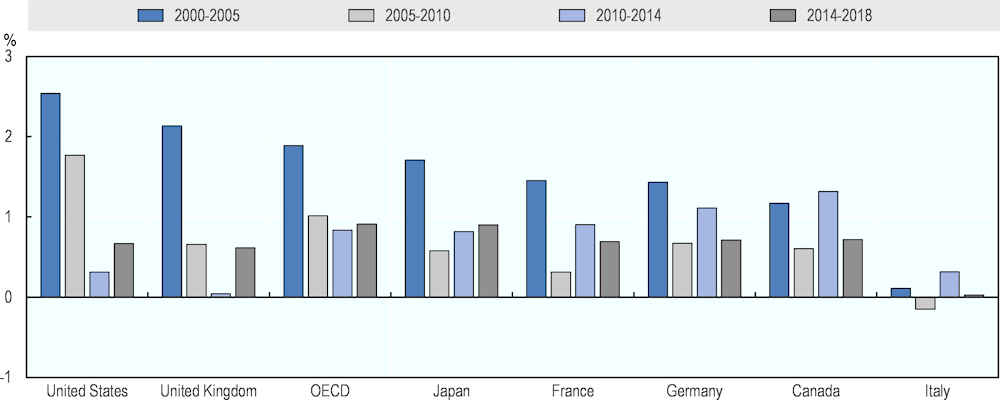
Source: OECD (2019[56]), OECD Compendium of Productivity Indicators 2019, https://dx.doi.org/10.1787/b2774f97-en.
Figure 2.31. Newfoundland and Labrador is the only province having averaged negative productivity growth over the past decade
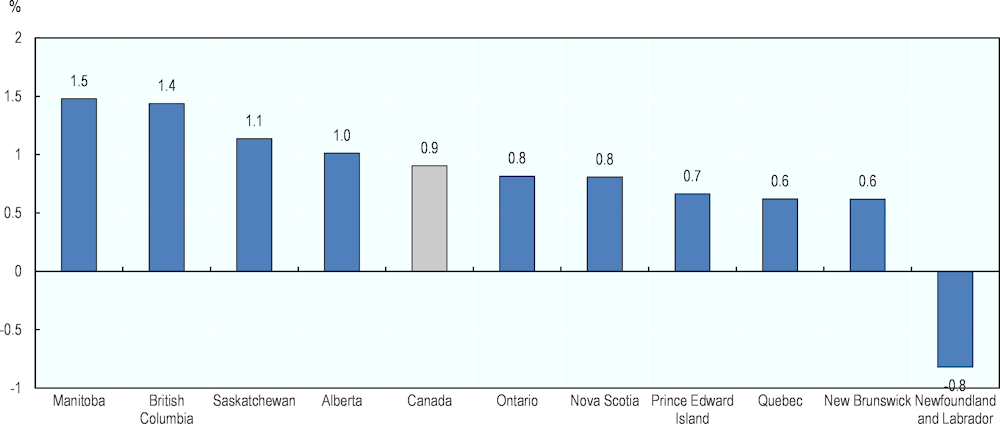
Note: Labour productivity is the ratio between real value added and hours worked. Data does not include the territories.
Source: Statistics Canada. Table 36-10-0480-01 Labour productivity and related measures by business sector industry and by non-commercial activity consistent with the industry accounts. DOI: https://doi.org/10.25318/3610048001-eng.
Figure 2.32. Agriculture has experienced the highest productivity growth in Canada
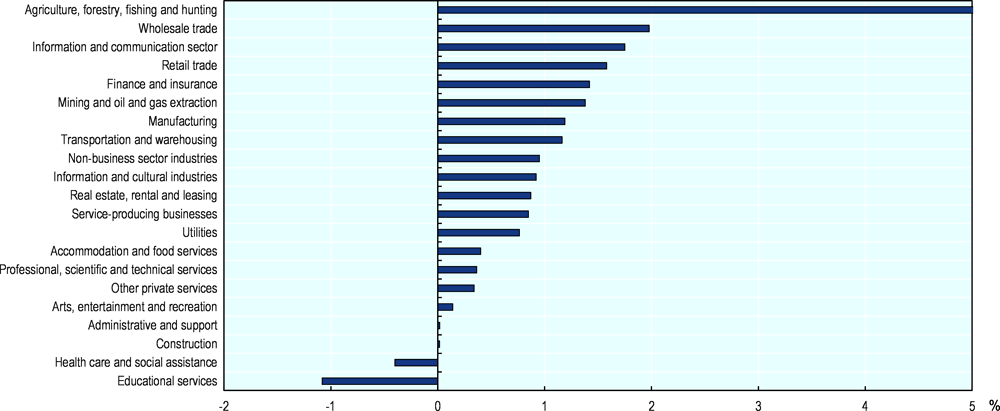
Note: Administrative and support services also includes waste management and remediation services.
Source: Statistics Canada. Table 36-10-0480-01 Labour productivity and related measures by business sector industry and by non-commercial activity consistent with the industry accounts. DOI: https://doi.org/10.25318/3610048001-eng.
Figure 2.33. Agriculture, tradable and non-tradable services have experienced productivity and employment growth in Ontario
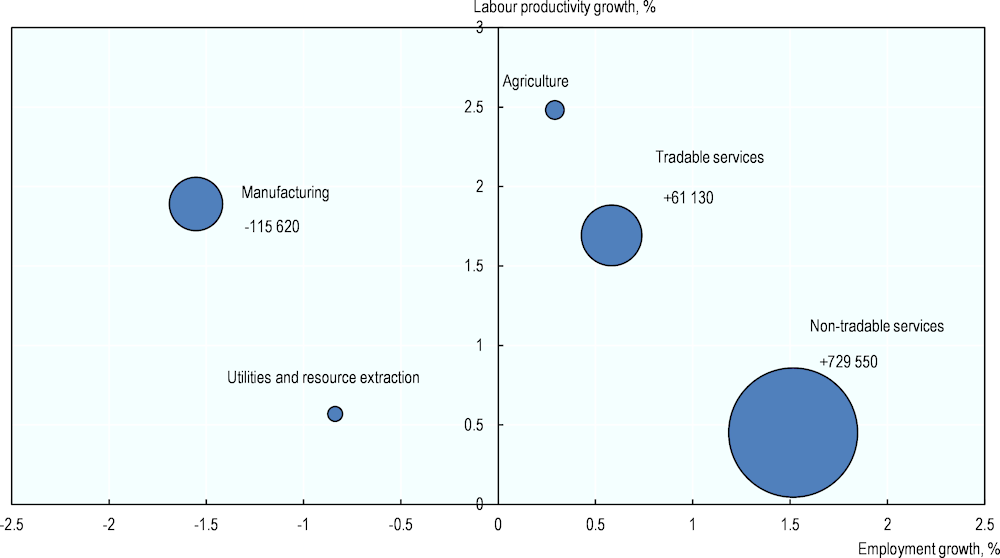
Note: Labour productivity is calculated using real gross value added in USD in constant 2015 prices and PPPs, regional employment and deflators. Employment change is the total change in employment over the period, bubble size indicates the size of the sector in terms of employment in 2008. Tradable services are taken as information and communication (J), financial and insurance activities (K), and other services (RSTU). Non-tradable services are composed of construction, distributive trade, repairs, transport, accommodation, food services activities (GHI), real estate activities (L), business services (MN), and public administration (OPQ). Real estate activities are excluded in this chart.
Source: Calculations on OECD Regional Statistics [Database].
Conclusion
The future of work is having a profound impact on labour markets across Canada. Ontario faces a risk of being impacted by automation which is similar to other Canadian provinces. However, there are substantial differences within provinces. The geographical concentration of occupations at risk of automation has the consequence that different regions face different risks. The ongoing COVID-19 pandemic is posing new and unexpected challenges, and it is likely to accelerate the speed of automation adoption in the workplace. The future of work is however also presenting new opportunities for people to get into jobs. Most regions in Ontario have created jobs in occupations at lower risk of automation and high-skill occupations are projected to drive employment growth in the coming years. In addition, some non-standard forms of work can provide the opportunity to adopt flexible working arrangements. However, they can also create challenges related to job quality. While automation is shaping local labour markets, skills needs are changing. More employers than ever report skills shortages and skills mismatches, which have a negative impact on productivity. This is the focus of the next chapter.
References
Acemoglu, D., & Restrepo, P. (2016). The Race Between Machine and Man: Implications of Technology for Growth, Factor Shares and Employment. National Bureau of Economic Research, Cambridge, MA. doi:10.3386/w22252
Acemoglu, D., & Restrepo, P. (2017). Secular Stagnation? The Effect of Aging on Economic Growth in the Age of Automation. Retrieved 02 19, 2020, from https://www.nber.org/papers/w23077.pdf
Acemoglu, D., & Restrepo, P. (2019). Demographics and Automation. Retrieved 05 07, 2020, from https://economics.mit.edu/files/16788
Autor, D., & Salomons, A. (2018). Is automation labor-displacing? Productivity growth, employment, and the labor share. Retrieved 02 17, 2020, from https://www.brookings.edu/wp-content/uploads/2018/03/1_autorsalomons.pdf
Barrie Chamber of Commerce. (2014). Business confidence in Kitchener-Waterloo-Barrie region lower than provincial average*. Retrieved 02 19, 2020, from http://barriechamber.wsiefusion.net/member-blog/business-confidence-in-kitchener-waterloo-barrie-region-lower-than-provincial-average
Birnbaum, L., & Farrow, J. (2018). The Impact of Technological Change on Ontario's Workforce. Retrieved 07 15, 2019, from http://brookfieldinstitute.ca/wp-content/uploads/RPT-RobotTalks-Summary.pdf
Business Council of British Columbia. (2019). B.C. has mostly caught up with Canada on productivity levels. Retrieved 02 13, 2020, from https://bcbc.com/insights-and-opinions/b-c-has-mostly-caught-up-with-canada-on-productivity-levels
Canadian Skills Training and Employment Coalition. (2016). Regional Manufacturing Profile: Hamilton-Niagara Region. Retrieved 02 28, 2020, from http://cstec.ca/sites/cstec/files/reports/MANUFACTURING-PROFILE-%20Hamilton-Niagara.pdf
Crawford Urban, M., & Johal, S. (2020). Understanding the Future of Skills: Trends and Global Policy Responses. Retrieved 05 14, 2020, from https://fsc-ccf.ca/wp-content/uploads/2020/01/UnderstandingTheFutureOfSkills-PPF-JAN2020-EN.pdf
Dao, M., Das, M., Koczan, Z., & Lian, W. (2017). Why Is Labor Receiving a Smaller Share of Global Income? Theory and Empirical Evidence. International Monetary Fund, Washington, D. C. Retrieved 02 17, 2020, from https://www.imf.org/en/Publications/WP/Issues/2017/07/24/Why-Is-Labor-Receiving-a-Smaller-Share-of-Global-Income-Theory-and-Empirical-Evidence-45102
Fields, A., Bourbeau, E., & Patterson, M. (2018). Annual review of the labour market, 2017. Retrieved 10 09, 2019, from https://www150.statcan.gc.ca/n1/pub/75-004-m/75-004-m2018001-eng.htm
Frey, C., & Osborne, M. (2013). The Future of Employment: How Susceptible are Jobs to Computerisation? University of Oxford. Retrieved 07 10, 2019, from https://www.oxfordmartin.ox.ac.uk/downloads/academic/The_Future_of_Employment.pdf
Government of British Columbia. (n.d.). Northeast - Province of British Columbia. Retrieved 02 18, 2020, from https://www2.gov.bc.ca/gov/content/environment/natural-resource-stewardship/cumulative-effects-framework/regional-assessments/northeast
Government of Canada. (2017). Canadian Occupational Projection System (COPS) - Job Openings (2017-2026). Retrieved 08 01, 2019, from http://occupations.esdc.gc.ca/sppc‑cops/l.3bd.2t.1ilshtml@-eng.jsp?lid=17&fid=1&lang=en
Government of Canada. (2020). Questions and Answers on the Canada Emergency Response Benefit. Retrieved 04 27, 2020, from https://www.canada.ca/en/services/benefits/ei/cerb‑application/questions.html
Greater Barrie Chamber of Commerce. (2014). Regional Economic Outlook: Kitchener-Waterloo-Barrie. Retrieved 02 19, 2020, from http://barriechamber.com/2014/REO2014_GBCC_r1.pdf
International Federation of Robotics. (2018). Executive Summary World Robotics 2018 Industrial Robots. International Federation of Robotics. Retrieved 07 04, 2019, from https://ifr.org/downloads/press2018/Executive_Summary_WR_2018_Industrial_Robots.pdf
InvestinOntario. (2019). Toronto adds more tech jobs than Seattle, the Bay Area and Washington D.C. combined. Retrieved 03 11, 2020, from https://www.investinontario.com/spotlights/toronto-adds-more-tech-jobs-seattle-bay-area-and-washington-dc-combined
Janzen, N. (2018). What’s the problem with Canada’s youth labour market? Retrieved from http://www.rbc.com/economics/economic‑reports/pdf/other‑reports/Canadianyouthlabour_Jul2018.pdf
Lamb, C. (2020). Automation, Accelerated: Will technology adoption amidst the pandemic leave Canada further behind? . Retrieved 05 15, 2020, from https://brookfieldinstitute.ca/commentary/automation-accelerated-will-technology-adoption-amidst-the-pandemic-leave-canada-further-behind-2/
Martel, L. (2019). The labour force in Canada and its regions: Projections to 2036. Retrieved 03 10, 2020, from https://www150.statcan.gc.ca/n1/pub/75-006-x/2019001/article/00004-eng.htm
McKinsey & Company. (2019). Economic Growth Strategy for Newfoundland and Labrador. Retrieved 05 07, 2020, from https://www.gov.nl.ca/fin/files/publications-pdf-mck-final-report.pdf
Mercer and Oliver Wyman. (2018). The Twin Threats of Aging and Automation. Retrieved 02 19, 2020, from https://info.mercer.com/rs/521-DEV-513/images/Workforce-For-the-Future-The-Twin-Threats-of-Aging-and-automation-POV.pdf?mkt_tok=eyJpIjoiTm1NeU9EWTNNbU5pWXpobSIsInQiOiJieXNJVzBpVDdzYjkrRk4yN2tKT0FOaGxwVlpnQUtacWxDSFNzOTRCVHprV0NhYmlzdDZvV2RTdmNqVFBQcTZGVzRZRWQ1UUczc3ZRYTdLeXVMRXFZdlpDVEN2Y0xIUUFLNFZ2UnJmN3pcL0FaVmpad1JTd1wvd2d2YVdpSHJRM0VEMmdBZmczaEh6cDV0SW00V1psdnlXZz09In0%3D
Moore, M. (2018). Unemployment still on the rise in N.L.: Stats Can. Retrieved 02 19, 2020, from https://www.cbc.ca/news/canada/newfoundland-labrador/unemployment-rising-newfoundland-labrador-1.4753099
Muro, M., Maxim, R., & Whiton, J. (2020). The robots are ready as the COVID-19 recession spreads. The Brookings Institution. Retrieved 04 22, 2020, from https://www.brookings.edu/blog/the-avenue/2020/03/24/the-robots-are-ready-as-the-covid-19-recession-spreads/
Nedelkoska, L., & Quintini, G. (2018). Automation, skills use and training. In OECD Social, Employment and Migration Working Papers. OECD Publishing, Paris, https://dx.doi.org/10.1787/2e2f4eea-en
Nielsen, K. (2018). Kitchener, Cambridge job market looking solid for 2019: survey. Retrieved 02 19, 2020, from https://globalnews.ca/news/4754727/kitchener-cambridge-job-market/
Nielsen, K. (2019). Kitchener-Cambridge job market to cool in 2020: ManpowerGroup. Retrieved 02 19, 2020, from https://globalnews.ca/news/6278877/kitchener-waterloo-region-jobs-market-2020-manpower-survey/
OECD. (2015). Non-standard work, job polarisation and inequality. In In It Together: Why Less Inequality Benefits All. OECD Publishing, Paris. doi:https://dx.doi.org/10.1787/9789264235120-7-en
OECD. (2018). Indigenous Employment and Skills Strategies in Canada. In OECD Reviews on Local Job Creation. OECD Publishing, Paris. doi:https://dx.doi.org/10.1787/9789264300477-en
OECD. (2018). Job Creation and Local Economic Development 2018: Preparing for the Future of Work. doi:https://dx.doi.org/10.1787/9789264305342-en
OECD. (2018). OECD Economic Surveys: Canada 2018. 2018/11. doi:https://dx.doi.org/10.1787/eco_surveys-can-2018-en
OECD. (2018). OECD Employment Outlook 2018. doi:https://dx.doi.org/10.1787/empl_outlook-2018-en
OECD. (2018). Productivity and Jobs in a Globalised World: (How) Can All Regions Benefit? OECD Publishing, Paris. doi:https://dx.doi.org/10.1787/9789264293137-en
OECD. (2019). Getting Skills Right: Engaging low-skilled adults in learning. Retrieved 02 25, 2020, from http://www.oecd.org/employment/emp/engaging-low-skilled-adults-2019.pdf
OECD. (2019). International Migration Outlook 2019. doi:https://dx.doi.org/10.1787/c3e35eec-en
OECD. (2019). OECD Compendium of Productivity Indicators 2019. doi:https://dx.doi.org/10.1787/b2774f97-en
OECD. (2020). From pandemic to recovery: Local employment and economic development . Retrieved 05 12, 2020, from https://read.oecd-ilibrary.org/view/?ref=130_130810-m60ml0s4wf&title=From-pandemic-to-recovery-Local-employment-and-economic-development
OECD. (2020). GDP per hour worked. doi:https://dx.doi.org/10.1787/1439e590-en
OECD. (2020). Supporting people and companies to deal with the COVID-19 virus: Options for an immediate employment and social-policy response. Retrieved 04 27, 2020, from https://oecd.dam-broadcast.com/pm_7379_119_119686-962r78x4do.pdf
OECD. (2020). Workforce Innovation to Foster Positive Learning Environments in Canada. In Getting Skills Right. OECD Publishing, Paris. doi:https://dx.doi.org/10.1787/a92cf94d-en
OECD/ILO. (2017). Engaging Employers in Apprenticeship Opportunities: Making It Happen Locally. OECD Publishing, Paris. doi:https://dx.doi.org/10.1787/9789264266681-en
Ontario Chamber of Commerce. (2019). The Great Mosaic: Reviving Ontario's Regional Economies. Retrieved 03 10, 2020, from https://occ.ca/wp-content/uploads/The-Great-Mosaic-Reviving-Ontarios-Regional-Economies.pdf
Patterson, M., Hazel, M., & Saunders, D. (2019). Annual review of the labour market, 2018. Retrieved 10 09, 2019, from https://www150.statcan.gc.ca/n1/pub/75-004-m/75-004-m2019002-eng.htm
Rao, S., Tang, J., & Wang, W. (2008). What Explains the Canada-US Labour Productivity Gap? Canadian Public PolicyAnalyse de Politiques, 34(2), 163-192. Retrieved 02 13, 2020, from https://www.jstor.org/stable/25463606?seq=3#metadata_info_tab_contents
Saunders, D., & Hazel, M. (2018). Students in the labour market: After the recession. Statistics Canada. Retrieved 05 07, 2020, from https://www150.statcan.gc.ca/n1/pub/75-004-m/75-004-m2018002-eng.htm
Sharpe, A. (2003). Why Are Americans More Productive Than Canadians? Retrieved 03 11, 2020, from http://www.csls.ca/reports/10-03-03_can-us.pdf
Sharpe, A., & Tsang, J. (2018). The Stylized Facts about Slower Productivity Growth in Canada. Retrieved 02 13, 2020, from http://www.csls.ca/ipm/35/IPM-35-Sharpe-Tsang.pdf
Speer, S. (2019). Forgotten people and forgotten places: Canada's economic performance in the age of populism. Retrieved 05 13, 2020, from https://macdonaldlaurier.ca/files/pdf/MLI_Speer_ScopingSeries1_FWeb.pdf
Statista. (2019). Median age of the U.S. population 1960-2018 | Statista. Retrieved 02 13, 2020, from https://www.statista.com/statistics/241494/median-age-of-the-us-population/
Statistics Canada. (2015). Canada-United States Labour Productivity Gap Across Firm Size Classes. Retrieved 03 11, 2020, from https://www150.statcan.gc.ca/n1/pub/15-206-x/2014033/part-partie1-eng.htm
Statistics Canada. (2016). Economic Regions - Variant of SGC 2016 - Introduction - Definitions. Retrieved 07 10, 2019, from http://www23.statcan.gc.ca/imdb/p3VD.pl?Function=getCET_Page&VD=318020&Item=318531
Statistics Canada. (2018). Economic region (ER). Retrieved 07 10, 2019, from https://www150.statcan.gc.ca/n1/pub/92-195-x/2011001/geo/er-re/er-re-eng.htm
Statistics Canada. (2019). Table 1.1 Geographic areas by province and territory, 2016 Census. Retrieved 05 07, 2020, from https://www12.statcan.gc.ca/census-recensement/2016/ref/dict/tab/t1_1-eng.cfm
Statistics Canada. (2019). Temporary employment in Canada. Retrieved 10 01, 2019, from https://www150.statcan.gc.ca/n1/daily-quotidien/190514/dq190514b-eng.htm
Statistics Canada. (2020). Labour force characteristics by immigrant status, annual. Retrieved 05 07, 2020, from https://www150.statcan.gc.ca/t1/tbl1/en/cv.action?pid=1410008301
Statistics Canada. (2020). Labour Force Survey, April 2020. Retrieved 05 12, 2020, from https://www150.statcan.gc.ca/n1/daily-quotidien/200508/dq200508a-eng.htm
Statistics Canada. (2020). Labour Force Survey, March 2020. Retrieved 04 21, 2020, from https://www150.statcan.gc.ca/n1/daily-quotidien/200409/dq200409a-eng.htm
Statistics Canada. (2020). Labour Force Survey, May 2020. Retrieved 06 09, 2020, from https://www150.statcan.gc.ca/n1/daily-quotidien/200605/dq200605a-eng.htm?HPA=1
The Conference Board of Canada. (2017). Labour Productivity Growth. Retrieved 02 13, 2020, from https://www.conferenceboard.ca/hcp/provincial/economy/labour-productivity.aspx
The Conference Board of Canada. (2017). Unemployment Rate - Economy Provincial Rankings . Retrieved 03 10, 2020, from https://www.conferenceboard.ca/hcp/provincial/economy/unemployment.aspx
Worldometer. (n.d.). Australia Population (live). Retrieved 02 13, 2020, from https://www.worldometers.info/world-population/australia-population/
Yssaad, L., & Ferrao, V. (2019). Self-employed Canadians: Who and Why? Retrieved 10 01, 2019, from https://www150.statcan.gc.ca/n1/pub/71-222-x/71-222-x2019002-eng.htm
Annex 2.A
Annex Figure 2.A.1. Alberta: jobs at risk of automation
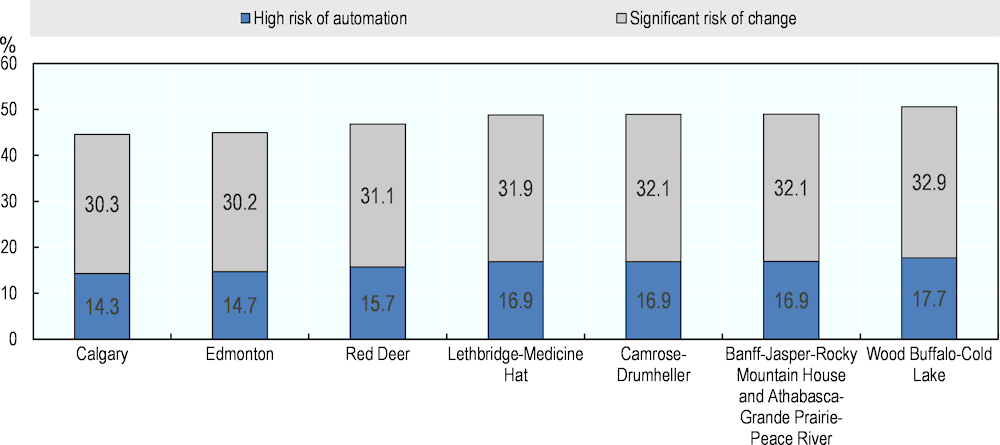
Source: OECD calculations on Labour Force Surveys.
Annex Figure 2.A.2. British Columbia: jobs at risk of automation
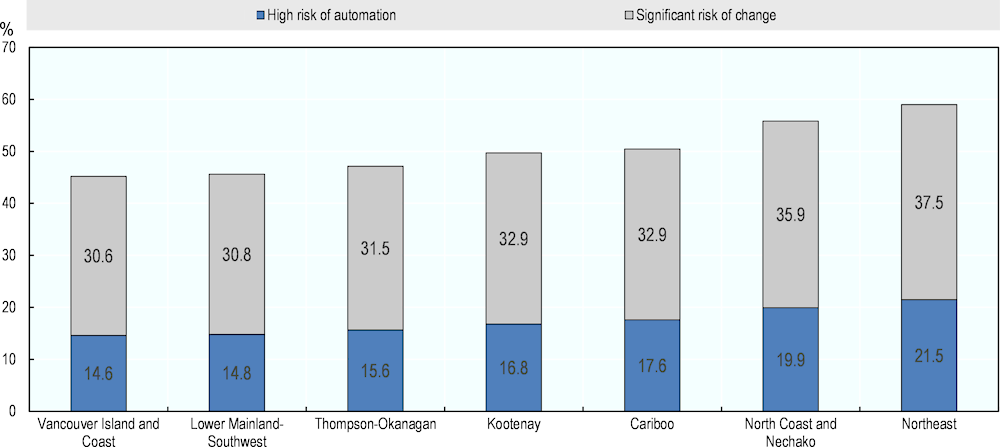
Source: OECD calculations on Labour Force Surveys.
Annex Figure 2.A.3. Manitoba: jobs at risk of automation
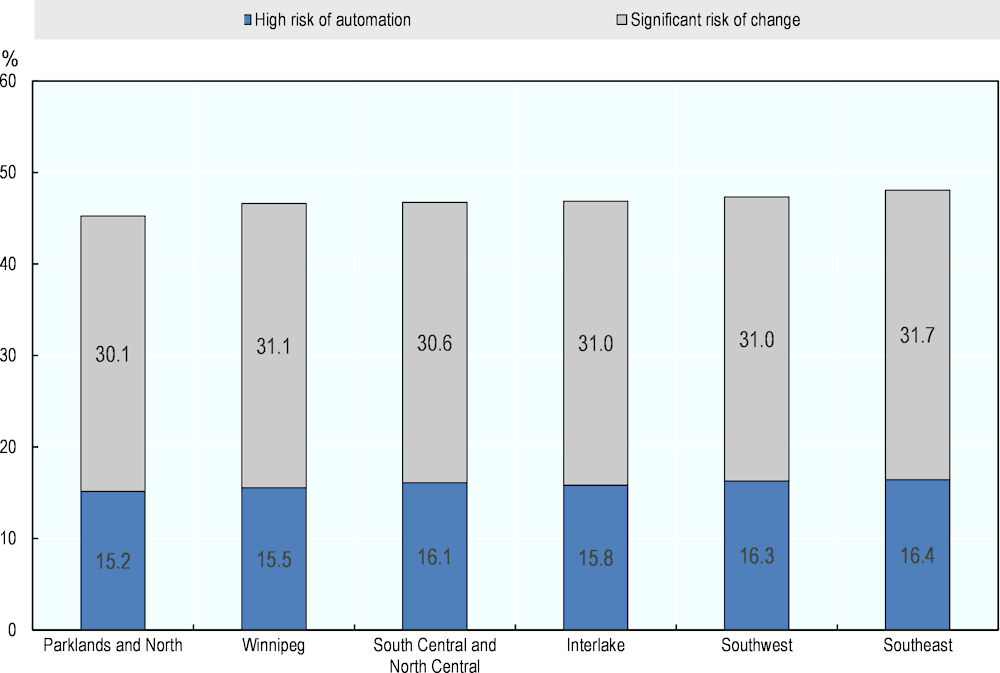
Source: OECD calculations on Labour Force Surveys.
Annex Figure 2.A.4. New Brunswick: jobs at risk of automation
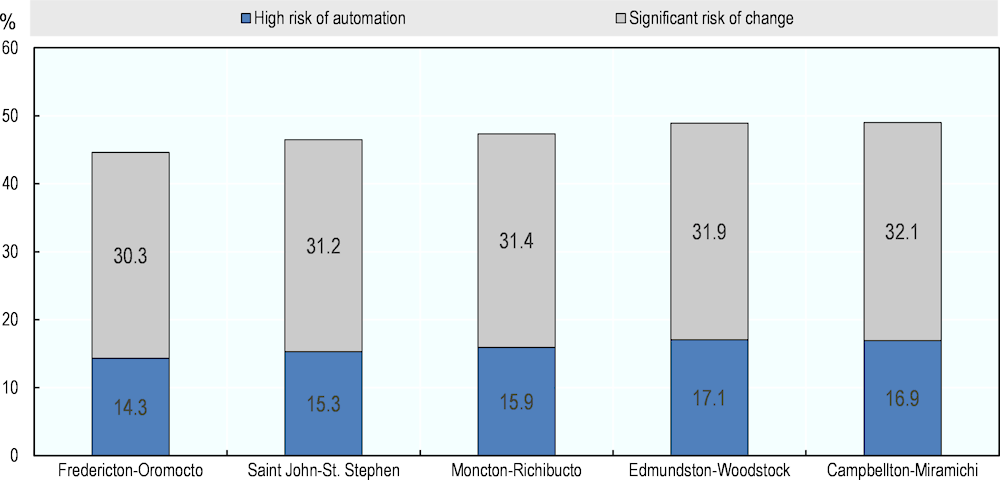
Source: OECD calculations on Labour Force Surveys.
Annex Figure 2.A.5. Newfoundland and Labrador: jobs at risk of automation
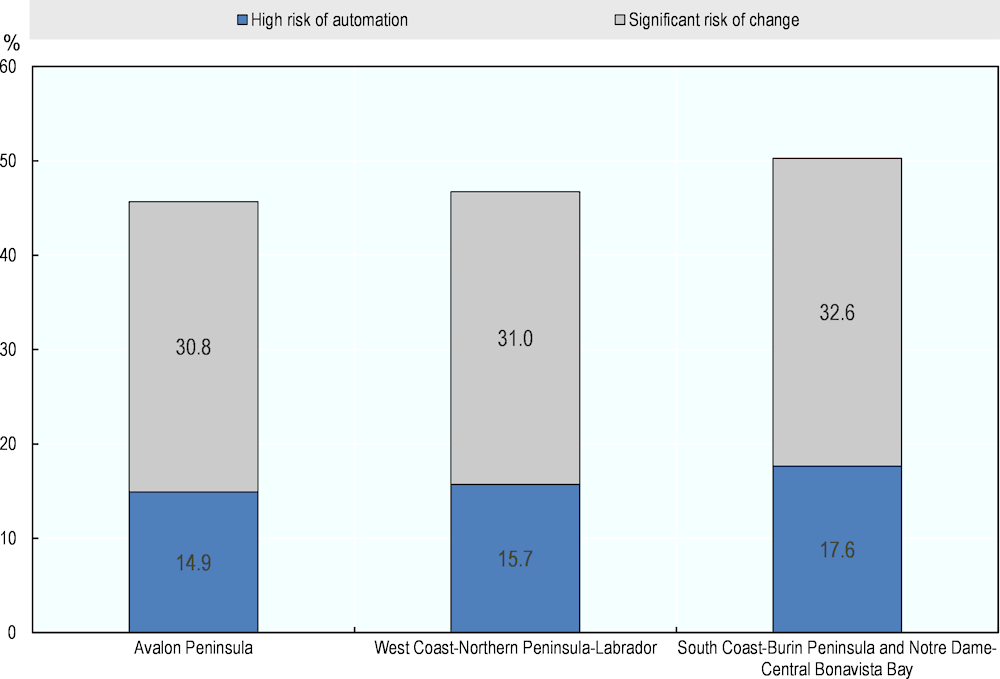
Source: OECD calculations on Labour Force Surveys.
Annex Figure 2.A.6. Nova Scotia: jobs at risk of automation
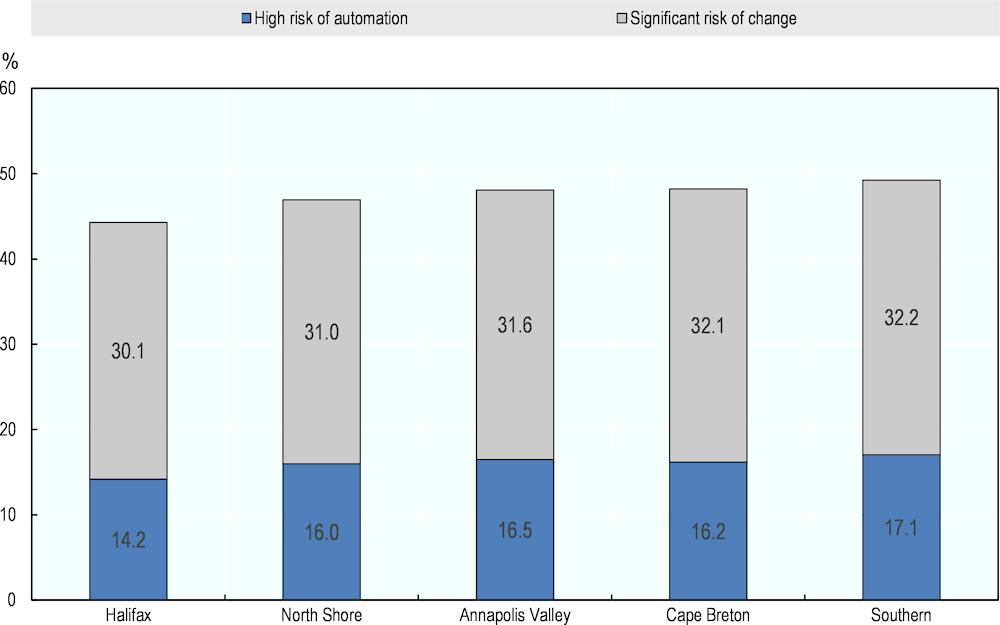
Source: OECD calculations on Labour Force Surveys.
Annex Figure 2.A.7. Quebec: jobs at risk of automation
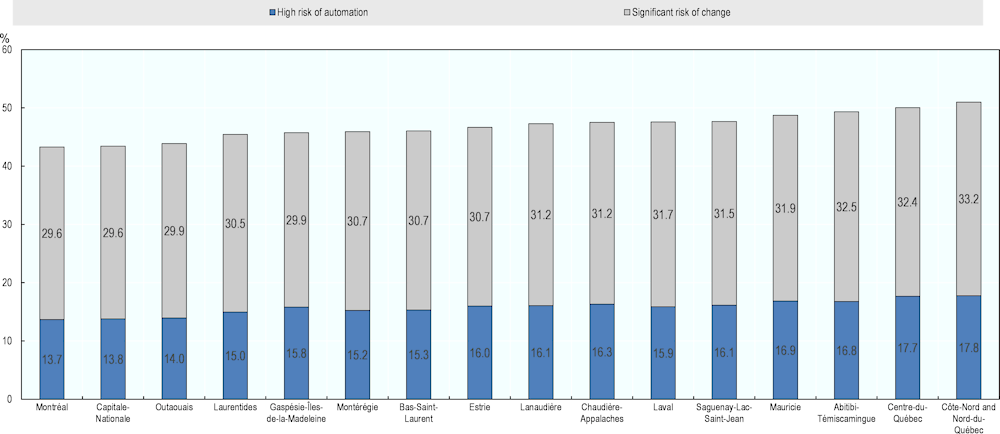
Source: OECD calculations on Labour Force Surveys.
Annex Figure 2.A.8. Saskatchewan: jobs at risk of automation
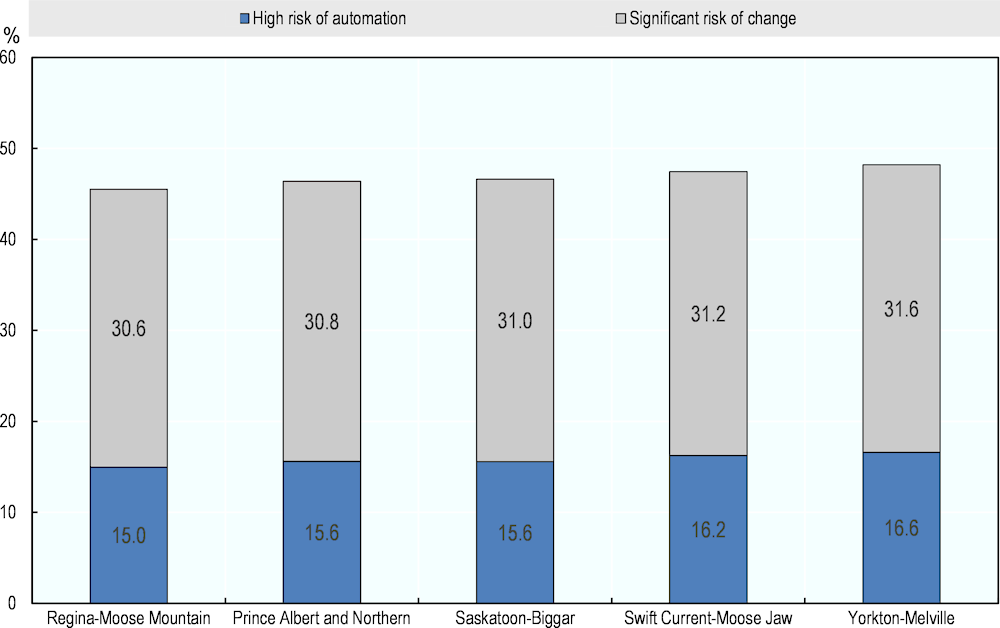
Source: OECD calculations on Labour Force Surveys.
Annex Table 2.A.1. Automation probabilities and calculations
|
Occupation (ISCO-08) |
Mean probability of automation |
High risk of automation |
Significant risk of change |
Total employment (Canada, 2018) |
Workers at high-risk |
Workers at significant risk |
|---|---|---|---|---|---|---|
|
94 |
0.639117 |
0.3631 |
0.487006 |
104 137 |
37 813 |
50 715 |
|
93 |
0.618405 |
0.407734 |
0.372157 |
454 995 |
185 517 |
169 329 |
|
91 |
0.615125 |
0.306219 |
0.491768 |
349 923 |
107 153 |
172 081 |
|
96 |
0.595053 |
0.31844 |
0.472828 |
441 251 |
140 512 |
208 636 |
|
82 |
0.593685 |
0.380255 |
0.323469 |
81 045 |
30 818 |
26 216 |
|
75 |
0.589751 |
0.319752 |
0.395943 |
564 382 |
180 461 |
223 464 |
|
83 |
0.572421 |
0.272083 |
0.427021 |
656 147 |
178 526 |
280 189 |
|
44 |
0.569305 |
0.351238 |
0.351712 |
274 782 |
96 514 |
96 644 |
|
51 |
0.552404 |
0.247781 |
0.396458 |
838 392 |
207 738 |
332 387 |
|
62 |
0.550794 |
0.212313 |
0.461506 |
101 085 |
21 462 |
46 651 |
|
81 |
0.549266 |
0.331124 |
0.329114 |
332 842 |
110 212 |
109 543 |
|
41 |
0.549025 |
0.2108 |
0.468888 |
145 212 |
30 611 |
68 088 |
|
43 |
0.539582 |
0.236643 |
0.36636 |
316 871 |
74 985 |
116 089 |
|
74 |
0.539089 |
0.216449 |
0.359271 |
337 821 |
73 121 |
121 369 |
|
92 |
0.538197 |
0.161596 |
0.481661 |
79 952 |
12 920 |
38 510 |
|
52 |
0.537421 |
0.201836 |
0.427368 |
1 172 254 |
236 604 |
500 983 |
|
73 |
0.52306 |
0.205748 |
0.465147 |
356 794 |
73 410 |
165 962 |
|
72 |
0.512692 |
0.1924 |
0.381105 |
653 054 |
125 648 |
248 882 |
|
42 |
0.502638 |
0.098678 |
0.441922 |
531 371 |
52 434 |
234 825 |
|
71 |
0.48285 |
0.168879 |
0.288842 |
557 424 |
94 137 |
161 007 |
|
32 |
0.456921 |
0.133225 |
0.297774 |
591 338 |
78 781 |
176 085 |
|
61 |
0.453167 |
0.179475 |
0.261519 |
277 291 |
49 767 |
72 517 |
|
33 |
0.448923 |
0.09177 |
0.314997 |
2 101 552 |
192 859 |
661 982 |
|
35 |
0.432274 |
0.038125 |
0.345548 |
103 948 |
3 963 |
35 919 |
|
54 |
0.427346 |
0.12771 |
0.277001 |
206 765 |
26 406 |
57 274 |
|
25 |
0.41375 |
0.04984 |
0.293536 |
187 199 |
9 330 |
54 949 |
|
53 |
0.406935 |
0.116273 |
0.249298 |
331 662 |
38 563 |
82 683 |
|
24 |
0.406032 |
0.052149 |
0.255411 |
839 275 |
43 768 |
214 360 |
|
31 |
0.392399 |
0.092125 |
0.207638 |
626 934 |
57 756 |
130 176 |
|
21 |
0.385726 |
0.047153 |
0.219857 |
791 572 |
37 325 |
174 033 |
|
34 |
0.377875 |
0.051454 |
0.267228 |
435 794 |
22 423 |
116 456 |
|
26 |
0.370823 |
0.035738 |
0.237773 |
467 762 |
16 717 |
111 221 |
|
14 |
0.32979 |
0.037117 |
0.092083 |
416 382 |
15 455 |
38 342 |
|
12 |
0.312593 |
0.00717 |
0.090361 |
288 323 |
2 067 |
26 053 |
|
13 |
0.311814 |
0.025525 |
0.121197 |
501 288 |
12 795 |
60 755 |
|
22 |
0.31147 |
0.020256 |
0.115895 |
642 205 |
13 009 |
74 429 |
|
11 |
0.309954 |
0.013378 |
0.070402 |
65 887 |
881 |
4 638 |
|
23 |
0.2505 |
0.027889 |
0.089298 |
928 950 |
25 908 |
82 953 |
Note: occupations are ranked in descending order of mean risk of automation. Occupations are coded in ISCO-08, as this is the classification used in PIAAC. Conversion tables from NOC to ISCO-08 were used.
Source: OECD based on PIAAC and Labour Force Surveys.
Notes
← 1. O*NET provides a set of 277 quantitative variables that serve as descriptions of the skill requirements for each of the 702 occupations in the US classification of occupations. O*NET was originally made up of labour market analysts, although it now also uses continuous surveys of workers and experts in order to keep track of changes in the nature of jobs.
← 2. Rural areas (RAs) include all territory lying outside population centres (POPCTRs). Taken together, population centres and rural areas cover all of Canada. Rural population includes all population living in rural areas of census metropolitan areas (CMAs) and census agglomerations (CAs), as well as population living in rural areas outside CMAs and CAs.