This chapter explores the relationship between school type (broadly, public or private), on the one hand, and student performance and equity in the education system, on the other. It also examines whether giving parents a greater choice of schools for their child is related to the quality of the education system, as a whole.
PISA 2018 Results (Volume V)

Chapter 7. Private schools and school choice
Abstract
Over the past two decades, education policies involving private schools, school competition and school choice have been the focus of sometimes heated debate in a growing number of countries (Adamson, Astrand and Darling-Hammond, 2016[1]; Forsey, Davies and Walford, 2008[2]; Chakrabarti and Peterson, 2009[3]; Koinzer, Nikolai and Waldow, 2017[4]).
The governance of school funding across OECD countries is characterised by complex relationships between the various actors involved in raising and spending funds for schooling. While the majority of school funding originates at the central government level, other actors increasingly contribute to raising funds, including subcentral governments. Private spending on schools has increased considerably in recent years and international funding provides an important source of funding in a range of countries (OECD, 2017[5]). These cross-country differences should be taken into account in interpreting results related to public/private schools.
In this chapter, two of these issues are explored using PISA data. The first is whether policies aimed at increasing the involvement of private institutions in the education system (e.g. such as providing government funds through vouchers or other mechanisms to operate private schools) are correlated with an improvement in student performance and equity in education. The chapter considers this issue by examining the rate of private school enrolment across PISA-participating countries and economies, and how it has changed over time. It also explores the relationship between school type and student performance, taking into account the socio-economic profile of public and private schools.
In addition, the chapter examines the issue of school choice. According to advocates of school choice, expanding the availability of schools can improve student outcomes because doing so provides incentives for schools, both public and private, to improve their instructional quality. But the evidence on this is not conclusive (Hoxby, 2002[5]; Urquiola, 2016[6]). Moreover, some research warns that school choice can unintentionally widen already existing inequities in education because socio-economically disadvantaged families are more constrained in their choice of school than advantaged families (Hsieh and Urquiola, 2006[7]; Schneider, Elacqua and Buckley, 2006[8]; Goldring and Phillips, 2008[9]; Rowe and Lubienski, 2017[10]).
What the data tell us
On average across OECD countries in 2018, only 2 out of 10 students attended a private school (either private dependent or independent); but in Chile, Hong Kong (China), Lebanon, Macao (China), the Netherlands, the United Arab Emirates and the United Kingdom, more than one in two students attended a private school.
The share of students enrolled in private dependent and independent schools remained stable since 2000, on average across OECD countries, but it increased in 10 education systems and decreased in 2. Between 2015 and 2018, the share of students in private schools increased in 12 and decreased in 8 education systems.
After accounting for students’ and schools’ socio-economic profile, students in public schools scored higher in reading than students in private schools, on average across OECD countries (by 14 score points, in favour of public schools) and in 19 education systems (ranging from 13 score points higher in Indonesia to 117 points higher in Serbia). At the system level, across all countries and economies, school systems with larger shares of students in private-independent schools tended to show lower mean performance in reading, mathematics and science, after accounting for per capita GDP.
On average across OECD countries in 2018, 78% of students attended a school whose principal reported that there is at least one other school in the same area available for students. In most countries, and on average across OECD countries, school availability and perhaps competition is associated with better reading performance, before accounting for socio-economic disparities; but there is no difference in student performance after accounting for students’ and schools’ socio-economic profile.
Figure V.7.1. Private schools and school choice in PISA 2018

Public and private schools
As defined in PISA and in this report, public schools are those managed by a public education authority, government agency, or governing board appointed by government or elected by public franchise. Private schools refer to schools managed directly or indirectly by a non-government organisation (such as a church, trade union, business or other private institution). PISA distinguishes between two types of school within the private school sector, based on their level of public funding. Government-independent private schools are those funded mainly through student fees or other private contributions (e.g. benefactors, donations); government-dependent private schools are privately managed schools that receive more than half of their funding from government sources.
Student enrolment in public and private schools
In most countries and economies that participated in PISA 2018, the large majority of 15-year-old students attended public schools (Figure V.7.2). On average across OECD countries, 82% of students attended a public school. In 56 out of 68 education systems, at least 80% of students attended public schools, including 24 education systems in which at least 95% of students attended public schools. In the United States, one of the countries where the debate on school choice is particularly vigorous, 93% of students attended public schools (Table V.B1.7.1).
Figure V.7.2. Student enrolment in public and private schools
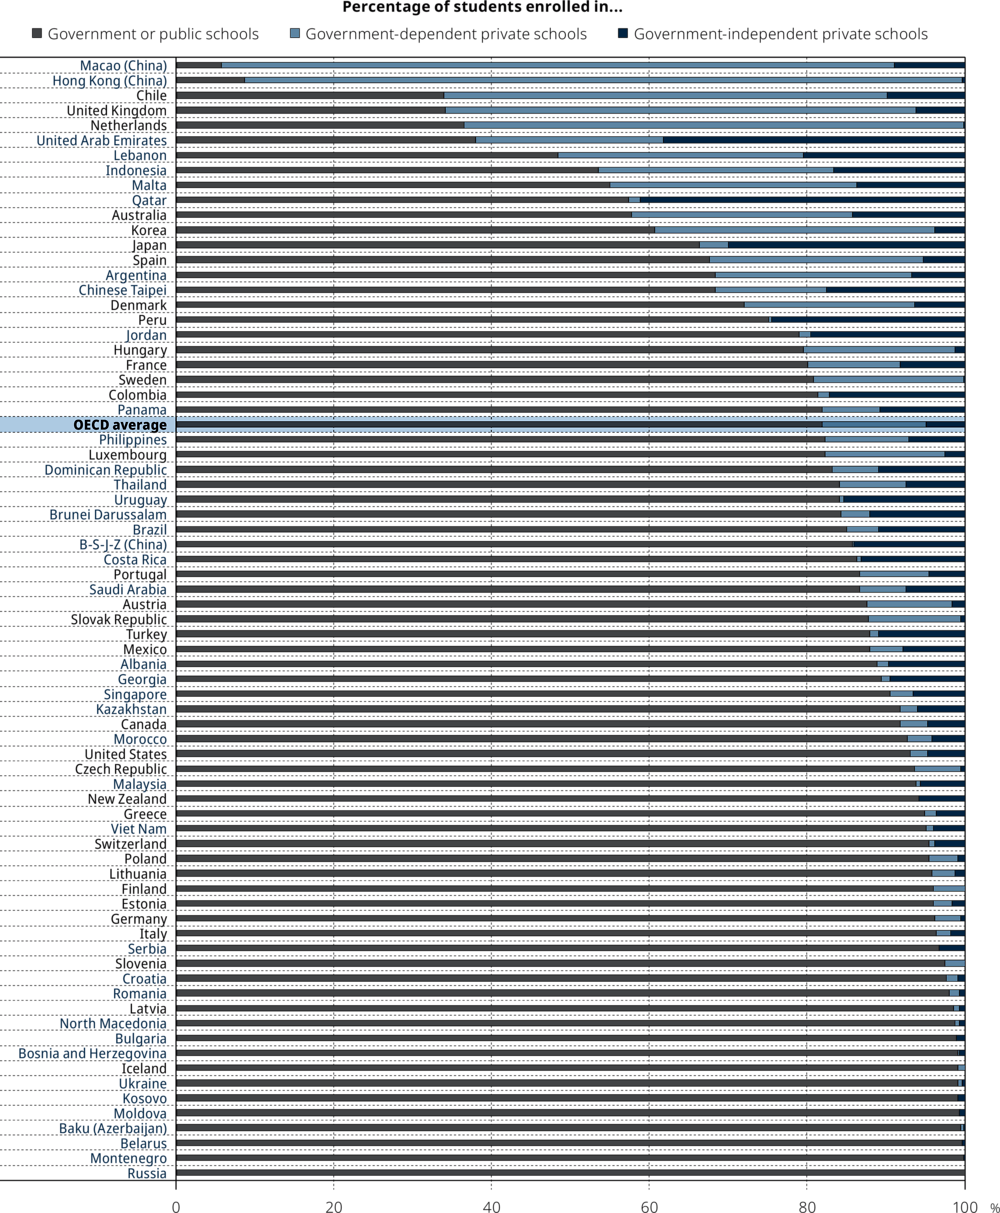
Countries are ranked in ascending order of the percentage of students enrolled in publicly managed schools.
Source: OECD, PISA 2018 Database, Table V.B1.7.1.
On average across OECD countries, 5% of students were enrolled in private-independent schools (i.e. private schools receiving at least half of their funding from private sources) and 13% of students were enrolled in private-dependent schools (i.e. private schools receiving half or more of their funding from the government) in 2018. Thus, 18% of students, on average across OECD countries, attended a private school (Table V.B1.7.1).
In most countries, the private-independent and the private-dependent school sectors are relatively small. In 55 education systems, 10% of students or less were enrolled in private-independent schools in 2018; in 39 education systems, 5% of students or less attended such schools; in 28 systems less than 2% of students did; and in Finland, Iceland, Norway, the Russian Federation (hereafter “Russia”) and Slovenia, no 15-years-old student attended a government-independent private school. Similarly, in 53 education systems, less than 10% of students attended a private-dependent school, and in some countries and economies, namely Belarus, Bulgaria, Kosovo, the Republic of Moldova, Montenegro, New Zealand, Russia and Serbia, no 15-year-old student attended a private-dependent school (Table V.B1.7.1).
Education systems where larger shares of students attend private schools are typically those in which the government provides substantial funding for private schools to operate. In 17 countries and economies, at least 25% of students were enrolled in the private school sector as a whole in 2018. In 14 of them, at least 20% of 15-year-old students were enrolled in government-dependent private schools, including 5 education systems (Chile, Hong Kong [China], Macao [China], the Netherlands and the United Kingdom) in which more than 50% of students were enrolled in a government-dependent private school (Table V.B1.7.1).
In Japan, Peru, Qatar and the United Arab Emirates at least around 25% of students were enrolled in government-independent private schools in 2018, as were as many as 41% of students in Qatar and 38% of students in the United Arab Emirates. In most of these cases, the large shares of students in private schools was not due to a government policy to provide funding for private schools, but to greater private investment in schools from families (Table V.B1.7.1).
In 53 out of 66 countries and economies with available data, the average socio-economic status of students who attended private schools was more advantaged that that of those who attended public schools (Table V.B1.7.2). Only in Chinese Taipei was the socio-economic profile of public schools more advantaged, on average, than that of private schools. More specifically, in Chinese Taipei, the socio-economic status of students in private-dependent schools was significantly more disadvantaged than that of students in public schools, but private-independent schools and public schools had similar socio-economic profiles (Table V.B1.7.3).
Has enrolment in public and private schools changed across PISA cycles?
On average across OECD countries, the share of students enrolled in public schools remained stable during the past two decades. In 2000, some 83% of students were enrolled public schools – one percentage point more than in 2018.
Despite this average stability, several countries and economies showed changes in the size of the public and private school sectors over time (Table V.B1.7.1)
In 12 out of 43 education systems with comparable data, the share of students in public schools shrank since 2000 (Figure V.7.3). The largest declines in public school enrolment were observed in Hong Kong (China), where almost 9 out of 10 students left the public school sector to enrol in private-dependent schools. In Chile, Hungary and Sweden, between 15% and 20% of students left the public sector since 2000, with a corresponding increase in the private-dependent school sector. In Albania, Luxembourg, the Republic of North Macedonia (hereafter “North Macedonia”), Peru, Portugal and Turkey, the decline in the share of students enrolled in public schools was accompanied by an increase in the share of students enrolled in private-independent schools (Figure V.7.3).
Figure V.7.3. Change between 2000 and 2018 in enrolment in public and private schools
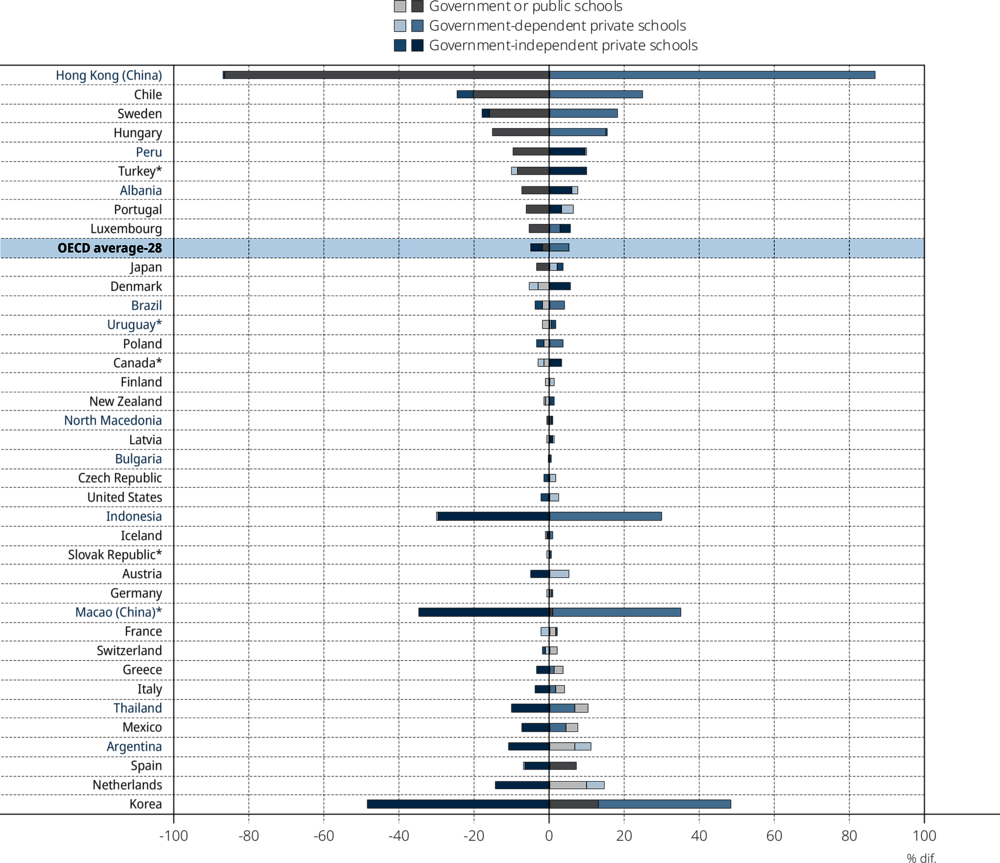
Notes: Countries and economies with a statistically significant change between PISA 2000 (or PISA 2003) and PISA 2018 in the percentage of students enrolled in public, private-dependent or private-independent schools are shown in a darker tone (see Annex A3). PISA 2003 was used for countries and economies (marked with an asterisk) that did not participate in PISA 2000.
OECD average-28 is the arithmetic mean across all OECD countries that participated in both PISA 2000 and PISA 2018 (i.e. all OECD countries excluding Colombia, Estonia, Lithuania, Luxembourg, the Netherlands, the Slovak Republic, Slovenia, Turkey and the United Kingdom).
Countries and economies are ranked in ascending order of the percentage-point difference between PISA 2000 or PISA 2003 and PISA 2018 in the percentage of students enrolled in public schools.
Source: OECD, PISA 2018 Database, Table V.B1.7.1.
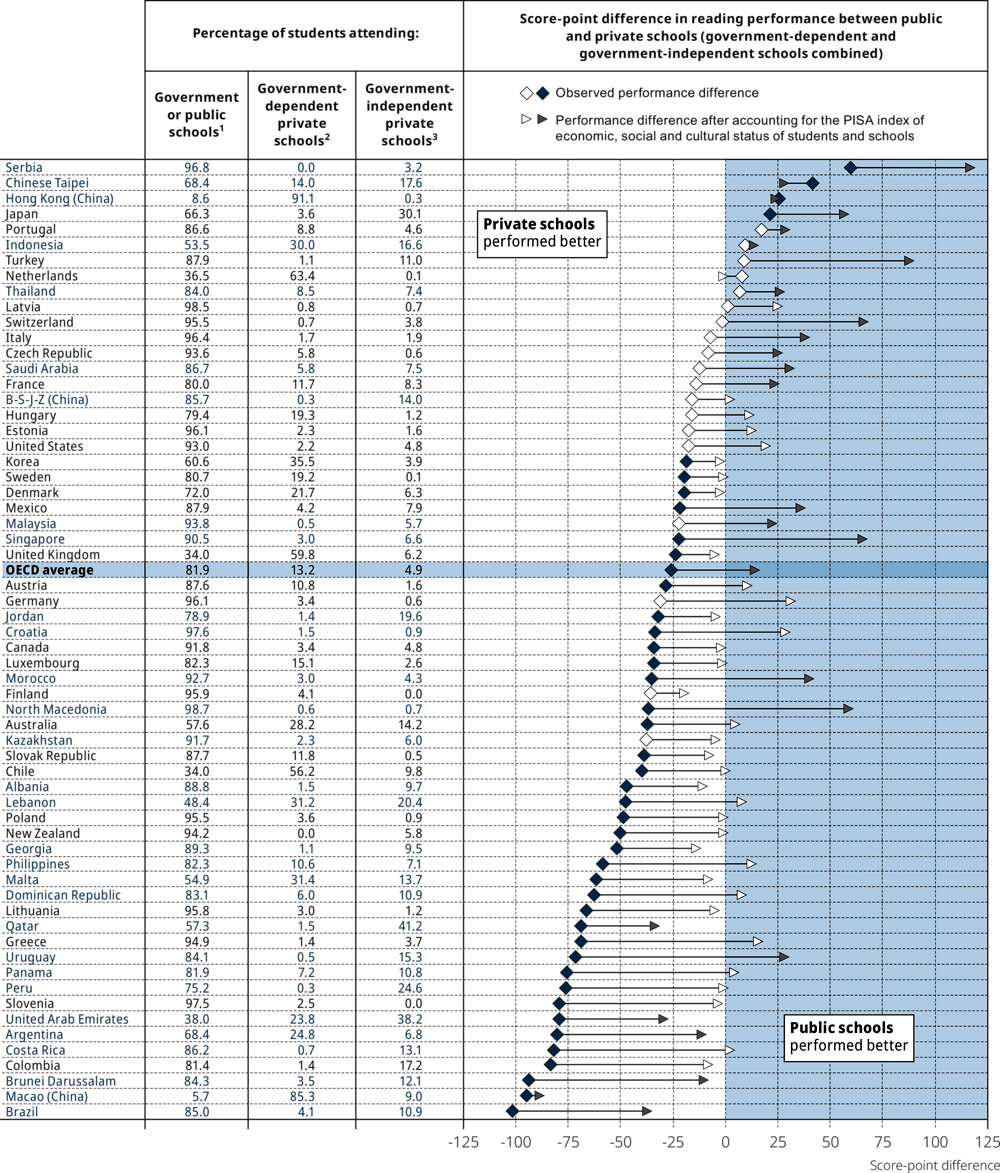
Figure V.7.4. Reading performance in public and private schools
Difference in reading score between students in public schools and students in private schools (private-dependent and private-independent combined
1. Schools that are directly controlled or managed by: a public education authority or agency, or a government agency directly or a governing body, most of whose members are either appointed by a public authority or elected by public franchise.
2. Schools that receive 50% or more of their core funding (i.e. funding that supports the basic educational services of the institution) from government agencies.
3. Schools that receive less than 50% of their core funding (i.e. funding that supports the basic educational services of the institution) from government agencies.
Notes: White symbols represent differences that are not statistically significant (see Annex A3). This analysis is restricted to schools with the modal ISCED level for 15-year-old students. Countries and economies are ranked in descending order of the score-point difference in reading performance between public and private schools (govern-ment-dependent and government-independent private schools combined).
Sources: OECD, PISA 2018 Database, Tables V.B1.7.1 and V.B1.7.4.
By contrast, in Korea and Spain the share of students in public schools increased as the share of students in private-independent schools decreased. In Macao (China), public school enrolment increased by a small margin, but the most significant trend in this economy was a large increase in the share of private-dependent schools concurrent with a decrease in the share of students in private-independent schools (Figure V.7.3).
In some countries, the share of private-dependent schools grew while that of private-independent schools declined or vice versa. In Brazil, Greece, Iceland, Indonesia, Italy, Mexico, Norway, Poland and Thailand, the share of students in private-dependent schools increased without a decline in the share of public schools. In the Netherlands and North Macedonia, the share of students in private-independent schools increased without a decline in the share of students attending public schools (Table V.B1.7.1).
The large differences in socio-economic profile between private and public schools did not change since 2003, nor since 2015, on average across OECD countries (Table V.B1.7.2).
Student performance in public and private schools
On average across OECD countries and in 40 education systems, students in private schools (government-dependent and government-independent combined) scored higher in reading than students in public schools (the “raw” difference, i.e. before accounting for socio-economic profile) (Table V.B1.7.4). Across these 40 education systems, the raw score-point difference in favour of students in private schools ranged from 19 points in Korea to 102 points in Brazil. By contrast, the raw score-point difference in reading favoured public schools in Hong Kong (China), Japan, Serbia and Chinese Taipei (Table V.B1.7.4).
However, after accounting for students’ and schools’ socio-economic profile, reading scores were higher in public schools than in private schools, on average across OECD countries (a 14 score-point difference in favour of public schools) and in 20 education systems. Across these 20 systems, the score-point difference in favour of public school students, after accounting for students’ and schools’ socio-economic profile, ranged from 13 points in Indonesia to 117 points in Serbia. By contrast, in six education systems, students in private schools scored higher than students in public schools, after accounting for socio-economic profile (Table V.B1.7.4).
When compared with public schools, private-dependent schools scored higher than private-independent schools, after accounting for students’ and schools’ socio-economic profile. On average across OECD countries, students in private-dependent schools scored 6 points lower than students in public schools, whereas students in private-independent schools scored 23 points lower than students in public schools, after accounting for students’ and schools’ socio-economic profile (Table V.B1.7.5 and Table V.B1.7.6).
School-choice policies
Competition for students between schools
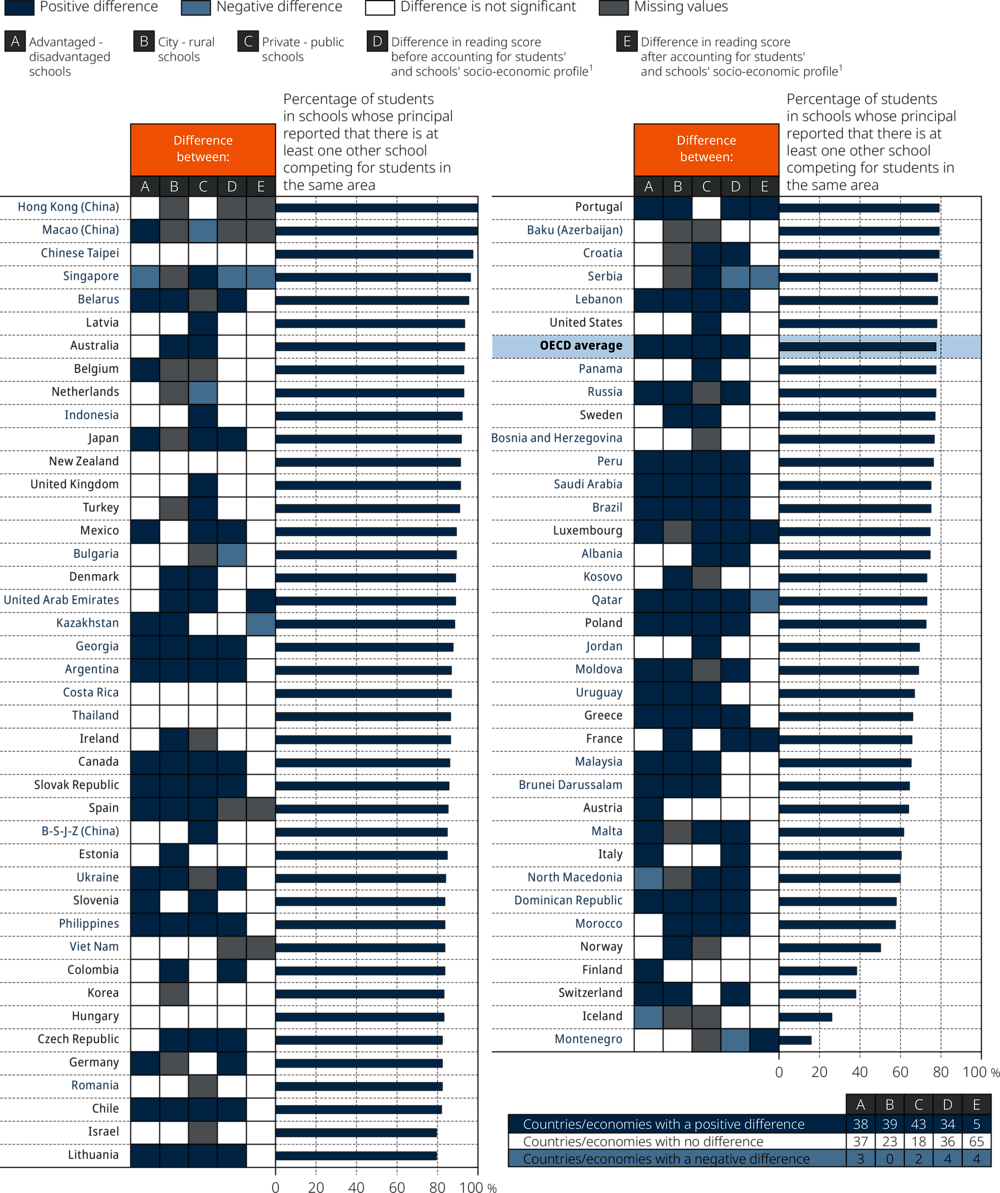
Availability of different school options is common across the countries and economies that participated in PISA 2018. On average across OECD countries, 78% of students attended a school whose principal reported that there is at least one other school in the same area that students can attend; 63% of students attended a school whose principal reported that there are at least two other schools competing for students. In 59 countries and economies, at least one in two students attended a school that competed with two or more other schools in the same area. Competition with two or more schools was most common in six East Asian education systems (Hong Kong [China], Indonesia, Japan, Macao [China], Singapore and Chinese Taipei), Australia, Belarus and the Netherlands. By contrast, it was least common in three northern European countries (Finland, Iceland and Norway) and in Montenegro, Morocco and Switzerland (Table V.B1.7.7).
As shown in Figure V.7.5, the share of students in schools whose principal reported that one or more schools in the same area compete for students was larger in socio-economically advantaged schools (85% of students) than in disadvantaged schools (72% of students), in urban schools (87% of students) than in rural schools (53% of students), and in private schools (89% of students) than in public schools (76% of students), on average across OECD countries (Table V.B1.7.8).
Figure V.7.5. School competition, school characteristics and reading performance
1. This analysis is restricted to schools with the modal ISCED level for 15-year-old students.
Countries and economies are ranked in descending order of the percentage of students in schools whose principal reported that there is at least one other school competing for students in the same area.
Source: OECD, PISA 2018 Database, Table V.B1.7.8.
A small increase in the availability of options for school, and perhaps competition, was observed between 2006 and 2018, on average across OECD countries. The share of students in schools with two or more competing schools in the same area grew by four percentage points, and the share of students in schools with no competing schools in the area decreased by three percentage points (Table V.B1.7.7).
These average trends, however, mask some heterogeneity in national trends in school competition since 2006. Increases in the share of students in schools that compete with two or more schools were statistically significant in 18 countries and economies, and larger than 20 percentage points in Brazil, Qatar, Romania, Slovenia and Turkey. By contrast, Finland, Israel, Italy, Montenegro and the Slovak Republic moved towards less school competition during the period (Table V.B1.7.7).
Similar to what was found when comparing student performance in public and private schools, in most countries, and on average across OECD countries, school competition was associated with higher reading scores, before accounting for socio-economic disparities; but this difference disappeared after accounting for students’ and schools’ socio-economic profile. Only in France, Luxembourg, Montenegro, Portugal and the United Arab Emirates were reading scores higher amongst students in schools that compete with one or more schools in the area, relative to students in schools that do not compete with other schools. By contrast, in Kazakhstan, Qatar, Serbia and Singapore, students in schools that do not compete with other schools performed better in reading (Table V.B1.7.8).
How the prevalence of private schools and school-choice policies are related to differences in performance and equity in education across countries/economies (system-level analysis)
This section examines whether measures of private schools and school choice are related to education outcomes at the system level. As shown in Figure V.7.6, two education outcomes are considered: mean performance in reading and equity in reading performance.
Figure V.7.6. Relationship between measures of private schools, school choice, and student performance and equity
Correlation coefficients between two relevant measures
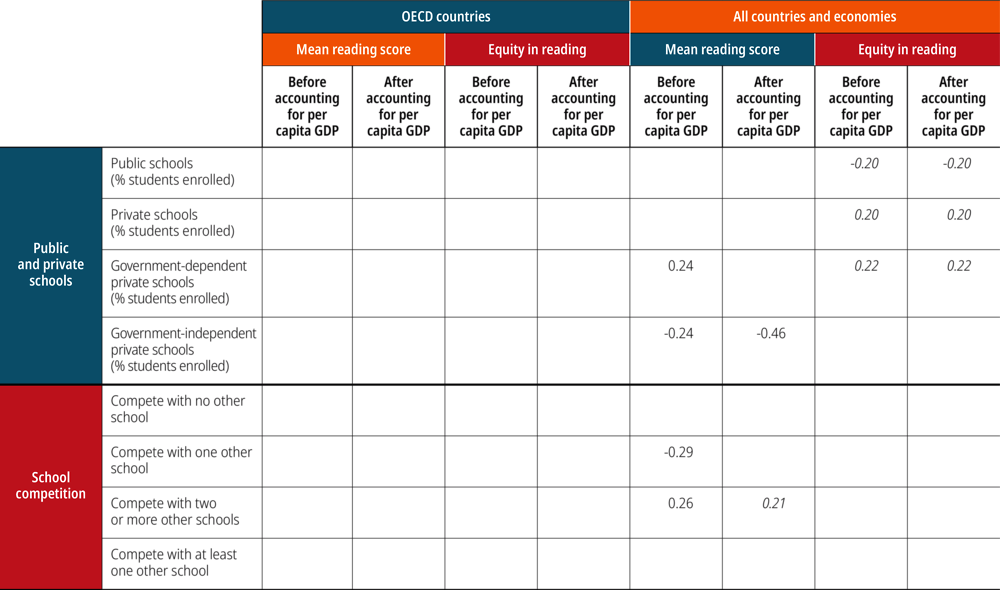
Notes: Correlation coefficients range from -1.00 (i.e. a perfect negative linear association) to +1.00 (i.e. a perfect positive linear association). When a correlation coefficient is 0, there is no linear relationship between the two measures.
Only statistically significant coefficients are shown. Values that are statistically significant at the 10% level (p < 0.10) are in italics. All other values are statistically significant at the 5% level (p < 0.05).
Source: OECD, PISA 2018 Database, Table V.B1.7.9.
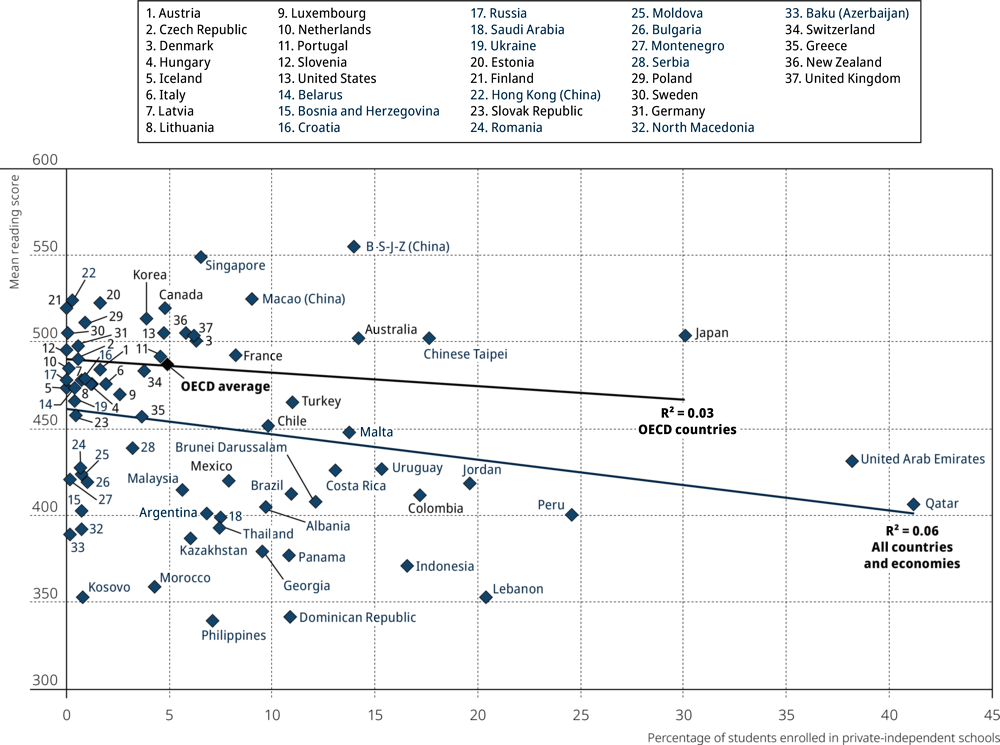
At the system level, across all countries and economies, school systems with larger shares of students in private-independent schools tended to show lower mean performance in reading (r = -0.24). After accounting for per capita GDP, the coefficient and partial correlation was -0.46. Figure V.7.7 shows that Qatar and the United Arab Emirates were two extreme cases. After excluding these cases, the correlation became non-significant at the 5% level, but remained significant at the 10% (r = -0.22) level, while the partial correlation was -0.29. A correlation between higher enrolment in private-independent schools and lower mean performance was not observed across OECD countries.
Figure V.7.7. Students enrolled in private-independent schools and mean reading performance
No clear system-level patterns were observed in the relationships between various indicators of school competition, on the one hand, and performance and equity in reading performance, on the other.
References
[1] Adamson, F., B. Astrand and L. Darling-Hammond (eds.) (2016), Global education reform : how privatization and public investment influence education outcomes, Routledge.
[3] Chakrabarti, R. and P. Peterson (2009), School choice international : exploring public-private partnerships, MIT Press.
[2] Forsey, M., S. Davies and G. Walford (eds.) (2008), The globalisation of school choice?, Symposium Books, https://doi.org/10.15730/books.70 (accessed on 14 January 2020).
[9] Goldring, E. and K. Phillips (2008), “Parent preferences and parent choices: the public–private decision about school choice”, Journal of Education Policy, doi: 10.1080/02680930801987844, pp. 209-230, http://dx.doi.org/10.1080/02680930801987844.
[5] Hoxby, C. (2002), “School Choice and School Productivity (or Could School Choice be a Tide that Lifts All Boats?)”, NBER Working Papers.
[7] Hsieh, C. and M. Urquiola (2006), “The effects of generalized school choice on achievement and stratification: Evidence from Chile’s voucher program”, Journal of Public Economics, Vol. 90/8-9, pp. 1477-1503, http://dx.doi.org/10.1016/J.JPUBECO.2005.11.002.
[4] Koinzer, T., R. Nikolai and F. Waldow (2017), Private schools and school choice in compulsory education: Global change and national challenge, Springer Fachmedien Wiesbaden, http://dx.doi.org/10.1007/978-3-658-17104-9.
[12] Kosunen, S. et al. (2016), “School Choice to Lower Secondary Schools and Mechanisms of Segregation in Urban Finland”, Urban Education, doi: 10.1177/0042085916666933, p. 0042085916666933, http://dx.doi.org/10.1177/0042085916666933.
[11] Plank, D. (2010), “The Globalisation of School Choice? edited by Martin Forsey, Scott Davies, and Geoffrey Walford School Choice International: Exploring Public‐Private Partnerships edited by Rajashri Chakrabarti and Paul E. Peterson”, Comparative Education Review, doi: 10.1086/650710, pp. 142-145, http://dx.doi.org/10.1086/650710.
[10] Rowe, E. and C. Lubienski (2017), “Shopping for schools or shopping for peers: public schools and catchment area segregation”, Journal of Education Policy, doi: 10.1080/02680939.2016.1263363, pp. 340-356, http://dx.doi.org/10.1080/02680939.2016.1263363.
[8] Schneider, M., G. Elacqua and J. Buckley (2006), “School choice in Chile: Is it class or the classroom?”, Journal of Policy Analysis and Management, Vol. 25/3, pp. 577-601, http://dx.doi.org/10.1002/pam.20192.
[6] Urquiola, M. (2016), “Competition Among Schools: Traditional Public and Private Schools”, in Handbook of the Economics of Education, Elsevier, http://dx.doi.org/10.1016/B978-0-444-63459-7.00004-X.
