This chapter describes how students are selected and sorted into different programmes or tracks, both between and within schools. It discusses the age at which students are first tracked and the types of programmes into which they are tracked (general or vocational). Grouping students by ability, both between and within classes, is also examined. These policies are then related to student performance and equity in the education system.
PISA 2018 Results (Volume V)

Chapter 3. Sorting and selecting students between and within schools
Abstract
Horizontal stratification refers to the policies and practices used to select and sort students who are enrolled in the same grade or education level into different instructional programmes, schools or ability groups. As with the vertical stratification practices examined in Chapter 2, horizontal stratification policies aim to manage students’ heterogeneity in their interests and academic performance, allowing teachers and schools to work with students who have similar levels of knowledge or paces of learning. However, research warns that horizontal stratification can have unintended consequences, especially for socio-economically disadvantaged students, because sorting and grouping processes tend to be socio-economically, not just academically, selective (Dupriez, Dumay and Vause, 2008[1]; Gamoran and Berends, 1987[2]; Gerber and Cheung, 2008[3]; Gibbons and Telhaj, 2007[4]; Glaesser and Cooper, 2010[5]).
As examined in this chapter, there are two main types of horizontal stratification: that which occurs between schools or instructional programmes and that which occurs within schools (Figure V.3.1).
Figure V.3.1. Horizontal stratification as covered in PISA 2018
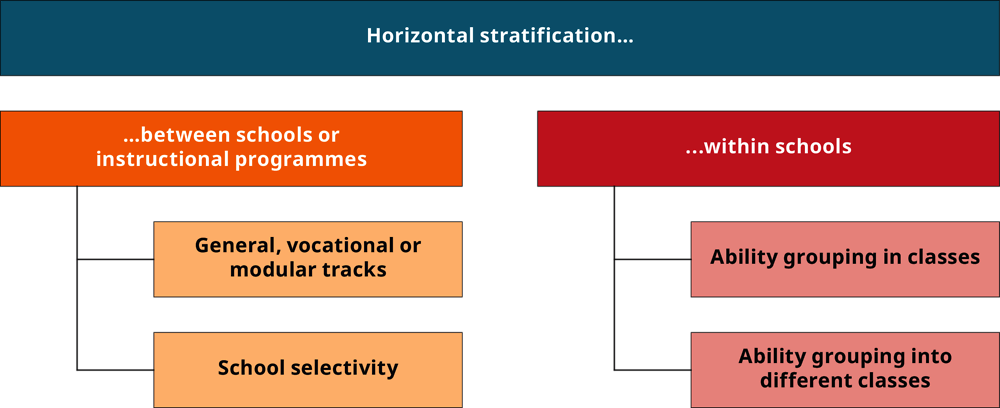
In secondary education, the most common form of horizontal stratification between schools, typically known as tracking, consists of sorting students into different instructional programmes. In education systems that use instructional tracking, some students choose or are selected into academically more demanding programmes, which focus on the general skills required for post-secondary education, while other students choose or are selected for vocational or technical programmes, which focus on the practical skills useful in the labour market (LeTendre, Hofer and Shimizu, 2003[6]; Oakes, 1985[7]; Perry and Southwell, 2014[8]). The age at which students are first tracked and the number of different instructional programmes available to students are amongst the features of tracking policies that have been shown to relate to students’ learning outcomes (Van de Werfhorst and Mijs, 2010[9]; Oakes Jeanne, 1990[10]; Hanushek and Wossmann, 2006[11]; OECD, 2016[12]).
School selectivity, whereby schools consider academic or non-academic factors when admitting students, is another way of allocating students to schools discussed in this chapter.
In addition, the chapter examines grouping students according to their academic ability within schools, which might occur in two ways: grouping students into different classes or grouping them in the same class.
In some school systems, the distinction between public and private schools is also considered to be a form of horizontal stratification (Marteleto et al., 2012[13]; Torche, 2005[14]). This volume examines issues regarding private schools and school-choice policies in Chapter 7.
What the data tell us
In PISA 2018, education systems with a larger number of education programmes available to 15-year-olds generally showed lower mean performance in reading and less equity in reading performance.
On average across OECD countries, students in general programmes scored almost 30 points higher in reading than those in vocational programmes, after accounting for students’ and schools’ socio-economic profile. At the system level, across OECD countries, school systems with larger shares of students in general programmes generally showed greater equity in reading performance, even after accounting for per capita GDP.
Students in academically selective schools scored about five points higher in reading than students in non-selective schools, on average across OECD countries, after accounting for students’ and schools’ socio-economic profile. At the system level, across OECD countries, the prevalence of academic selectivity was correlated with less equity in reading performance, even after accounting for per capita GDP. In addition, between PISA 2009 and PISA 2018, equity in education tended to improve in OECD countries where the prevalence of academic selectivity decreased.
On average across OECD countries, students in schools that group students by ability in their classes for all or some classes scored three points lower in reading than students in schools that do not group students in this way, after accounting for students’ and schools’ socio-economic profile.
Instructional programmes available to 15-year-olds and age at first selection
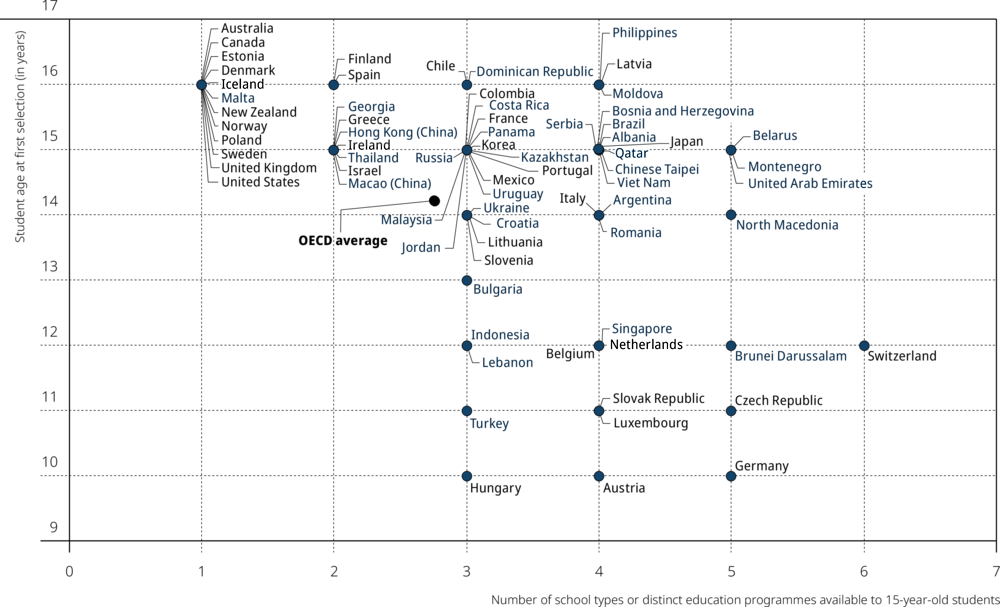
Through its system-level questionnaire, PISA 2018 asked countries to provide a list of the school types or distinct education programmes available to 15-year-old students. Across countries and economies that participated in PISA 2018, the number of distinct education programmes available to 15-year-old students in 2018 ranged from a single (one) programme (in 13 education systems) to six different programmes (in Switzerland and Peru) (Figure V.3.2 and Table B3.3.3). Most frequently, education systems offered three (23 countries and economies) or four (20 countries and economies) instructional programmes to their 15-year-old students.
Figure V.3.2. Education programmes available to 15-year-olds and students’ age at first selection
In 31 education systems, students are first selected into these programmes when they are 15 years old. In 19 education systems, the age at first selection is 16 years; in 8 education systems, it is 14 years; and in 15 systems, the age at first selection is 13 years. Countries that select students at the youngest age are Austria, Germany and Hungary (10 years), and the Czech Republic, the Slovak Republic and Turkey (11 years) (Tables II.B1.2.3 and B3.3.3).
Figure V.3.2 shows that countries with fewer academic programmes available to 15-year-olds tend to select students into different programmes at an older age. All countries that participated in PISA 2018 that offer only one academic programme to 15-year-olds (Australia, Canada, Denmark, Estonia, Iceland, Malta, New Zealand, Norway, Poland, Sweden, the United Kingdom and the United States) select students into programmes at the age of 16 or later. Similarly, all countries that offer two academic programmes select students into programmes at the age of 15 or later. By contrast, countries with more academic programmes available to 15-year-olds tend to track students at an earlier age. The extreme case is Switzerland, which offers six academic programmes and sorts students into these programmes as early as age 12. (Some cantons of Switzerland have implemented reforms since 2006 to delay the age at first selection from 10 or 11 to 12 years.1) Brunei Darussalam, the Czech Republic and Germany all offer five academic programmes; the age at first selection in Brunei Darussalam is 12 years, in the Czech Republic it is 11 years, and in Germany, 10 years. Other countries, such as Belarus, Montenegro and the United Arab Emirates, which also offer five academic programmes to 15-year-olds, do not select their students until age 15, or until age 14 in the Republic of North Macedonia (hereafter “North Macedonia”) (Tables II.B1.2.3 and B3.3.3).
Vocational programmes or schools
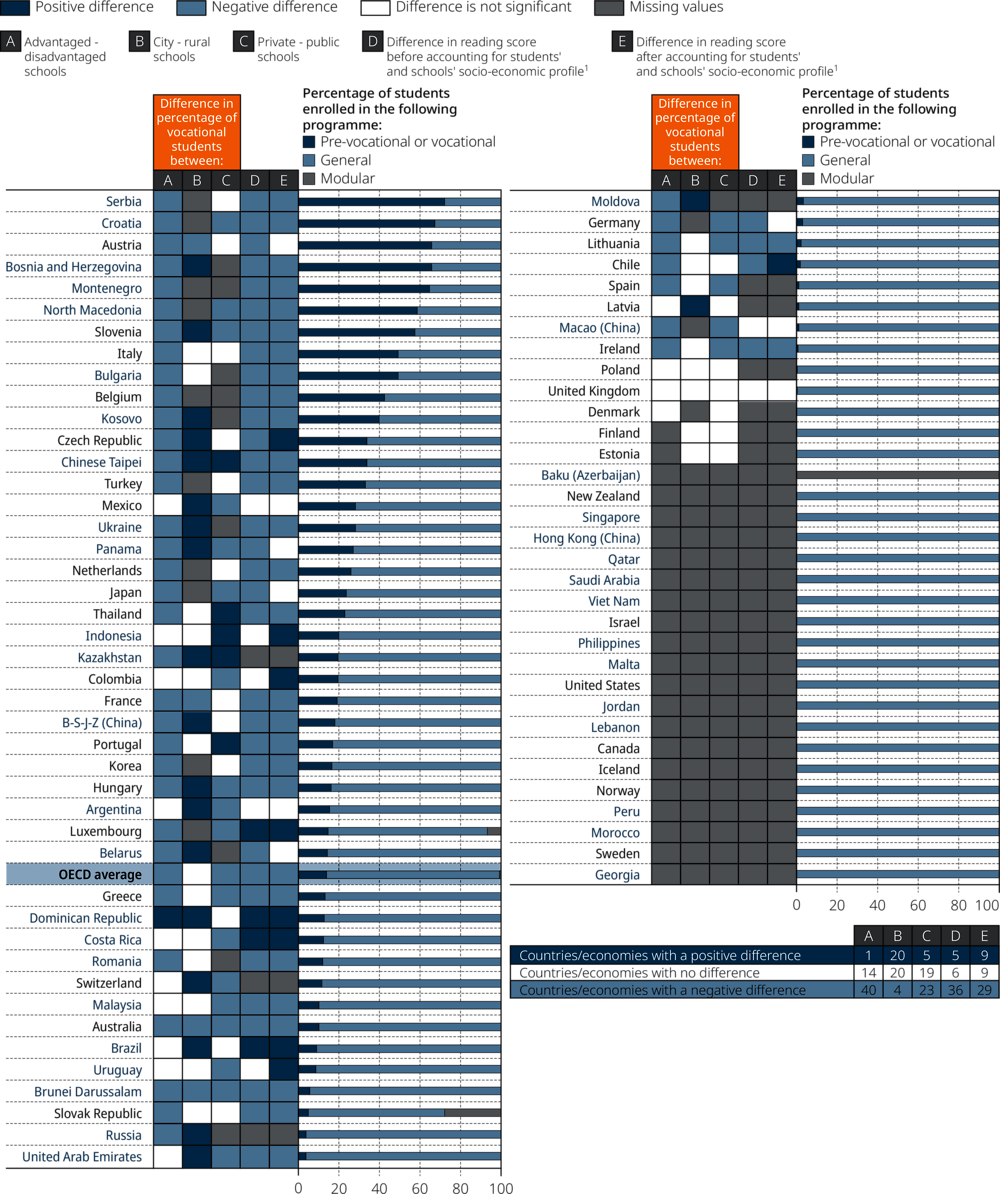
On average across OECD countries, 14% of 15-year-old students were enrolled in a vocational (including pre-vocational) programme or school in 2018. In 18 countries and economies, more than one in four students were enrolled in a vocational programme, and in 7 countries (Austria, Bosnia and Herzegovina, Croatia, Montenegro, North Macedonia, Serbia and Slovenia), more than one in two students were enrolled in a vocational programme. By contrast, in 35 countries and economies, fewer than 1 in 20 students attended a vocational programme, and in 20 countries and economies no student was enrolled in a vocational programme (Figure V.3.3).
Figure V.3.3. Enrolment in instructional programmes, school characteristics and reading performance
1. This analysis is restricted to schools with the modal ISCED level for 15-year-old students.
Countries and economies are ranked in descending order of the percentage of students in schools whose principal reported that students are enrolled in a pre-vocational or vocational programme.
Sources: OECD, PISA 2018 Database, Table V.B1.3.1 and Table V.B1.3.2.
A smaller share of students attended a vocational programme in 2018 than in 2009, when 15% of students were enrolled in a vocational programme, on average across OECD countries (Table V.B1.3.1). The share of students enrolled in a vocational programme decreased between 2009 and 2018 in 12 countries and economies. The largest decreases were observed in the Slovak Republic (by 36 percentage points), Romania (by 10 percentage points), and Turkey and Korea (by 8 percentage points in both countries). However, in 15 countries and economies the share of students enrolled in a vocational programme increased during this period. The largest increases in vocational enrolment were observed in Panama (by 27 percentage points), Brazil, Bulgaria, France and Kazakhstan (by around 10 percentage points in these four countries).
Students enrolled in vocational programmes were markedly more likely to attend a socio-economically disadvantaged school. On average across OECD countries, 22% of students in disadvantaged schools were enrolled in a vocational programme, whereas only 2% of students in advantaged schools were. The same pattern was observed in most countries and economies, except the Dominican Republic, where the percentage of students enrolled in a vocational track was greater in advantaged schools than in disadvantaged schools (Table V.B1.3.2).
The proportion of 15-year-old students enrolled in a vocational programme is larger amongst those attending upper secondary school than amongst those in lower secondary school. On average across OECD countries in 2018, 24% of 15-year-old students attending upper secondary school, and 4% of students in lower secondary school, were enrolled in a vocational programme (Table V.B1.3.3). In Austria, Bosnia and Herzegovina, the Czech Republic and Serbia, over 70% of 15-year-old students attending upper secondary school were enrolled in a vocational programme.
There were large differences in reading performance between students in vocational and those in academic programmes (Figure V.3.3). On average across OECD countries, students in academic programmes scored almost 70 points higher in reading than those in vocational programmes, before accounting for socio-economic factors, and almost 30 points higher after accounting for students’ and schools’ socio-economic profile (Table V.B1.3.2). The difference in reading performance between students in vocational and general programmes, after accounting for socio-economic factors, was around 70 score points or more in Brunei Darussalam, France, Greece, Ireland,2 the Netherlands and the United Arab Emirates. In 10 countries/economies, students in vocational programmes scored higher in reading than those in general programmes, after accounting for students’ and schools’ socio-economic profile.
School selectivity
In 2018, PISA asked school principals whether they consider a range of factors when admitting students to their school. The factors cited were: the student’s record of academic performance (including placement tests); recommendation of feeder schools; parents’ endorsement of the instructional or religious philosophy of the school; whether the student requires or is interested in a special programme; whether preference is given to family members of current or former students; and residence in a particular area.
On average across OECD countries, the most common forms of school selectivity were admitting students based on their area of residence, and admitting students based on students’ need or interest in a special programme offered by the school (almost 60% of students attended schools that consider such factors) (Figure V.3.4). By contrast, granting admission to school based on parents’ endorsement of the instructional or religious philosophy of the school was the least common (31% of students attended schools that consider this factor), on average across OECD countries (Table V.B1.3.4).
Figure V.3.4. School selectivity and reading performance
Change in reading score when the principal reported that the factors are "sometimes" or "always" considered for admission to school; OECD average

1. The socio-economic profile is measured by the PISA index of economic, social and cultural status.
Notes: Statistically significant differences are marked in a darker tone (see Annex A3). The percentage of students in schools where the factors are "sometimes" or "always" considered for admission to school is indicated above each factor.
Sources: OECD, PISA 2018 Database, Table V.B1.3.4 and Table V.B1.3.6.
Some 51% of students were enrolled in schools that always (33%) or sometimes (19%) consider students’ record of academic performance when admitting students, on average across OECD countries. Using academic performance as a criterion for school admission (i.e. academic selectivity) was universal or almost universal in Bulgaria, Croatia, Hong Kong (China), Japan, Kosovo, Macao (China), Singapore, Thailand and Viet Nam. By contrast, only around 20% of students or less in Chile, Finland, Greece, Iceland, Norway, Portugal, Spain and Sweden attended academically selective schools (Table V.B1.3.4).
Students in upper secondary schools were more likely to be enrolled in academically selective schools than students in lower secondary schools. On average across OECD countries, 66% of students in upper secondary schools were enrolled in academically selective schools, while 38% of students in lower secondary schools were enrolled in such schools (Table V.B1.3.5). Amongst the countries and economies that participated in PISA 2018, there were no education systems where more students in academically selective schools were enrolled in lower secondary school than in upper secondary school, and in 26 countries/economies the difference was not statistically significant.
A larger share of students in 2018 than in 2009 were enrolled in schools that, when admitting students, always consider records of academic performance (a three percentage-point increase over the period) and always give preference to family members of current or former students (a four percentage-point increase), on average across OECD countries (Table V.B1.3.4). Using recommendations from feeder schools as a criterion for admission was less prevalent in 2018 than in 2009, on average across OECD countries.
Most admissions criteria were not associated with higher student performance, especially after accounting for socio-economic factors – with the single exception of academic selectivity (Figure V.3.4). On average across OECD countries, students in academically selective schools scored about 13 points higher in reading than students in non-selective schools. However, after accounting for students’ and schools’ socio-economic profile, the average difference between students in academically selective and those in non-selective schools was five score points. Students in academically selective schools in Austria, Hong Kong (China), Kosovo, Lebanon, Macao (China) and Turkey outperformed their peers in non-selective schools by the widest margin (more than 20 points), after accounting for socio-economic factors (Table V.B1.3.6).
Ability grouping in school
Ability grouping in school involves placing students into different classrooms or in small instructional groups in a class based on their initial achievement or skill levels (Steenbergen-Hu, Makel and Olszewski-Kubilius, 2016[15]). Some research has shown that ability grouping has a positive impact on the mathematics achievement of elementary school pupils (Matthews, Ritchotte and McBee, 2013[16]). Other evidence suggests that ability grouping might not be as beneficial for struggling students if instruction time is not put to good use (Hong et al., 2012[17]) or if those students are less likely to learn from and develop social networks with their higher-performing peers when they are not sitting in the same classroom (Lucas, 2001[18]).
Ability grouping within classes
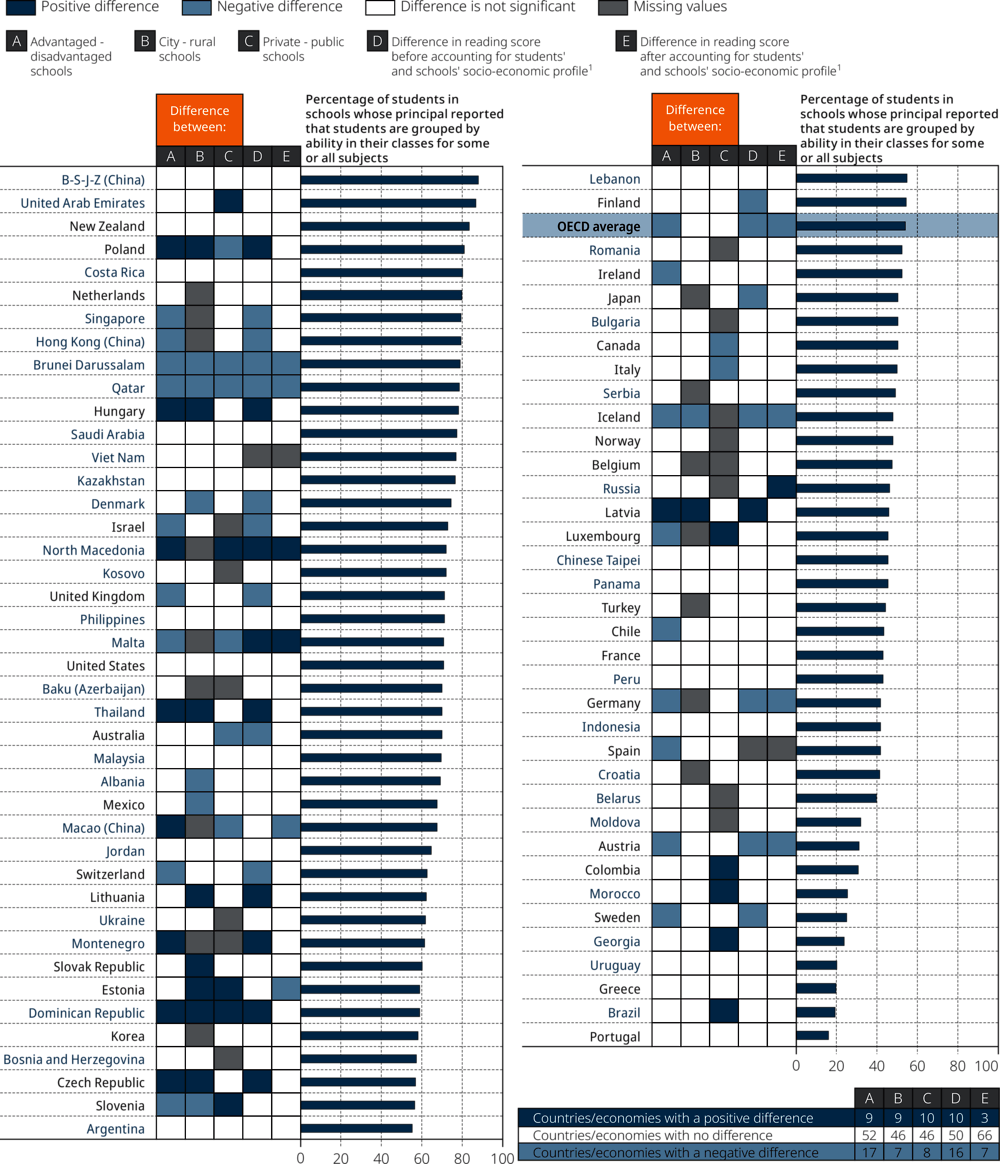
Grouping students by ability in their classes is the most prevalent form of horizontal stratification within schools. On average across OECD countries in 2018, 54% of students were in schools that group students by ability in their classes for some subjects (49%) or for all subjects (5%) (Figure V.3.5). At least 80% of students in Beijing, Shanghai, Jiangsu and Zhejiang (China), Costa Rica, Hong Kong (China), the Netherlands, New Zealand, Poland, Singapore and the United Arab Emirates attended schools that group students by ability in classes. By contrast, about 25% of students or less in Brazil, Georgia, Greece, Morocco, Portugal, Sweden and Uruguay attended such schools (Table V.B1.3.7).
Figure V.3.5. Ability grouping in classes, school characteristics and reading performance
1. This analysis is restricted to schools with the modal ISCED level for 15-year-old students.
Countries and economies are ranked in descending order of the percentage of students in schools whose principal reported that students are grouped by ability in their classes for some or all subjects.
Source: OECD, PISA 2018 Database, Table V.B1.3.9.
Ability grouping in classes is somewhat more common in socio-economically disadvantaged than in advantaged schools. On average across OECD countries in 2018, 57% of students in disadvantaged schools were grouped by ability in their classes, compared to 50% of students in advantaged schools. In 18 countries and economies, the incidence of ability grouping in classes was greater in disadvantaged schools than in advantaged schools. For example, in the United Kingdom, 96% of students in disadvantaged schools were grouped by ability in their classes while 45% of students in advantaged schools were – a 51 percentage-point difference. But in nine countries and economies, advantaged schools grouped students in classes more often. For example, in Macao (China), 93% of students in advantaged schools were grouped by ability in their classes while 40% of students in disadvantaged schools were (a 52 percentage-point difference) (Table V.B1.3.9).
Students in schools that group students by ability in their classes (for some or all subjects) scored six points lower in reading than students in schools that do not group students in this way, on average across OECD countries (Figure V.3.5). Half of this difference in performance can be accounted for by students’ and schools’ socio-economic profile. When holding these factors constant, students in schools that group students by ability in their classes scored three points lower in reading, on average across OECD countries. In seven countries and economies, ability grouping in classes was associated with lower reading scores after accounting for socio-economic factors, but the opposite was observed in three countries.
The negative difference in reading scores was larger when schools group students in their classes for all subjects. On average across OECD countries, students in schools that group students by ability in their classes for all subjects scored 20 points lower in reading, and 8 points lower after accounting for students’ and schools’ socio-economic profile (Table V.B1.3.11).
Ability grouping into different classes
Another way schools handle student heterogeneity is by grouping students by ability into different classes.
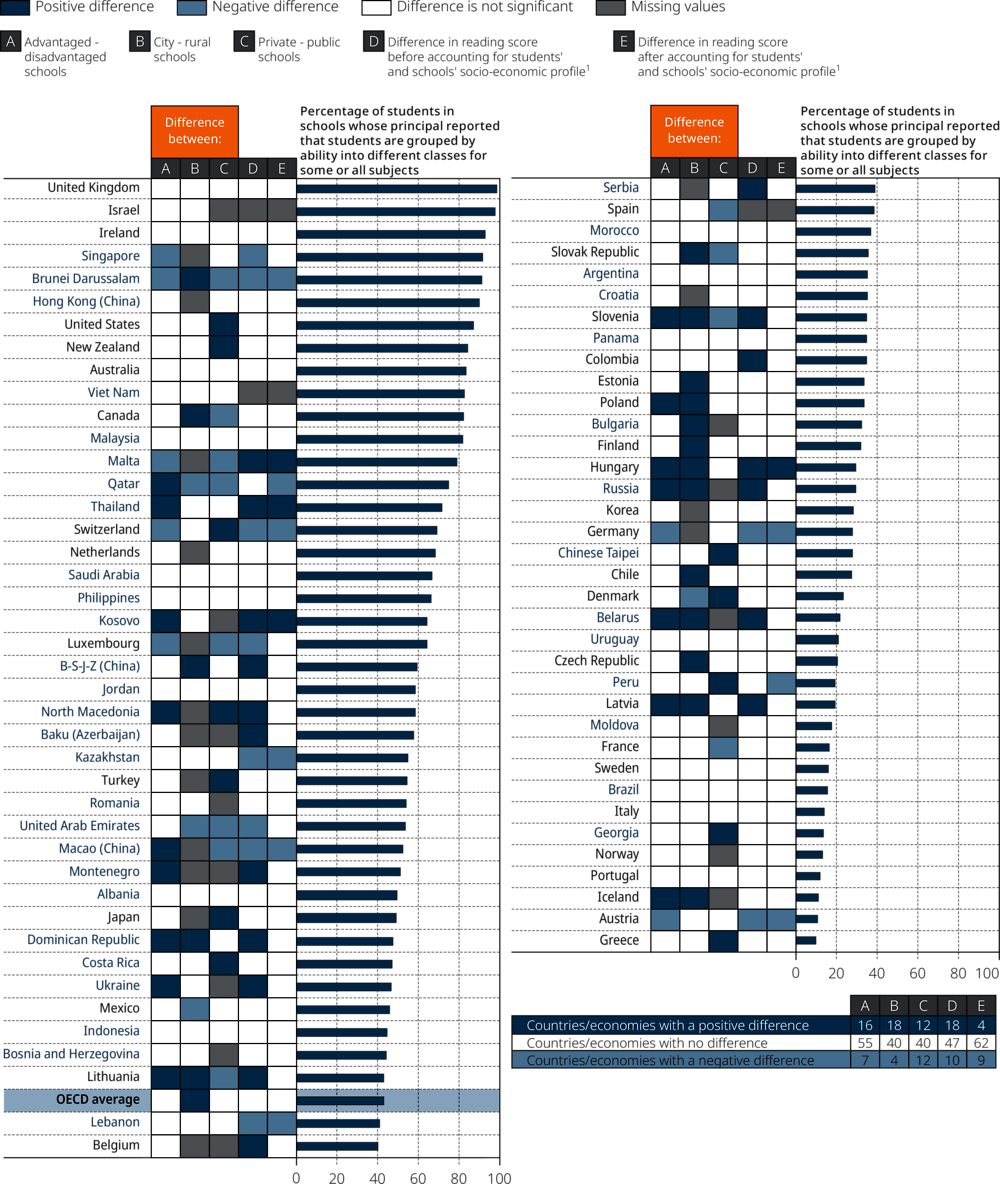
On average across OECD countries in 2018, 43% of students attended schools where students are grouped by ability into different classes for all subjects (8%) or some subjects (35%). The greatest incidence of this kind of grouping was observed in Brunei Darussalam, Hong Kong (China), Ireland, Israel, Singapore and United Kingdom. In these countries and economies, at least 9 in 10 students attended a school that groups students for all or some subjects. By contrast, in Austria, Greece, Iceland, Norway and Portugal, only 1 in 10 students attended a school that groups students, by ability, into different classes (Table V.B1.3.7).
The incidence of ability grouping into different classes was not associated with schools’ socio-economic profile, on average across OECD countries. However, in 16 countries and economies there was more ability grouping into different classes in advantaged schools, and in 8 countries and economies the incidence was greater in disadvantaged schools (Table V.B1.3.10).
In addition, ability grouping into different classes was more frequently observed in urban than in rural schools, on average across OECD countries, but it was practiced similarly across public and private schools, and across lower and upper secondary schools (Table V.B1.3.10).
Differences in performance between students who attended schools that practice and those that do not practice ability grouping into different classes (for some or all subjects) tended to be small (Figure V.3.6). In most countries, and on average across OECD countries, such ability grouping was not associated with differences in students’ reading scores. However, in nine countries and economies, students in schools that group students by ability into different classes scored lower than students in schools that do not practice this type of ability grouping, while in six other countries they scored higher, after accounting for other factors.
Figure V.3.6. Ability grouping into different classes, school characteristics and reading performance
1. This analysis is restricted to schools with the modal ISCED level for 15-year-old students.
Countries and economies are ranked in descending order of the percentage of students in schools whose principal reported that students are grouped by ability into different classes for some or all subjects.
Source: OECD, PISA 2018 Database, Table V.B1.3.10.
The negative difference in reading scores was larger when schools group students into different classes for all subjects, as opposed to some subjects. On average across OECD countries, students in schools that group students by ability into different classes for all subjects scored nine points lower in reading, and five points lower after accounting for students’ and schools’ socio-economic profile (Table V.B1.3.11).
How horizontal stratification is related to differences in performance and equity in education across countries/economies (system-level analysis)
This section examines whether measures of horizontal stratification are related to education outcomes at the system level. Two education outcomes are considered: mean performance in reading and equity in reading performance. As in previous PISA reports, equity in reading performance is measured by the percentage of variation in reading performance accounted for by differences in students’ socio-economic status; the smaller the variation in performance explained by socio-economic status, the greater the equity in performance (OECD, 2019[19]; OECD, 2018[20]).
Figure V.3.7 shows system-level correlation coefficients between measures of horizontal stratification on the one hand, and reading performance and equity in reading performance on the other. Correlational analyses were conducted separately for OECD countries, and for all countries and economies that participated in PISA 2018. In addition, correlations were computed before and after accounting for per capita GDP, to account for the level of economic development of a country/economy.
Figure V.3.7 [1/2]. Horizontal stratification, student performance and equity
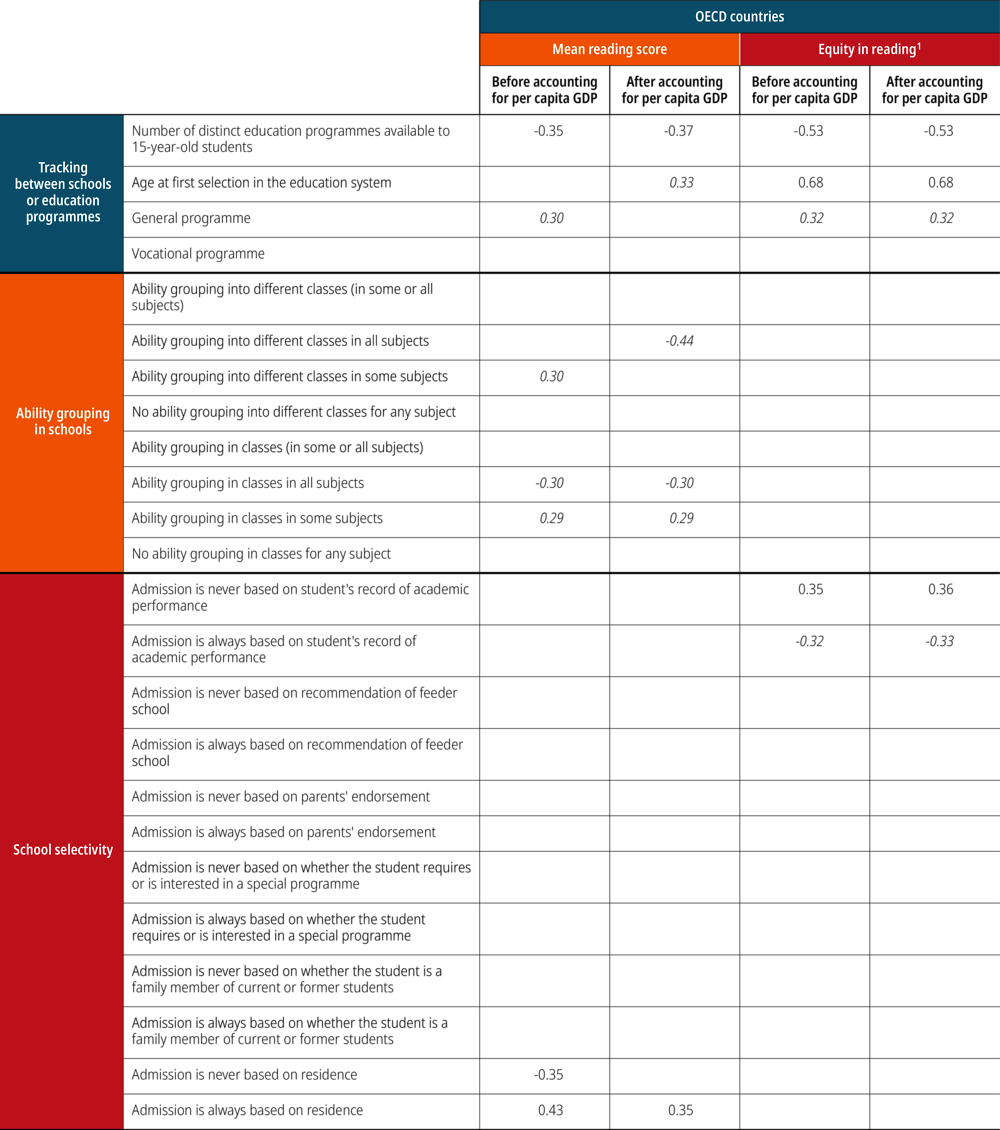
1. The percentage of variance in student performance explained by the PISA index of economic, social and cultural status was used as measure of inequity in performance. In a first step, the correlation coefficients between measures of horizontal stratification and inequity were computed. In a second step, the sign of the correlation coefficients were reversed (i.e. multiplied by -1) to simplify reporting (i.e. report correlation with equity instead of with inequity).
Notes: Only statistically significant coefficients are shown. Values that are statistically significant at the 10% level (p < 0.10) are in italics. All other values are statistically significant at the 5% level (p < 0.05).
Correlation coefficients range from -1.00 (i.e. a perfect negative linear association) to +1.00 (i.e. a perfect positive linear association). When a correlation coefficient is 0, there is no linear relationship between the two measures.
Source: OECD, PISA 2018 Database, Table V.B1.3.12.
Figure V.3.7 [2/2]. Horizontal stratification, student performance and equity
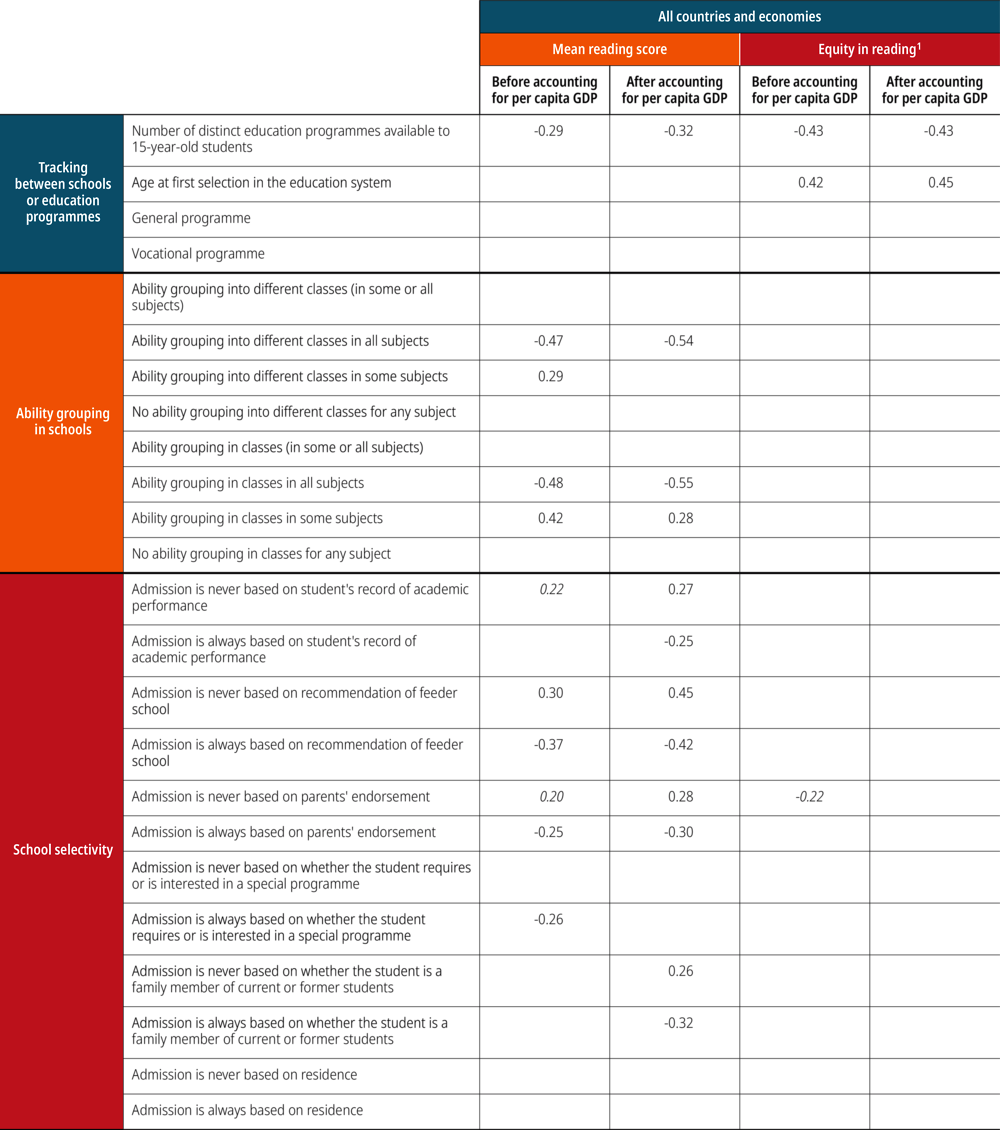
1. The percentage of variance in student performance explained by the PISA index of economic, social and cultural status was used as measure of inequity in performance. In a first step, the correlation coefficients between measures of horizontal stratification and inequity were computed. In a second step, the sign of the correlation coefficients were reversed (i.e. multiplied by -1) to simplify reporting (i.e. report correlation with equity instead of with inequity).
Notes: Only statistically significant coefficients are shown. Values that are statistically significant at the 10% level (p < 0.10) are in italics. All other values are statistically significant at the 5% level (p < 0.05).
Correlation coefficients range from -1.00 (i.e. a perfect negative linear association) to +1.00 (i.e. a perfect positive linear association). When a correlation coefficient is 0, there is no linear relationship between the two measures.
Source: OECD, PISA 2018 Database, Table V.B1.3.12.
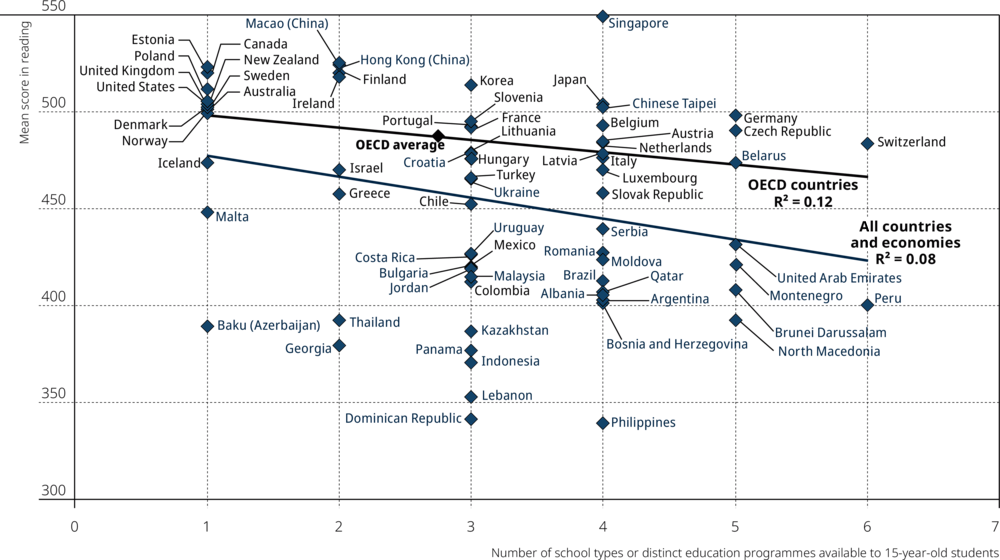
Countries with fewer programmes available to 15-year-olds generally showed higher average performance in reading in PISA 2018 across OECD countries. There was a negative correlation between the number of education programmes and mean performance in reading, even after accounting for per capita GDP, across OECD countries, and across all countries and economies (Figure V.3.7). As shown in Figure V.3.8, 12% of the variation in mean reading performance across OECD countries could be accounted for by variations in the number of academic programmes available to 15-year-olds.
Figure V.3.8. Academic programmes available to 15-year-olds and mean score in reading
Of the 15 countries and economies with mean scores in reading higher than 500 points, 9 countries (Australia, Canada, Denmark, Estonia, New Zealand, Poland, Sweden, the United Kingdom and the United States) offer only one instructional programme to 15-year-olds;3 4 countries/economies (Finland,4 Hong Kong [China], Ireland and Macao [China]) offer only two instructional programmes. The exceptions to this finding were Korea, with three programmes, and Japan and Singapore, each of which offer four programmes.
However, the countries with the lowest mean scores in reading are heterogeneous in terms of the intensity of their tracking system. Two of the lowest-performing countries in PISA 2018 offer six (Peru) or five (North Macedonia) instructional tracks, but some offer only one (Baku [Azerbaijan]) or two (Georgia and Thailand), and many offer three (the Dominican Republic, Indonesia, Kazakhstan, Lebanon and Panama) or four instructional tracks (Albania, Argentina, Bosnia and Herzegovina, the Philippines and Qatar).
Offering fewer instructional tracks was correlated not only with student performance but also, and more strongly, with greater equity in performance, as shown in Figure V.3.7. After accounting for per capita GDP, a correlation was observed between the number of instructional tracks and equity in performance in reading, mathematics and science (Table V.B1.3.12).
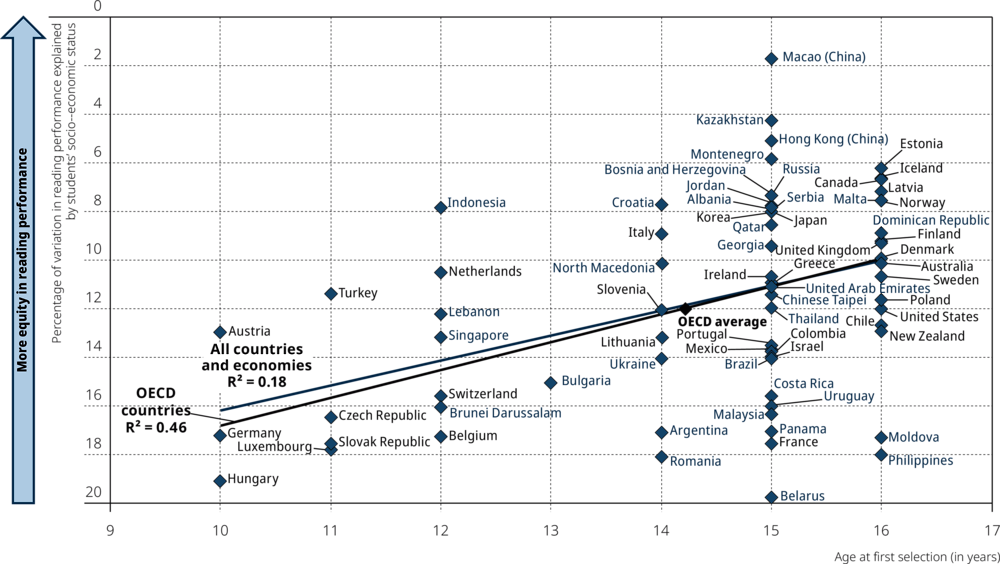
Students’ age at first selection into different programmes was not consistently correlated to mean reading performance. However, selecting students into different programmes at an earlier age was correlated with less equity in reading performance, even after accounting for per capita GDP, across OECD countries, and across all countries/economies (Figure V.3.9). As shown in Figure V.3.9, differences in the age at first selection accounted for 46% of the differences in equity in reading performance across OECD countries, and for almost 20% of the differences in equity in reading performance across all countries and economies.5
Figure V.3.9. Age at first selection and equity in reading performance
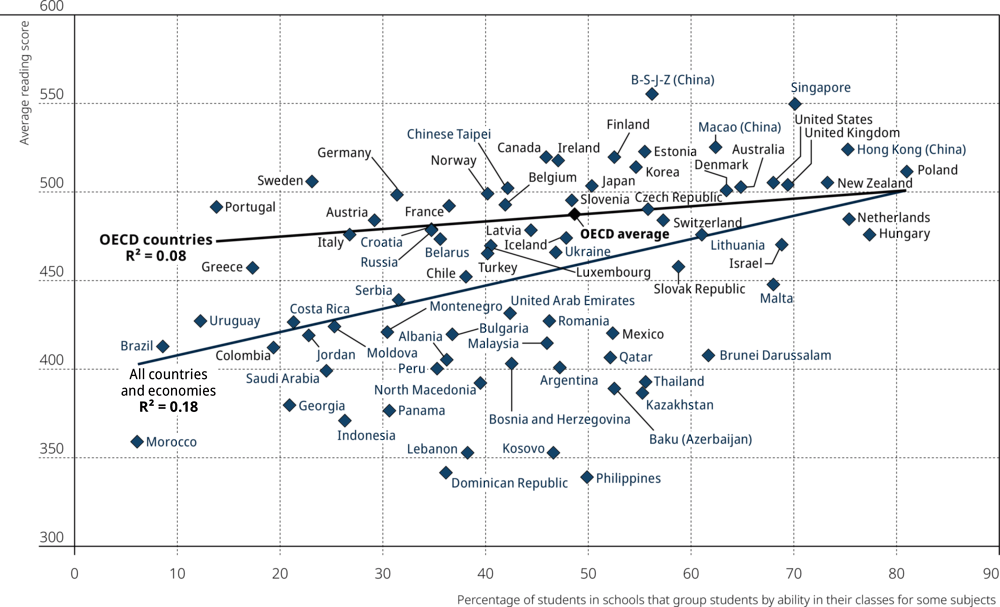
In PISA 2018, the system-level correlation between ability grouping within class and mean reading performance had a different sign depending on whether this kind of ability grouping was implemented for some subjects or for all subjects. On the one hand, the percentage of students in schools that group students by ability in class for some subjects was positively correlated with mean performance in reading, before and after accounting for per capita GDP, across OECD countries, and across all participating countries and economies (Figure V.3.7). As shown in Figure V.3.10, 18% of differences in mean reading performance across all countries/economies can be explained by cross-national differences in ability grouping in class for some subjects.6
Figure V.3.10. Ability grouping in classes for some subjects and reading performance
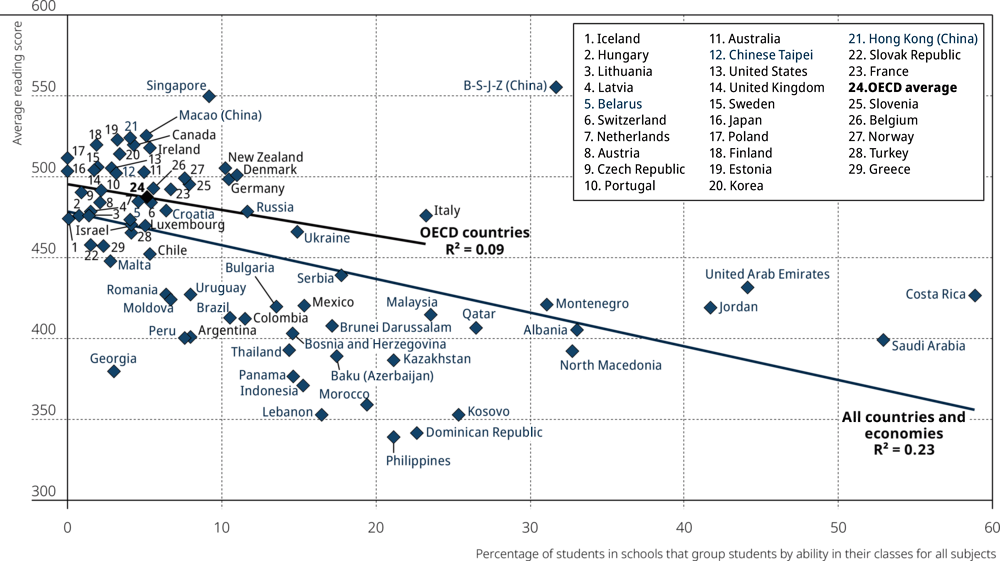
On the other hand, the percentage of students in schools that group students by ability in class for all subjects was negatively correlated with mean performance in reading, before and after accounting for per capita GDP, across OECD countries, and across all participating countries and economies (Figure V.3.7). Figure V.3.11 shows that some 23% of differences in mean reading performance across all countries/economies can be explained by cross-national differences in ability grouping in class for all subjects.7 These findings suggest that the relationship between ability grouping in class and performance may be associated with the way ability grouping is implemented.
Figure V.3.11. Ability grouping in classes for all subjects and reading performance
The percentage of students enrolled in general or vocational programmes was not consistently correlated with higher mean reading performance (Figure V.3.7). However, OECD countries with a larger share of students in general programmes tended to show greater equity in reading performance. Across OECD countries, there was a positive correlation between the share of students enrolled in a general programme and equity in performance, even after accounting for per capita GDP8 (Figure V.3.7). The correlation was not statistically significant across all countries and economies.
Figure V.3.12. Change between 2009 and 2018 in academic selectivity and equity in reading performance
Similarly, academic selectivity was not consistently correlated with mean student performance. However, in 2018, OECD countries with fewer academically selective schools generally showed greater equity in student performance. Across OECD countries, the percentage of students in schools that never consider students’ record of academic performance for admission was positively correlated with equity in reading performance, before and after accounting for per capita GDP9 (Figure V.3.7). The correlation across all countries and economies was not statistically significant. Furthermore, across OECD countries, changes between 2009 and 2018 in the percentage of students attending a school where admission is never based on the student’s record of academic performance were positively correlated with changes in equity in reading.10 This means that equity in education tended to improve in countries where the prevalence of academic selectivity decreased (Table V.B1.3.13).
References
[1] Dupriez, V., X. Dumay and A. Vause (2008), “How Do School Systems Manage Pupils’ Heterogeneity?”, Comparative Education Review, Vol. 52/2, pp. 245-273, http://dx.doi.org/10.1086/528764.
[2] Gamoran, A. and M. Berends (1987), “The Effects of Stratification in Secondary Schools: Synthesis of Survey and Ethnographic Research”, Review of Educational Research, Vol. 57/4, pp. 415-435, http://dx.doi.org/10.3102/00346543057004415.
[3] Gerber, T. and S. Cheung (2008), “Horizontal Stratification in Postsecondary Education: Forms, Explanations, and Implications”, Annual Review of Sociology, Vol. 34/1, pp. 299-318, http://dx.doi.org/10.1146/annurev.soc.34.040507.134604.
[4] Gibbons, S. and S. Telhaj (2007), “Are Schools Drifting Apart? Intake Stratification in English Secondary Schools”, Urban Studies, doi: 10.1080/00420980701302346, pp. 1281-1305, http://dx.doi.org/10.1080/00420980701302346.
[5] Glaesser, J. and B. Cooper (2010), “Selectivity and Flexibility in the German Secondary School System: A Configurational Analysis of Recent Data from the German Socio-Economic Panel”, European Sociological Review, Vol. 27/5, pp. 570-585, http://dx.doi.org/10.1093/esr/jcq026.
[11] Hanushek, E. and L. Wossmann (2006), “Does Educational Tracking Affect Performance and Inequality? Differences- in-Differences Evidence Across Countries*”, The Economic Journal, Vol. 116/510, pp. C63-C76, http://dx.doi.org/10.1111/j.1468-0297.2006.01076.x.
[17] Hong, G. et al. (2012), “Differential Effects of Literacy Instruction Time and Homogeneous Ability Grouping in Kindergarten Classrooms”, Educational Evaluation and Policy Analysis, Vol. 34/1, pp. 69-88, http://dx.doi.org/10.3102/0162373711424206.
[6] LeTendre, G., B. Hofer and H. Shimizu (2003), “What Is Tracking? Cultural Expectations in the United States, Germany, and Japan”, American Educational Research Journal, Vol. 40/1, pp. 43-89, http://dx.doi.org/10.3102/00028312040001043.
[18] Lucas, S. (2001), “Effectively Maintained Inequality: Education Transitions, Track Mobility, and Social Background Effects”, American Journal of Sociology, Vol. 106/6, pp. 1642-1690, http://dx.doi.org/10.1086/321300.
[13] Marteleto, L. et al. (2012), “Educational Inequalities among Latin American Adolescents: Continuities and Changes over the 1980s, 1990s and 2000s”, Research in Social Stratification and Mobility, Vol. 30/3, pp. 352-375, http://dx.doi.org/10.1016/J.RSSM.2011.12.003.
[16] Matthews, M., J. Ritchotte and M. McBee (2013), “Effects of schoolwide cluster grouping and within-class ability grouping on elementary school students’ academic achievement growth”, High Ability Studies, Vol. 24/2, pp. 81-97, http://dx.doi.org/10.1080/13598139.2013.846251.
[10] Oakes Jeanne (1990), “Multiplying Inequalities: The Effects of Race, Social Class, and Tracking on Opportunities to Learn Mathematics and Science”, ERIC.
[7] Oakes, J. (1985), Keeping Track: How Schools Structure Inequality, Yale University Press, New Haven.
[19] OECD (2019), PISA 2018 Results (Volume II): Where All Students Can Succeed, PISA, OECD Publishing, Paris, https://dx.doi.org/10.1787/b5fd1b8f-en.
[21] OECD (2018), Education Policy Outlook 2018: Putting Student Learning at the Centre, OECD Publishing, Paris, https://dx.doi.org/10.1787/9789264301528-en.
[20] OECD (2018), Equity in Education: Breaking Down Barriers to Social Mobility, PISA, OECD Publishing, Paris, https://dx.doi.org/10.1787/9789264073234-en.
[12] OECD (2016), PISA 2015 Results (Volume II): Policies and Practices for Successful Schools, PISA, OECD Publishing, Paris, https://dx.doi.org/10.1787/9789264267510-en.
[8] Perry, L. and L. Southwell (2014), “Access to academic curriculum in Australian secondary schools: A case study of a highly marketised education system”, Journal of Education Policy, Vol. 29/4, pp. 467-485, http://dx.doi.org/10.1080/02680939.2013.846414.
[22] Santiago, P. et al. (2017), OECD Reviews of School Resources: Chile 2017, OECD Reviews of School Resources, OECD Publishing, Paris, https://dx.doi.org/10.1787/9789264285637-en.
[15] Steenbergen-Hu, S., M. Makel and P. Olszewski-Kubilius (2016), “What One Hundred Years of Research Says About the Effects of Ability Grouping and Acceleration on K–12 Students’ Academic Achievement: Findings of Two Second-Order Meta-Analyses”, Review of Educational Research, doi: 10.3102/0034654316675417, pp. 849-899, http://dx.doi.org/10.3102/0034654316675417.
[14] Torche, F. (2005), “Privatization Reform and Inequality of Educational Opportunity: The Case of Chile”, Sociology of Education, Vol. 78/4, pp. 316-343, http://dx.doi.org/10.1177/003804070507800403.
[9] Van de Werfhorst, H. and J. Mijs (2010), “Achievement Inequality and the Institutional Structure of Educational Systems: A Comparative Perspective”, Annual Review of Sociology, Vol. 36/1, pp. 407-428, http://dx.doi.org/10.1146/annurev.soc.012809.102538.
Notes
← 1. Source: Switzerland’s PISA system-level data-collection questionnaire.
← 2. In Ireland, only 1% of students in PISA 2018 were enrolled in vocational programmes.
← 3. The correlation between the number of academic programmes and mean reading performance is influenced by these nine countries with a single track and comparatively high performance. If countries with a single academic programme are excluded from the analysis, the correlation is not statistically significant across OECD countries, nor across all countries/economies.
← 4. In Finland, most 15-year-old students attend grade 9, the final grade of lower secondary education (ISCED 2). There is only one programme offered at this education level. Students who are above the modal grade in upper secondary education (ISCED 3) have access to two programmes of different orientation.
← 5. The correlation between the age at selection into different academic programmes and equity in reading performance is not influenced by extreme cases. After countries/economies whose age at selection is 16 years are excluded from the analysis, the correlation is still statistically significant across OECD countries and across all countries/economies. Similarly, after countries/economies whose age at selection is 10 years are excluded from the analysis, the correlation is still statistically significant across OECD countries and across all countries/economies.
← 6. The correlation between the percentage of students in schools that group students by ability in their classes for some subjects and mean reading performance is not influenced by extreme cases. After excluding countries/economies where less than 15% of students are enrolled in schools that group students by ability in their classes for some subjects (i.e. Costa Rica, Jordan, Saudi Arabia and the United Arab Emirates), the strength of the relationship does not change much across OECD countries (R2 = 0.10) nor across all countries/economies (R2 = 0.17).
← 7. The correlation between the percentage of students in schools that group students by ability in their classes for all subjects and mean reading performance is not influenced by extreme cases. After excluding countries/economies where more than 40% of students are enrolled in schools that group students by ability in their classes for all subjects (i.e. Brazil, Morocco, Portugal and Uruguay), the strength of the relationship does not change across OECD countries (R2 = 0.10) and increases across all countries/economies (R2 = 0.30).
← 8. After excluding low-performing countries/economies (i.e. those whose mean reading score was lower than 413 points), across OECD countries, the strength of the correlation between the percentage of students enrolled in a general programme and equity in reading performance remained unaltered (after exclusion, correlation coefficient = 0.31; partial correlation coefficient after accounting for per capita GDP = 0.32). Across all countries/economies, the association remained not statistically significant after excluding low-performing countries/economies.
← 9. After excluding low-performing countries/economies (i.e. those whose mean reading score was lower than 413 points), across OECD countries, the strength of the correlation between the percentage of students in schools that never consider a student’s record of academic performance for admission and equity in reading performance remained unaltered (after exclusion, correlation coefficient = 0.35; partial correlation coefficient after accounting for per capita GDP = 0.35). Across all countries/economies, the association remained not statistically significant after excluding low-performing countries/economies.
← 10. The correlation between the change between 2009 and 2018 in academic selectivity and the change in equity in reading performance is not influenced by extreme cases. In Chile, the change in the percentage of students in schools that never consider students’ record of academic performance for admission was noticeably greater than in other countries (it decreased by 49 percentage points). This change might be due to the adoption, in 2015, of Chile’s School Inclusion Law, which forbade public schools and private government-dependent schools from using any form of selection criteria when enrolling students (OECD, 2018[21]) (Santiago et al., 2017[22]). After excluding Chile from the analysis, the correlation across OECD countries strengthened (after exclusion, correlation coefficient = 0.56). Across all countries/economies, the association remained not statistically significant after excluding Chile.
