PISA 2022 Results (Volume I)

Annex B1. Results for countries and economies
Table I.B1.2.1. Mean score and variation in mathematics performance [1/2]

* Caution is required when interpreting estimates because one or more PISA sampling standards were not met (see Reader’s Guide, Annexes A2 and A4).
Note: Values that are statistically significant are indicated in bold (see Annex A3).
Table I.B1.2.1. Mean score and variation in mathematics performance [2/2]

* Caution is required when interpreting estimates because one or more PISA sampling standards were not met (see Reader’s Guide, Annexes A2 and A4).
Note: Values that are statistically significant are indicated in bold (see Annex A3).
Table I.B1.2.2. Mean score and variation in reading performance [1/2]

* Caution is required when interpreting estimates because one or more PISA sampling standards were not met (see Reader’s Guide, Annexes A2 and A4).
** Caution is required when comparing estimates based on PISA 2022 with other countries/economies as a strong linkage to the international PISA reading scale could not be established (see Reader's Guide and Annex A4).
Note: Values that are statistically significant are indicated in bold (see Annex A3).
Table I.B1.2.2. Mean score and variation in reading performance [2/2]

* Caution is required when interpreting estimates because one or more PISA sampling standards were not met (see Reader’s Guide, Annexes A2 and A4).
** Caution is required when comparing estimates based on PISA 2022 with other countries/economies as a strong linkage to the international PISA reading scale could not be established (see Reader's Guide and Annex A4).
Note: Values that are statistically significant are indicated in bold (see Annex A3).
Table I.B1.2.3. Mean score and variation in science performance [1/2]

* Caution is required when interpreting estimates because one or more PISA sampling standards were not met (see Reader’s Guide, Annexes A2 and A4).
Note: Values that are statistically significant are indicated in bold (see Annex A3).
Table I.B1.2.3. Mean score and variation in science performance [2/2]

* Caution is required when interpreting estimates because one or more PISA sampling standards were not met (see Reader’s Guide, Annexes A2 and A4).
Note: Values that are statistically significant are indicated in bold (see Annex A3).
Table I.B1.3.1. Percentage of students at each proficiency level in mathematics [1/2]

* Caution is required when interpreting estimates because one or more PISA sampling standards were not met (see Reader’s Guide, Annexes A2 and A4).
Table I.B1.3.1. Percentage of students at each proficiency level in mathematics [2/2]

* Caution is required when interpreting estimates because one or more PISA sampling standards were not met (see Reader’s Guide, Annexes A2 and A4).
Table I.B1.3.2. Percentage of students at each proficiency level in reading [1/2]

* Caution is required when interpreting estimates because one or more PISA sampling standards were not met (see Reader’s Guide, Annexes A2 and A4).
** Caution is required when comparing estimates based on PISA 2022 with other countries/economies as a strong linkage to the international PISA reading scale could not be established (see Reader's Guide and Annex A4).
Table I.B1.3.2. Percentage of students at each proficiency level in reading [2/2]

* Caution is required when interpreting estimates because one or more PISA sampling standards were not met (see Reader’s Guide, Annexes A2 and A4).
** Caution is required when comparing estimates based on PISA 2022 with other countries/economies as a strong linkage to the international PISA reading scale could not be established (see Reader's Guide and Annex A4).
Table I.B1.3.3. Percentage of students at each proficiency level in science [1/2]

* Caution is required when interpreting estimates because one or more PISA sampling standards were not met (see Reader’s Guide, Annexes A2 and A4).
Table I.B1.3.3. Percentage of students at each proficiency level in science [2/2]

* Caution is required when interpreting estimates because one or more PISA sampling standards were not met (see Reader’s Guide, Annexes A2 and A4).
Table I.B1.4.2. Students' socio-economic status [1/2]

* Caution is required when interpreting estimates because one or more PISA sampling standards were not met (see Reader’s Guide, Annexes A2 and A4).Note: Values that are statistically significant are indicated in bold (see Annex A3).
Table I.B1.4.2. Students' socio-economic status [2/2]

* Caution is required when interpreting estimates because one or more PISA sampling standards were not met (see Reader’s Guide, Annexes A2 and A4).
Note: Values that are statistically significant are indicated in bold (see Annex A3).
Table I.B1.4.3. Socio-economic status and mathematics performance [1/2]

1. ESCS refers to the PISA index of economic, social and cultural status.
2. Resilient students in mathematics are disadvantaged students who scored in the top quarter of performance in mathematics amongst students in their own country.
* Caution is required when interpreting estimates because one or more PISA sampling standards were not met (see Reader’s Guide, Annexes A2 and A4).
Note: Values that are statistically significant are indicated in bold (see Annex A3).
Table I.B1.4.3. Socio-economic status and mathematics performance [2/2]

1. ESCS refers to the PISA index of economic, social and cultural status.
2. Resilient students in mathematics are disadvantaged students who scored in the top quarter of performance in mathematics amongst students in their own country.
* Caution is required when interpreting estimates because one or more PISA sampling standards were not met (see Reader’s Guide, Annexes A2 and A4).
Note: Values that are statistically significant are indicated in bold (see Annex A3).
Table I.B1.4.17. Mathematics performance, by gender [1/6]

* Caution is required when interpreting estimates because one or more PISA sampling standards were not met (see Reader’s Guide, Annexes A2 and A4).
Note: Values that are statistically significant are indicated in bold (see Annex A3).
Table I.B1.4.17. Mathematics performance, by gender [2/6]

* Caution is required when interpreting estimates because one or more PISA sampling standards were not met (see Reader’s Guide, Annexes A2 and A4).
Note: Values that are statistically significant are indicated in bold (see Annex A3).
Table I.B1.4.17. Mathematics performance, by gender [3/6]

* Caution is required when interpreting estimates because one or more PISA sampling standards were not met (see Reader’s Guide, Annexes A2 and A4).
Note: Values that are statistically significant are indicated in bold (see Annex A3).
Table I.B1.4.17. Mathematics performance, by gender [4/6]

* Caution is required when interpreting estimates because one or more PISA sampling standards were not met (see Reader’s Guide, Annexes A2 and A4).
Note: Values that are statistically significant are indicated in bold (see Annex A3).
Table I.B1.4.17. Mathematics performance, by gender [5/6]

* Caution is required when interpreting estimates because one or more PISA sampling standards were not met (see Reader’s Guide, Annexes A2 and A4).
Note: Values that are statistically significant are indicated in bold (see Annex A3).
Table I.B1.4.17. Mathematics performance, by gender [6/6]

* Caution is required when interpreting estimates because one or more PISA sampling standards were not met (see Reader’s Guide, Annexes A2 and A4).
Note: Values that are statistically significant are indicated in bold (see Annex A3).
Table I.B1.5.4. Mean mathematics performance, 2003 through 2022 [1/4]

1. The average decennial trend is the average change, per 10-year period, between the earliest available measurement in PISA and PISA 2022, calculated by a linear regression. The average decennial trend is only computed for countries with comparable data in more than two PISA assessments, over the period considered.
2. Curvilinear trends in performance are computed only for countries with comparable data in more than four PISA assessments. Curvilinear trends are calculated by a regression of performance over both linear and quadratic (squared) terms of the gap between the year of assessment and 2022. The coefficient for the linear term represents the annual rate of change in 2022, while the coefficient for the quadratic term represents the acceleration or deceleration of the change in performance.
* Caution is required when interpreting estimates because one or more PISA sampling standards were not met (see Reader’s Guide, Annexes A2 and A4).
Notes: Values that are statistically significant are indicated in bold (see Annex A3). Costa Rica, Georgia, Malaysia, Malta, Moldova and the United Arab Emirates conducted the PISA 2009 assessment in 2010 as part of PISA 2009+. For Cambodia, Guatemala and Paraguay, results reported under PISA 2018 refer to the results of the PISA for Development assessment, in 2017.
Table I.B1.5.4. Mean mathematics performance, 2003 through 2022 [2/4]
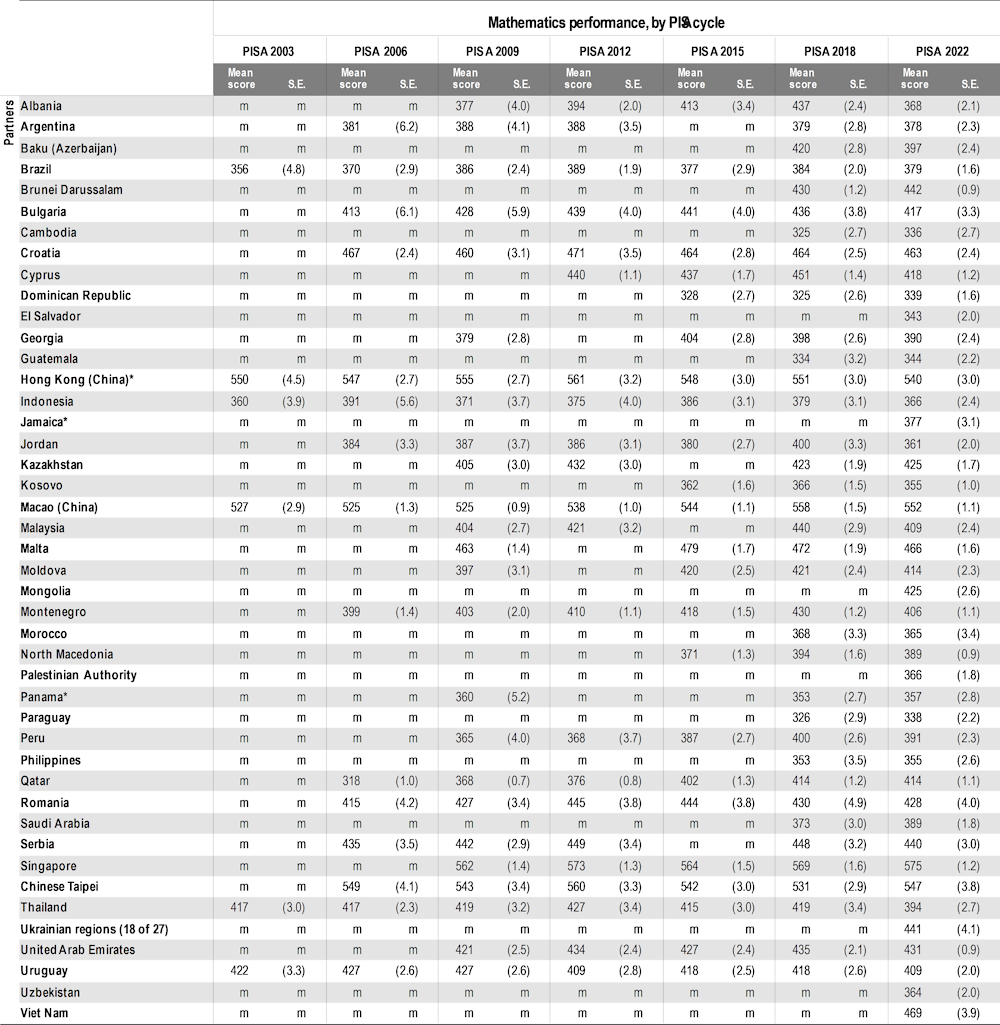
1. The average decennial trend is the average change, per 10-year period, between the earliest available measurement in PISA and PISA 2022, calculated by a linear regression. The average decennial trend is only computed for countries with comparable data in more than two PISA assessments, over the period considered.
2. Curvilinear trends in performance are computed only for countries with comparable data in more than four PISA assessments. Curvilinear trends are calculated by a regression of performance over both linear and quadratic (squared) terms of the gap between the year of assessment and 2022. The coefficient for the linear term represents the annual rate of change in 2022, while the coefficient for the quadratic term represents the acceleration or deceleration of the change in performance.
* Caution is required when interpreting estimates because one or more PISA sampling standards were not met (see Reader’s Guide, Annexes A2 and A4).
Notes: Values that are statistically significant are indicated in bold (see Annex A3). Costa Rica, Georgia, Malaysia, Malta, Moldova and the United Arab Emirates conducted the PISA 2009 assessment in 2010 as part of PISA 2009+. For Cambodia, Guatemala and Paraguay, results reported under PISA 2018 refer to the results of the PISA for Development assessment, in 2017.
Table I.B1.5.4. Mean mathematics performance, 2003 through 2022 [3/4]

1. The average decennial trend is the average change, per 10-year period, between the earliest available measurement in PISA and PISA 2022, calculated by a linear regression. The average decennial trend is only computed for countries with comparable data in more than two PISA assessments, over the period considered.
2. Curvilinear trends in performance are computed only for countries with comparable data in more than four PISA assessments. Curvilinear trends are calculated by a regression of performance over both linear and quadratic (squared) terms of the gap between the year of assessment and 2022. The coefficient for the linear term represents the annual rate of change in 2022, while the coefficient for the quadratic term represents the acceleration or deceleration of the change in performance.
* Caution is required when interpreting estimates because one or more PISA sampling standards were not met (see Reader’s Guide, Annexes A2 and A4).
Notes: Values that are statistically significant are indicated in bold (see Annex A3). Costa Rica, Georgia, Malaysia, Malta, Moldova and the United Arab Emirates conducted the PISA 2009 assessment in 2010 as part of PISA 2009+. For Cambodia, Guatemala and Paraguay, results reported under PISA 2018 refer to the results of the PISA for Development assessment, in 2017.
Table I.B1.5.4. Mean mathematics performance, 2003 through 2022 [4/4]
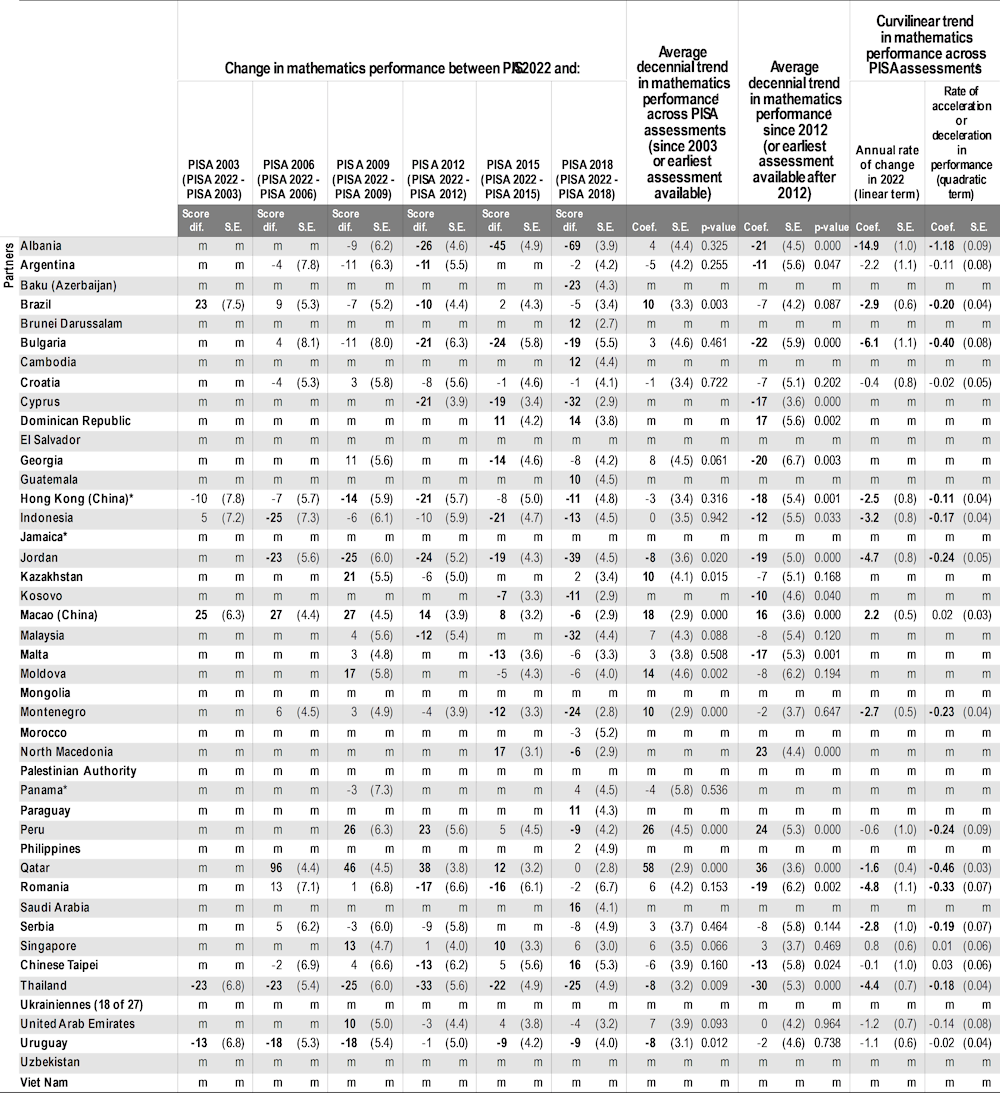
1. The average decennial trend is the average change, per 10-year period, between the earliest available measurement in PISA and PISA 2022, calculated by a linear regression. The average decennial trend is only computed for countries with comparable data in more than two PISA assessments, over the period considered. 2. Curvilinear trends in performance are computed only for countries with comparable data in more than four PISA assessments. Curvilinear trends are calculated by a regression of performance over both linear and quadratic (squared) terms of the gap between the year of assessment and 2022. The coefficient for the linear term represents the annual rate of change in 2022, while the coefficient for the quadratic term represents the acceleration or deceleration of the change in performance. * Caution is required when interpreting estimates because one or more PISA sampling standards were not met (see Reader’s Guide, Annexes A2 and A4). Notes: Values that are statistically significant are indicated in bold (see Annex A3). Costa Rica, Georgia, Malaysia, Malta, Moldova and the United Arab Emirates conducted the PISA 2009 assessment in 2010 as part of PISA 2009+. For Cambodia, Guatemala and Paraguay, results reported under PISA 2018 refer to the results of the PISA for Development assessment, in 2017.
Table I.B1.5.5. Mean reading performance, 2000 through 2022 [1/6]
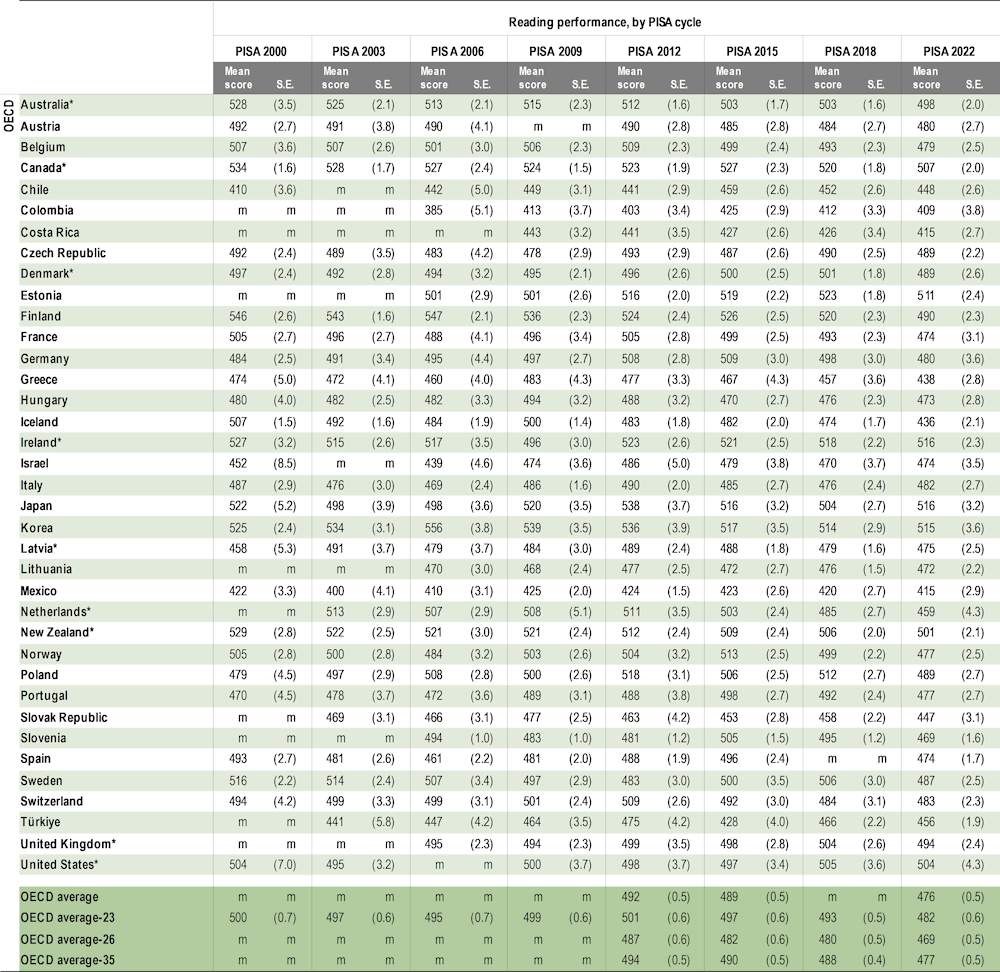
1. The average decennial trend is the average change, per 10-year period, between the earliest available measurement in PISA and PISA 2022, calculated by a linear regression. The average decennial trend is only computed for countries with comparable data in more than two PISA assessments, over the period considered. 2. Curvilinear trends in performance are computed only for countries with comparable data in more than four PISA assessments. Curvilinear trends are calculated by a regression of performance over both linear and quadratic (squared) terms of the gap between the year of assessment and 2022. The coefficient for the linear term represents the annual rate of change in 2022, while the coefficient for the quadratic term represents the acceleration or deceleration of the change in performance. * Caution is required when interpreting estimates because one or more PISA sampling standards were not met (see Reader’s Guide, Annexes A2 and A4). ** Caution is required when comparing estimates based on PISA 2022 with other countries/economies as a strong linkage to the international PISA reading scale could not be established (see Reader’s Guide and Annex A4). Notes: Values that are statistically significant are indicated in bold (see Annex A3). Costa Rica, Georgia, Malaysia, Malta, Moldova and the United Arab Emirates conducted the PISA 2009 assessment in 2010 as part of PISA 2009+. For Cambodia, Guatemala and Paraguay, results reported under PISA 2018 refer to the results of the PISA for Development assessment, in 2017.
Table I.B1.5.5. Mean reading performance, 2000 through 2022 [2/6]
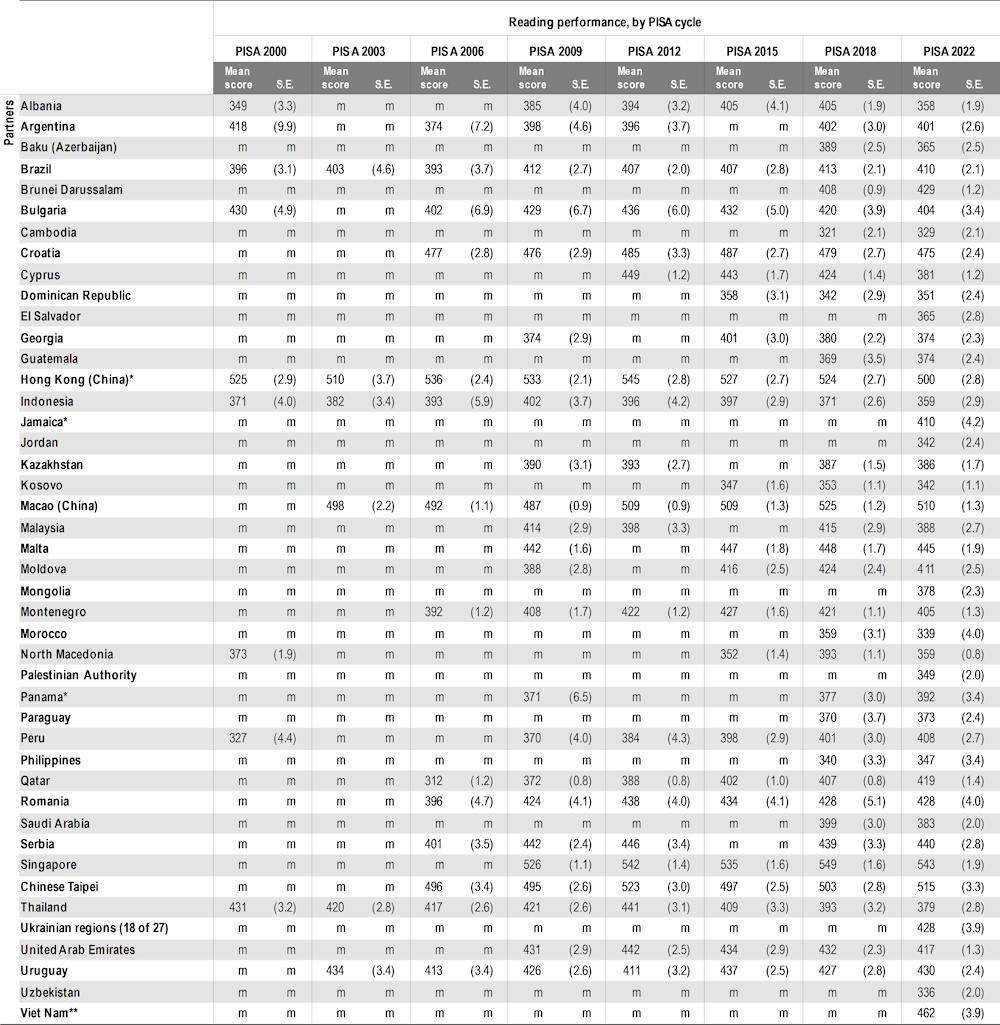
1. The average decennial trend is the average change, per 10-year period, between the earliest available measurement in PISA and PISA 2022, calculated by a linear regression. The average decennial trend is only computed for countries with comparable data in more than two PISA assessments, over the period considered. 2. Curvilinear trends in performance are computed only for countries with comparable data in more than four PISA assessments. Curvilinear trends are calculated by a regression of performance over both linear and quadratic (squared) terms of the gap between the year of assessment and 2022. The coefficient for the linear term represents the annual rate of change in 2022, while the coefficient for the quadratic term represents the acceleration or deceleration of the change in performance. * Caution is required when interpreting estimates because one or more PISA sampling standards were not met (see Reader’s Guide, Annexes A2 and A4). ** Caution is required when comparing estimates based on PISA 2022 with other countries/economies as a strong linkage to the international PISA reading scale could not be established (see Reader’s Guide and Annex A4). Notes: Values that are statistically significant are indicated in bold (see Annex A3). Costa Rica, Georgia, Malaysia, Malta, Moldova and the United Arab Emirates conducted the PISA 2009 assessment in 2010 as part of PISA 2009+. For Cambodia, Guatemala and Paraguay, results reported under PISA 2018 refer to the results of the PISA for Development assessment, in 2017.
Table I.B1.5.5. Mean reading performance, 2000 through 2022 [3/6]
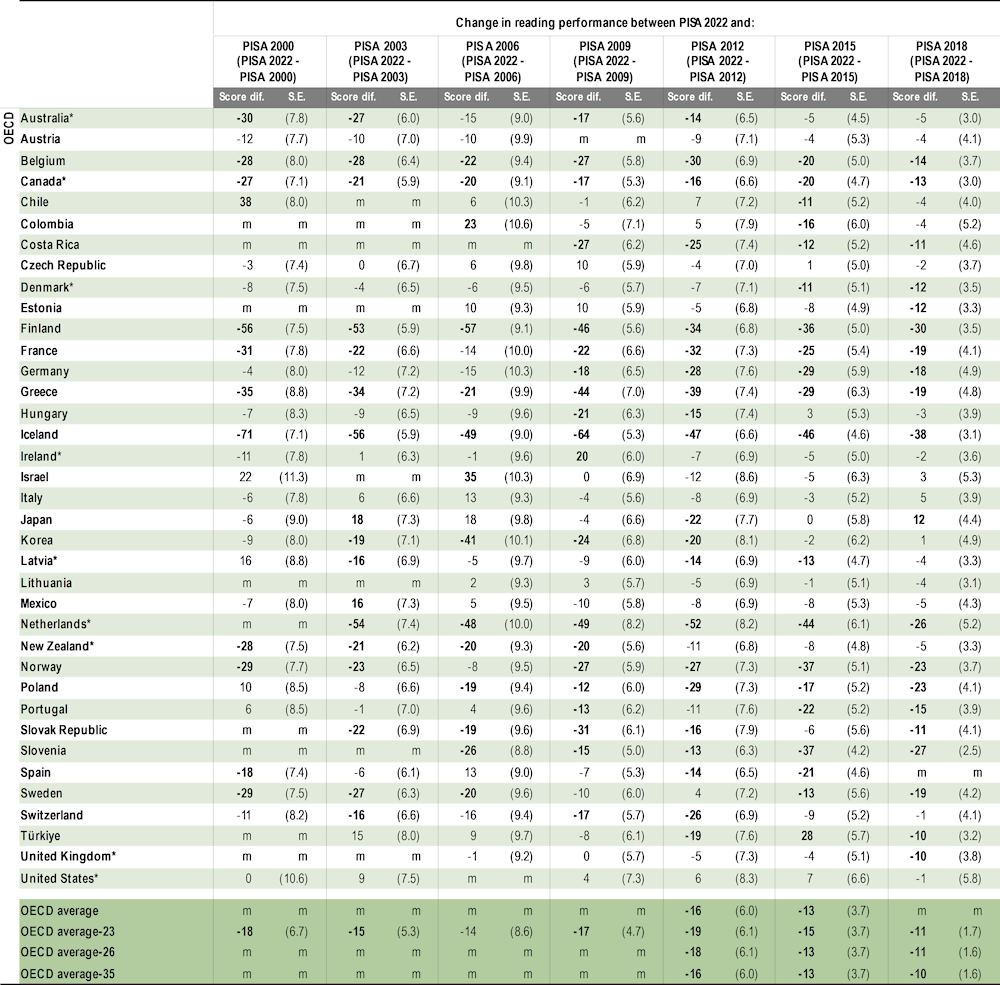
* Caution is required when interpreting estimates because one or more PISA sampling standards were not met (see Reader’s Guide, Annexes A2 and A4). ** Caution is required when comparing estimates based on PISA 2022 with other countries/economies as a strong linkage to the international PISA reading scale could not be established (see Reader’s Guide and Annex A4). 1. The average decennial trend is the average change, per 10-year period, between the earliest available measurement in PISA and PISA 2022, calculated by a linear regression. The average decennial trend is only computed for countries with comparable data in more than two PISA assessments, over the period considered. 2. Curvilinear trends in performance are computed only for countries with comparable data in more than four PISA assessments. Curvilinear trends are calculated by a regression of performance over both linear and quadratic (squared) terms of the gap between the year of assessment and 2022. The coefficient for the linear term represents the annual rate of change in 2022, while the coefficient for the quadratic term represents the acceleration or deceleration of the change in performance. Notes: Values that are statistically significant are indicated in bold (see Annex A3). Costa Rica, Georgia, Malaysia, Malta, Moldova and the United Arab Emirates conducted the PISA 2009 assessment in 2010 as part of PISA 2009+. For Cambodia, Guatemala and Paraguay, results reported under PISA 2018 refer to the results of the PISA for Development assessment, in 2017.
Table I.B1.5.5. Mean reading performance, 2000 through 2022 [4/6]
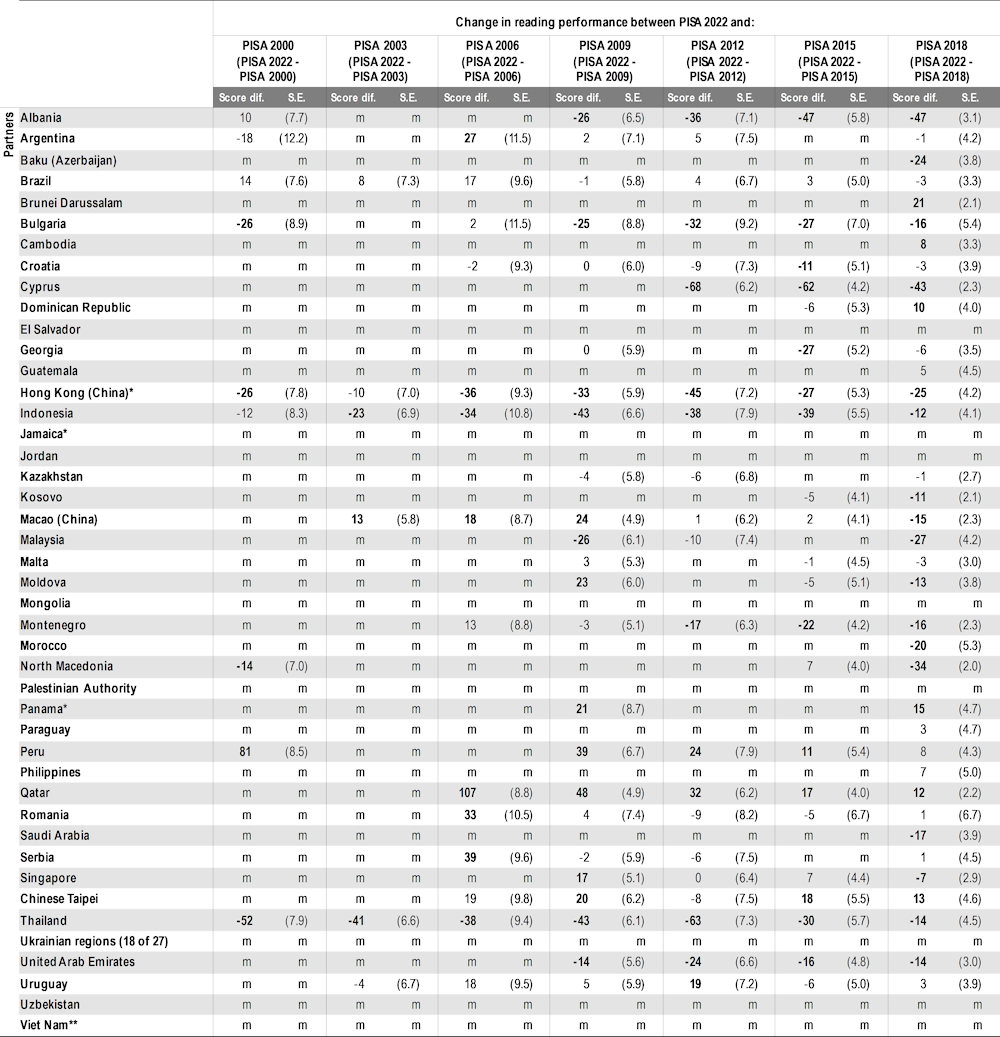
1. The average decennial trend is the average change, per 10-year period, between the earliest available measurement in PISA and PISA 2022, calculated by a linear regression. The average decennial trend is only computed for countries with comparable data in more than two PISA assessments, over the period considered. 2. Curvilinear trends in performance are computed only for countries with comparable data in more than four PISA assessments. Curvilinear trends are calculated by a regression of performance over both linear and quadratic (squared) terms of the gap between the year of assessment and 2022. The coefficient for the linear term represents the annual rate of change in 2022, while the coefficient for the quadratic term represents the acceleration or deceleration of the change in performance. * Caution is required when interpreting estimates because one or more PISA sampling standards were not met (see Reader’s Guide, Annexes A2 and A4). ** Caution is required when comparing estimates based on PISA 2022 with other countries/economies as a strong linkage to the international PISA reading scale could not be established (see Reader’s Guide and Annex A4). Notes: Values that are statistically significant are indicated in bold (see Annex A3). Costa Rica, Georgia, Malaysia, Malta, Moldova and the United Arab Emirates conducted the PISA 2009 assessment in 2010 as part of PISA 2009+. For Cambodia, Guatemala and Paraguay, results reported under PISA 2018 refer to the results of the PISA for Development assessment, in 2017.
Table I.B1.5.5. Mean reading performance, 2000 through 2022 [5/6]
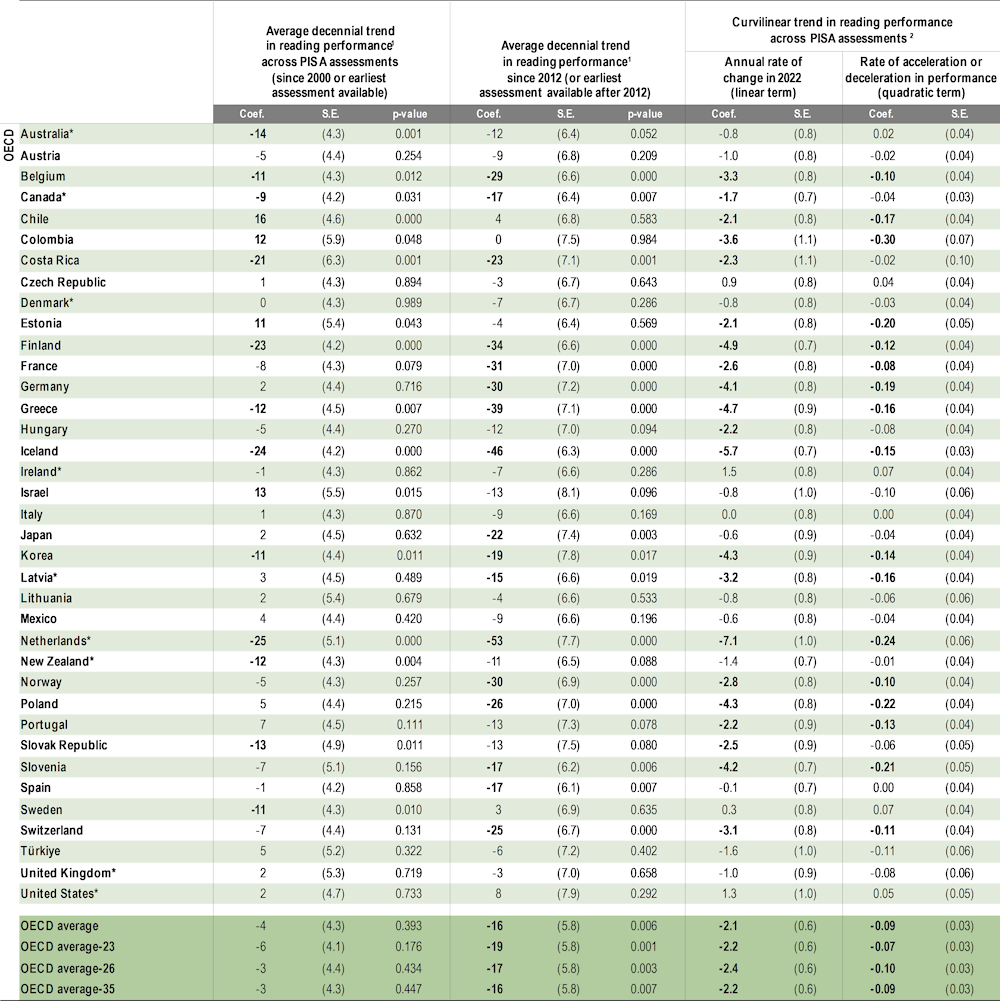
* Caution is required when interpreting estimates because one or more PISA sampling standards were not met (see Reader’s Guide, Annexes A2 and A4). ** Caution is required when comparing estimates based on PISA 2022 with other countries/economies as a strong linkage to the international PISA reading scale could not be established (see Reader’s Guide and Annex A4). 1. The average decennial trend is the average change, per 10-year period, between the earliest available measurement in PISA and PISA 2022, calculated by a linear regression. The average decennial trend is only computed for countries with comparable data in more than two PISA assessments, over the period considered. 2. Curvilinear trends in performance are computed only for countries with comparable data in more than four PISA assessments. Curvilinear trends are calculated by a regression of performance over both linear and quadratic (squared) terms of the gap between the year of assessment and 2022. The coefficient for the linear term represents the annual rate of change in 2022, while the coefficient for the quadratic term represents the acceleration or deceleration of the change in performance. Notes: Values that are statistically significant are indicated in bold (see Annex A3). Costa Rica, Georgia, Malaysia, Malta, Moldova and the United Arab Emirates conducted the PISA 2009 assessment in 2010 as part of PISA 2009+. For Cambodia, Guatemala and Paraguay, results reported under PISA 2018 refer to the results of the PISA for Development assessment, in 2017.
Table I.B1.5.5. Mean reading performance, 2000 through 2022 [6/6]
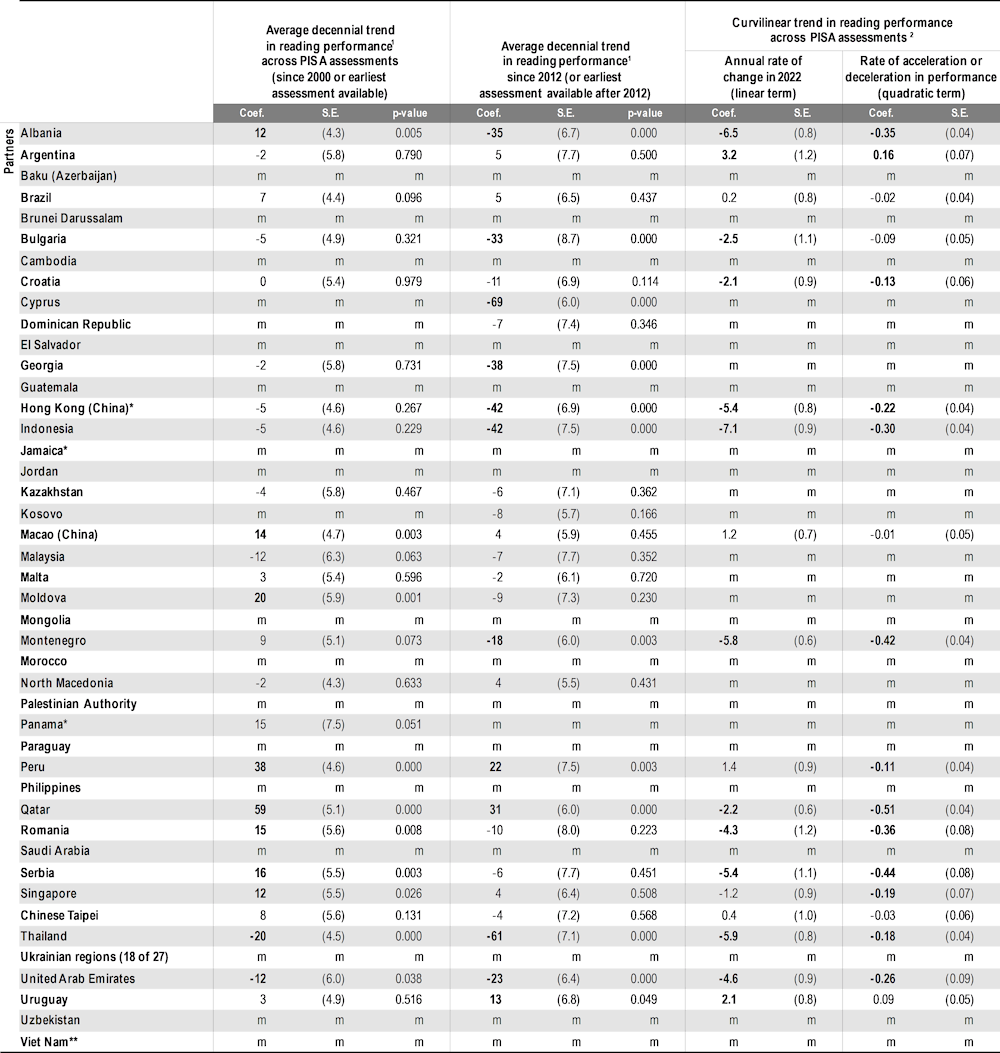
1. The average decennial trend is the average change, per 10-year period, between the earliest available measurement in PISA and PISA 2022, calculated by a linear regression. The average decennial trend is only computed for countries with comparable data in more than two PISA assessments, over the period considered.2. Curvilinear trends in performance are computed only for countries with comparable data in more than four PISA assessments. Curvilinear trends are calculated by a regression of performance over both linear and quadratic (squared) terms of the gap between the year of assessment and 2022. The coefficient for the linear term represents the annual rate of change in 2022, while the coefficient for the quadratic term represents the acceleration or deceleration of the change in performance. * Caution is required when interpreting estimates because one or more PISA sampling standards were not met (see Reader’s Guide, Annexes A2 and A4).** Caution is required when comparing estimates based on PISA 2022 with other countries/economies as a strong linkage to the international PISA reading scale could not be established (see Reader’s Guide and Annex A4). Notes: Values that are statistically significant are indicated in bold (see Annex A3). Costa Rica, Georgia, Malaysia, Malta, Moldova and the United Arab Emirates conducted the PISA 2009 assessment in 2010 as part of PISA 2009+. For Cambodia, Guatemala and Paraguay, results reported under PISA 2018 refer to the results of the PISA for Development assessment, in 2017.
Table I.B1.5.6. Mean science performance, 2006 through 2022 [1/6]
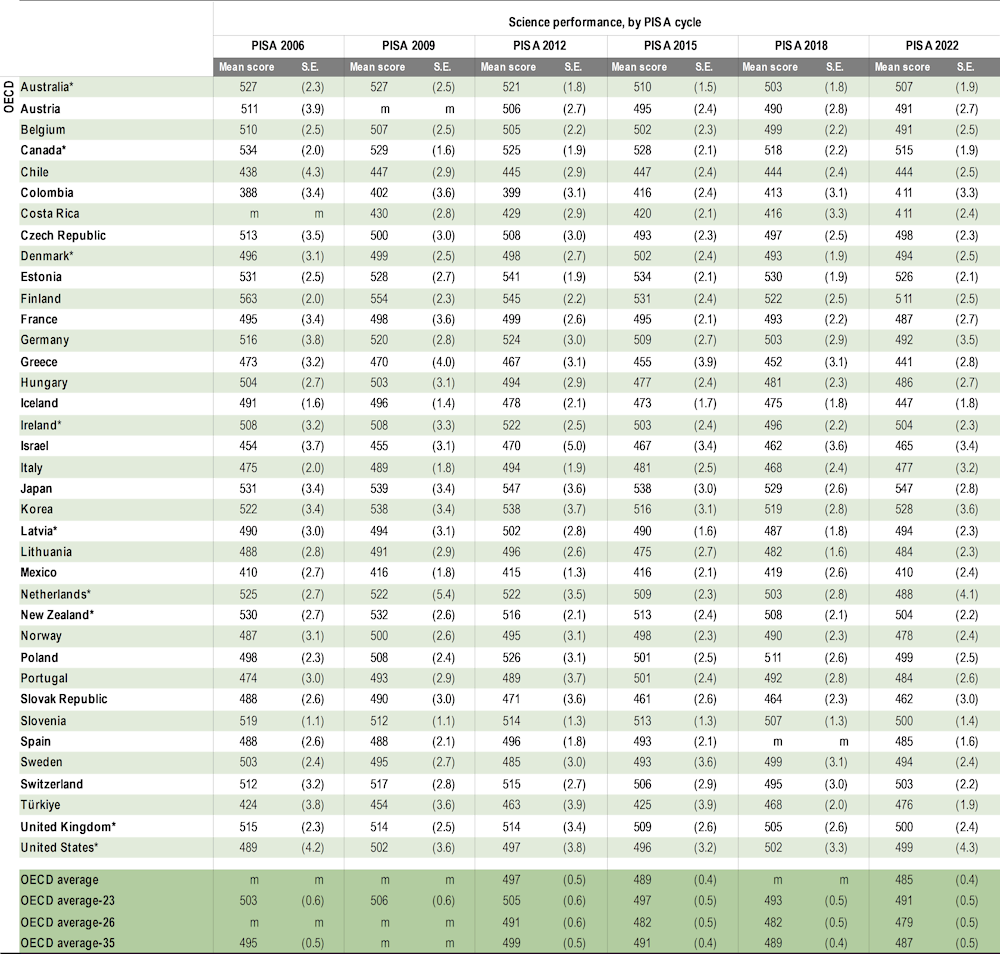
1. The average decennial trend is the average change, per 10-year period, between the earliest available measurement in PISA and PISA 2022, calculated by a linear regression. The average decennial trend is only computed for countries with comparable data in more than two PISA assessments, over the period considered.
2. Curvilinear trends in performance are computed only for countries with comparable data in more than four PISA assessments. Curvilinear trends are calculated by a regression of performance over both linear and quadratic (squared) terms of the gap between the year of assessment and 2022. The coefficient for the linear term represents the annual rate of change in 2022, while the coefficient for the quadratic term represents the acceleration or deceleration of the change in performance.
* Caution is required when interpreting estimates because one or more PISA sampling standards were not met (see Reader’s Guide, Annexes A2 and A4).
Notes: Values that are statistically significant are indicated in bold (see Annex A3). Costa Rica, Georgia, Malaysia, Malta, Moldova and the United Arab Emirates conducted the PISA 2009 assessment in 2010 as part of PISA 2009+. For Cambodia, Guatemala and Paraguay, results reported under PISA 2018 refer to the results of the PISA for Development assessment, in 2017.
Table I.B1.5.6. Mean science performance, 2006 through 2022 [2/6]
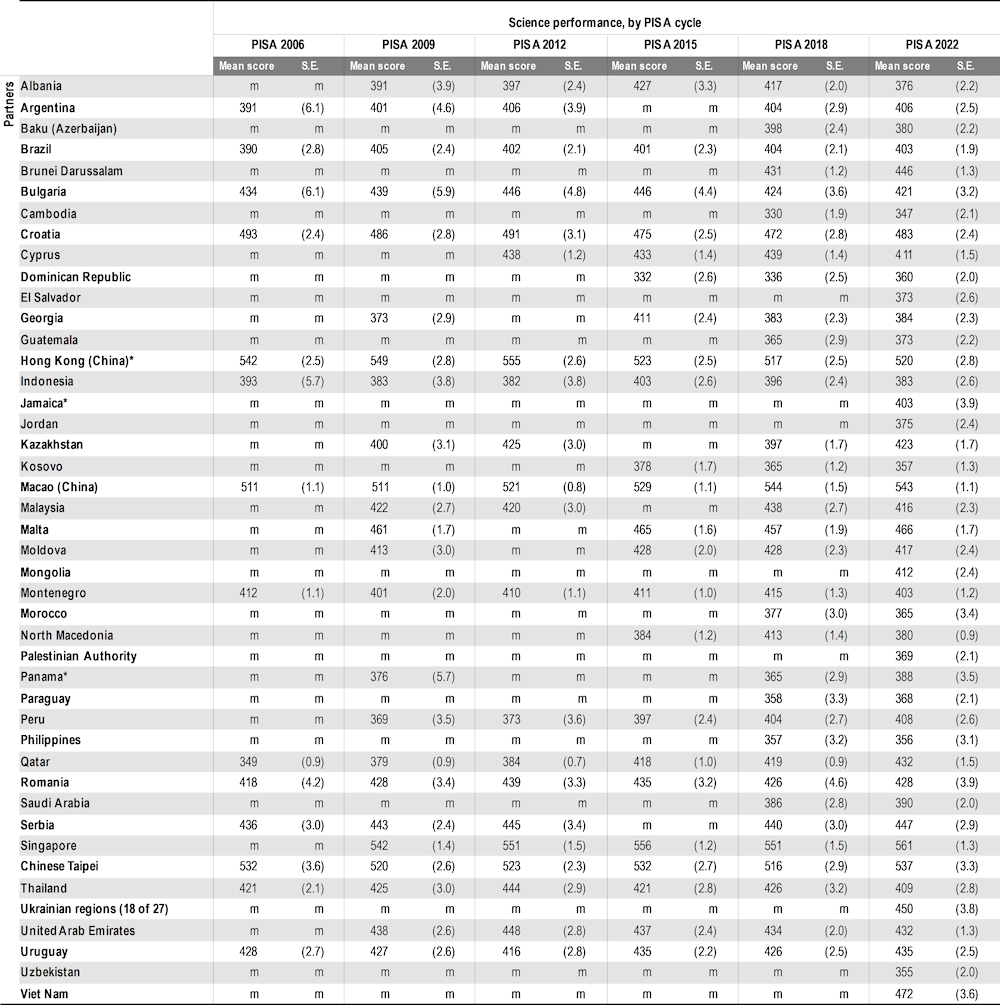
1. The average decennial trend is the average change, per 10-year period, between the earliest available measurement in PISA and PISA 2022, calculated by a linear regression. The average decennial trend is only computed for countries with comparable data in more than two PISA assessments, over the period considered.
2. Curvilinear trends in performance are computed only for countries with comparable data in more than four PISA assessments. Curvilinear trends are calculated by a regression of performance over both linear and quadratic (squared) terms of the gap between the year of assessment and 2022. The coefficient for the linear term represents the annual rate of change in 2022, while the coefficient for the quadratic term represents the acceleration or deceleration of the change in performance.
* Caution is required when interpreting estimates because one or more PISA sampling standards were not met (see Reader’s Guide, Annexes A2 and A4).
Notes: Values that are statistically significant are indicated in bold (see Annex A3). Costa Rica, Georgia, Malaysia, Malta, Moldova and the United Arab Emirates conducted the PISA 2009 assessment in 2010 as part of PISA 2009+. For Cambodia, Guatemala and Paraguay, results reported under PISA 2018 refer to the results of the PISA for Development assessment, in 2017.
Table I.B1.5.6. Mean science performance, 2006 through 2022 [3/6]
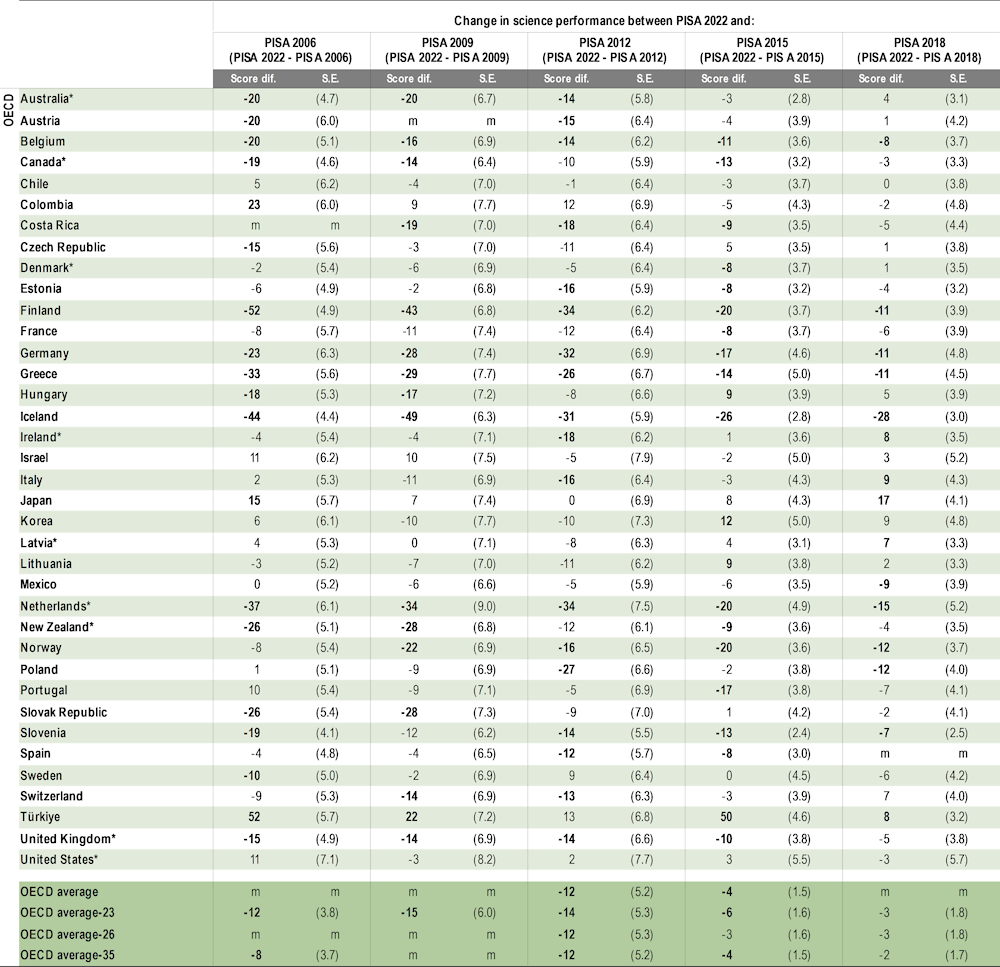
1. The average decennial trend is the average change, per 10-year period, between the earliest available measurement in PISA and PISA 2022, calculated by a linear regression. The average decennial trend is only computed for countries with comparable data in more than two PISA assessments, over the period considered.
2. Curvilinear trends in performance are computed only for countries with comparable data in more than four PISA assessments. Curvilinear trends are calculated by a regression of performance over both linear and quadratic (squared) terms of the gap between the year of assessment and 2022. The coefficient for the linear term represents the annual rate of change in 2022, while the coefficient for the quadratic term represents the acceleration or deceleration of the change in performance.
* Caution is required when interpreting estimates because one or more PISA sampling standards were not met (see Reader’s Guide, Annexes A2 and A4).
Notes: Values that are statistically significant are indicated in bold (see Annex A3). Costa Rica, Georgia, Malaysia, Malta, Moldova and the United Arab Emirates conducted the PISA 2009 assessment in 2010 as part of PISA 2009+. For Cambodia, Guatemala and Paraguay, results reported under PISA 2018 refer to the results of the PISA for Development assessment, in 2017.
Table I.B1.5.6. Mean science performance, 2006 through 2022 [4/6]
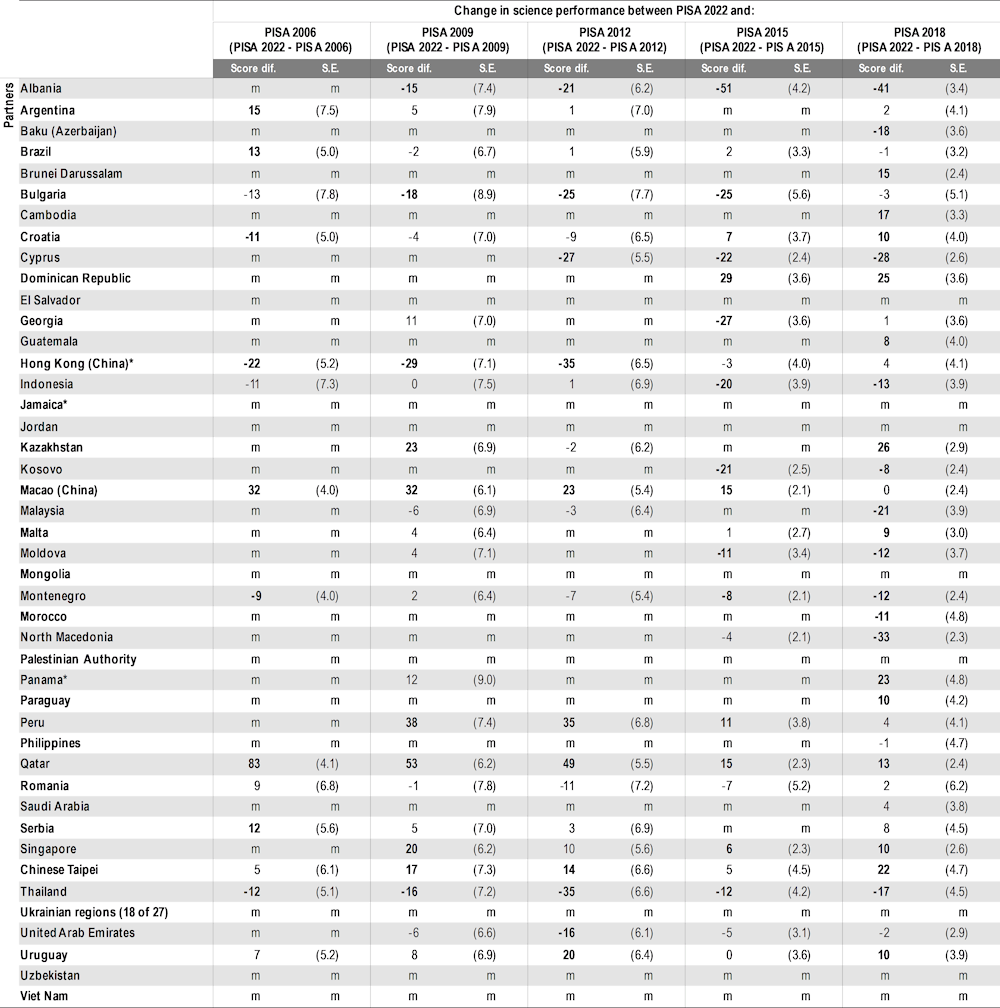
1. The average decennial trend is the average change, per 10-year period, between the earliest available measurement in PISA and PISA 2022, calculated by a linear regression. The average decennial trend is only computed for countries with comparable data in more than two PISA assessments, over the period considered.
2. Curvilinear trends in performance are computed only for countries with comparable data in more than four PISA assessments. Curvilinear trends are calculated by a regression of performance over both linear and quadratic (squared) terms of the gap between the year of assessment and 2022. The coefficient for the linear term represents the annual rate of change in 2022, while the coefficient for the quadratic term represents the acceleration or deceleration of the change in performance.
* Caution is required when interpreting estimates because one or more PISA sampling standards were not met (see Reader’s Guide, Annexes A2 and A4).
Notes: Values that are statistically significant are indicated in bold (see Annex A3). Costa Rica, Georgia, Malaysia, Malta, Moldova and the United Arab Emirates conducted the PISA 2009 assessment in 2010 as part of PISA 2009+. For Cambodia, Guatemala and Paraguay, results reported under PISA 2018 refer to the results of the PISA for Development assessment, in 2017.
Table I.B1.5.6. Mean science performance, 2006 through 2022 [5/6]
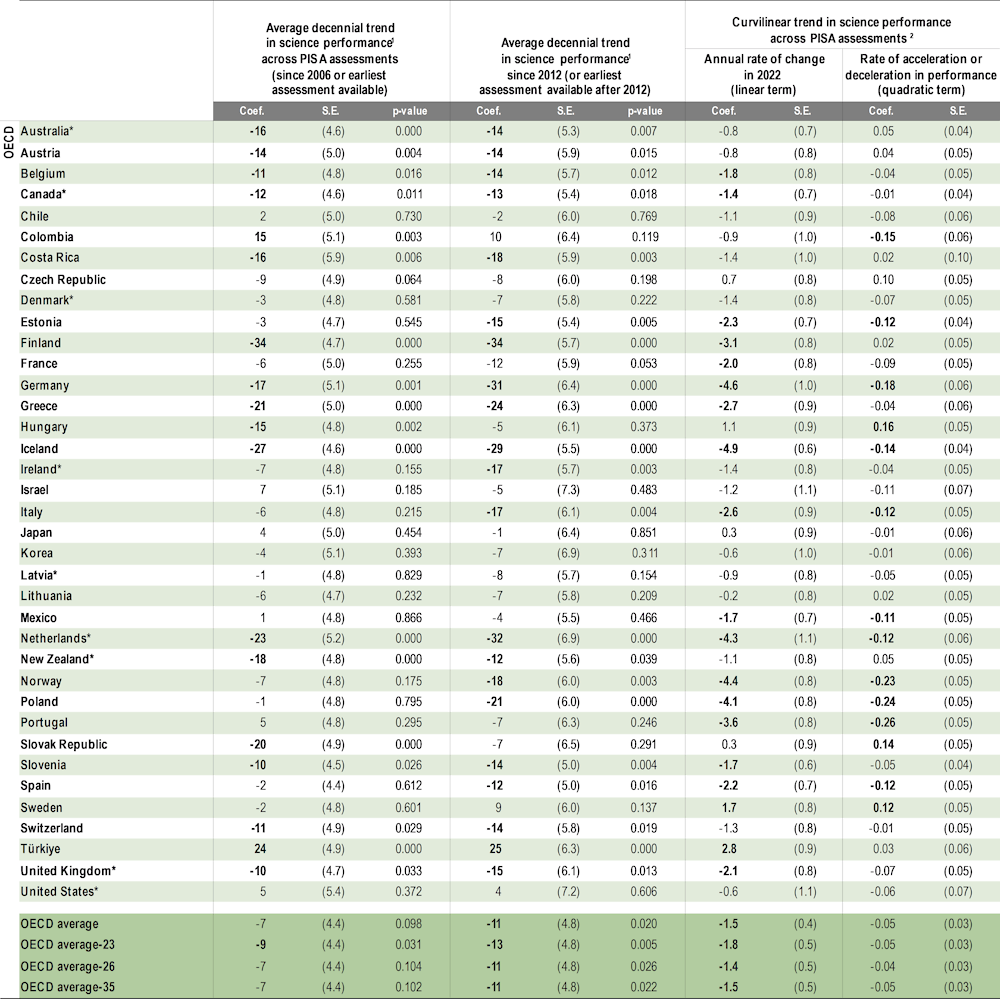
1. The average decennial trend is the average change, per 10-year period, between the earliest available measurement in PISA and PISA 2022, calculated by a linear regression. The average decennial trend is only computed for countries with comparable data in more than two PISA assessments, over the period considered.
2. Curvilinear trends in performance are computed only for countries with comparable data in more than four PISA assessments. Curvilinear trends are calculated by a regression of performance over both linear and quadratic (squared) terms of the gap between the year of assessment and 2022. The coefficient for the linear term represents the annual rate of change in 2022, while the coefficient for the quadratic term represents the acceleration or deceleration of the change in performance.
* Caution is required when interpreting estimates because one or more PISA sampling standards were not met (see Reader’s Guide, Annexes A2 and A4).
Notes: Values that are statistically significant are indicated in bold (see Annex A3). Costa Rica, Georgia, Malaysia, Malta, Moldova and the United Arab Emirates conducted the PISA 2009 assessment in 2010 as part of PISA 2009+. For Cambodia, Guatemala and Paraguay, results reported under PISA 2018 refer to the results of the PISA for Development assessment, in 2017.
Table I.B1.5.6. Mean science performance, 2006 through 2022 [6/6]
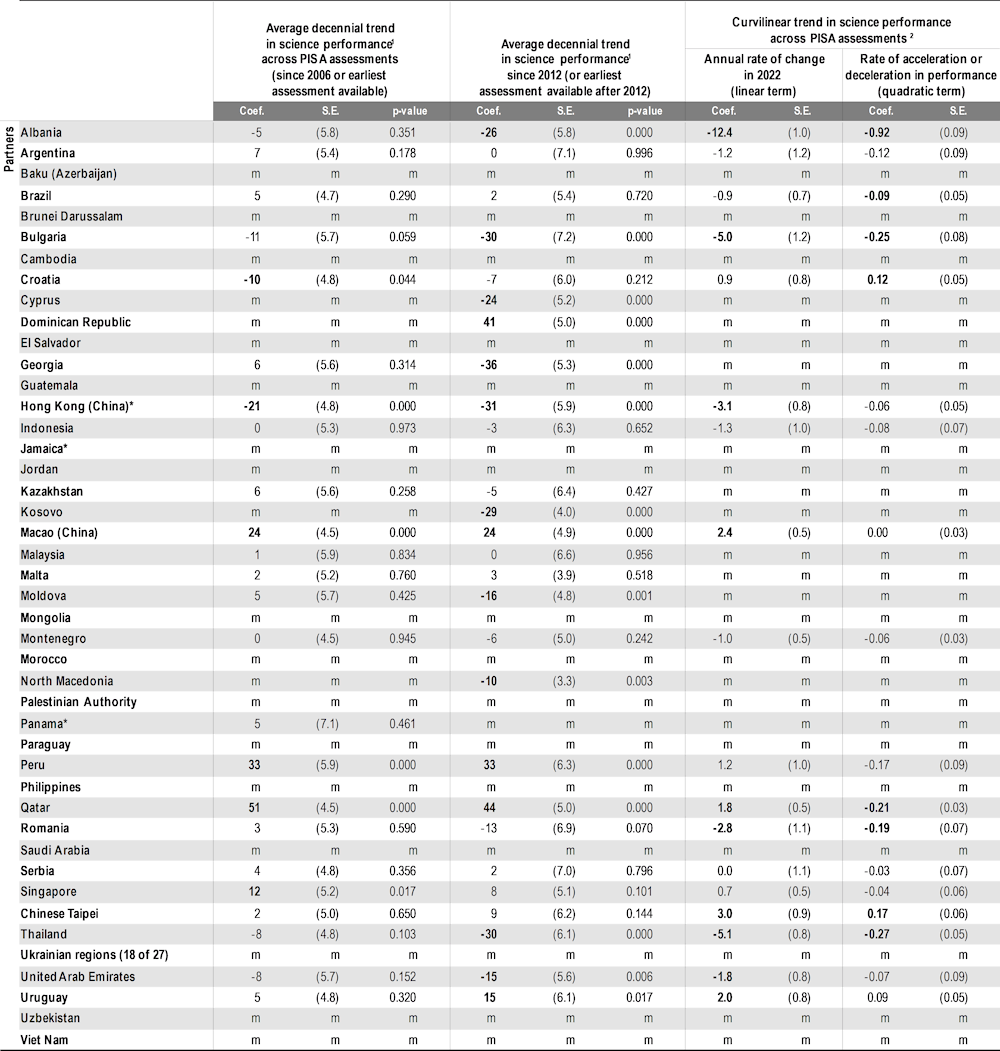
1. The average decennial trend is the average change, per 10-year period, between the earliest available measurement in PISA and PISA 2022, calculated by a linear regression. The average decennial trend is only computed for countries with comparable data in more than two PISA assessments, over the period considered. 2. Curvilinear trends in performance are computed only for countries with comparable data in more than four PISA assessments. Curvilinear trends are calculated by a regression of performance over both linear and quadratic (squared) terms of the gap between the year of assessment and 2022. The coefficient for the linear term represents the annual rate of change in 2022, while the coefficient for the quadratic term represents the acceleration or deceleration of the change in performance. * Caution is required when interpreting estimates because one or more PISA sampling standards were not met (see Reader’s Guide, Annexes A2 and A4). Notes: Values that are statistically significant are indicated in bold (see Annex A3). Costa Rica, Georgia, Malaysia, Malta, Moldova and the United Arab Emirates conducted the PISA 2009 assessment in 2010 as part of PISA 2009+. For Cambodia, Guatemala and Paraguay, results reported under PISA 2018 refer to the results of the PISA for Development assessment, in 2017.
Table I.B1.7.1. Percentage of students with an immigrant background in PISA 2022 [1/2]
Based on students’ reports
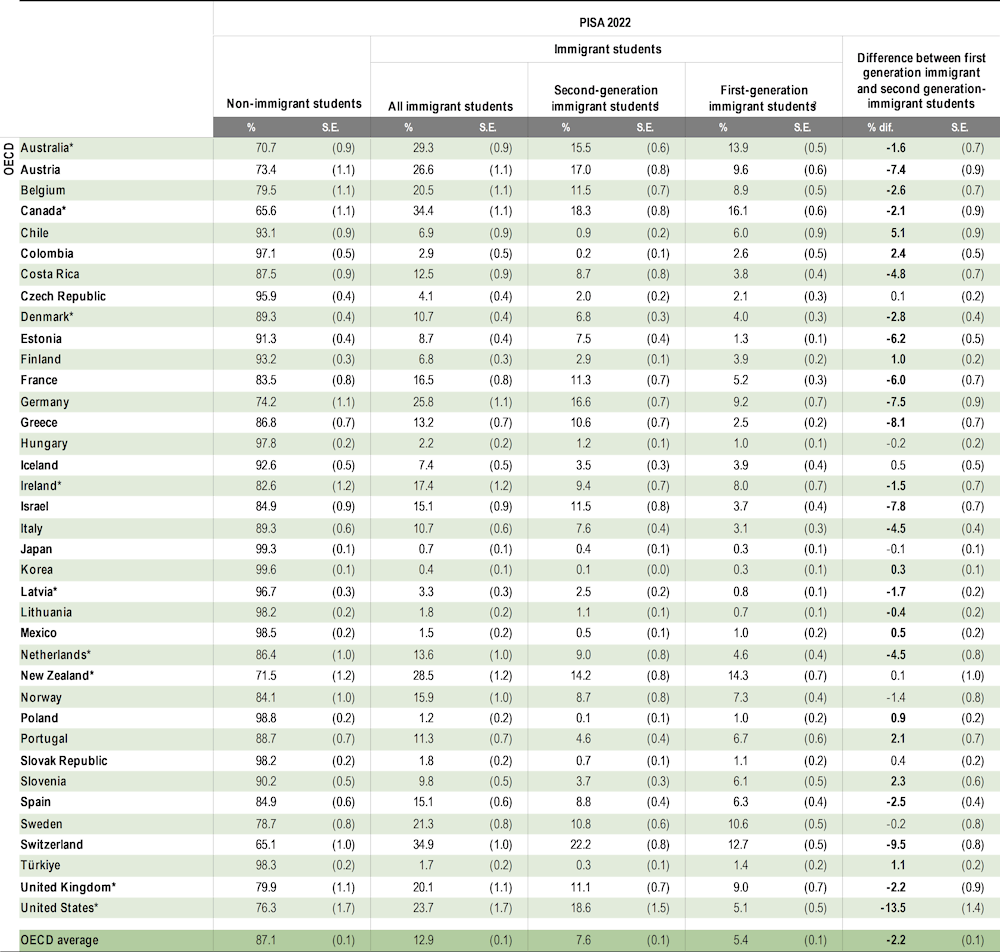
* Caution is required when interpreting estimates because one or more PISA sampling standards were not met (see Reader’s Guide, Annexes A2 and A4).
Note: Values that are statistically significant are indicated in bold (see Annex A3).
Table I.B1.7.1. Percentage of students with an immigrant background in PISA 2022 [2/2]
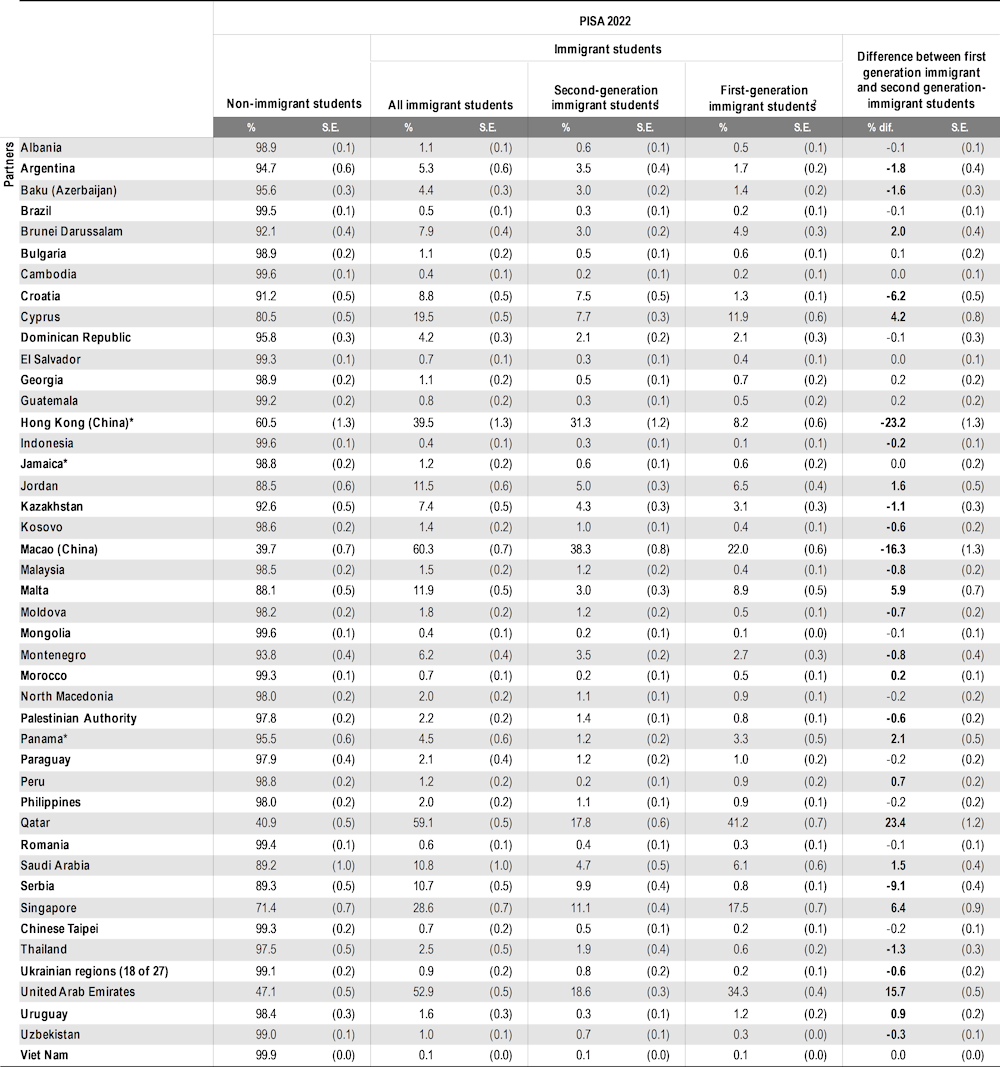
* Caution is required when interpreting estimates because one or more PISA sampling standards were not met (see Reader’s Guide, Annexes A2 and A4).
Note: Values that are statistically significant are indicated in bold (see Annex A3).
Table I.B1.7.17. Mathematics performance of students with an immigrant background in PISA 2022 [1/2]
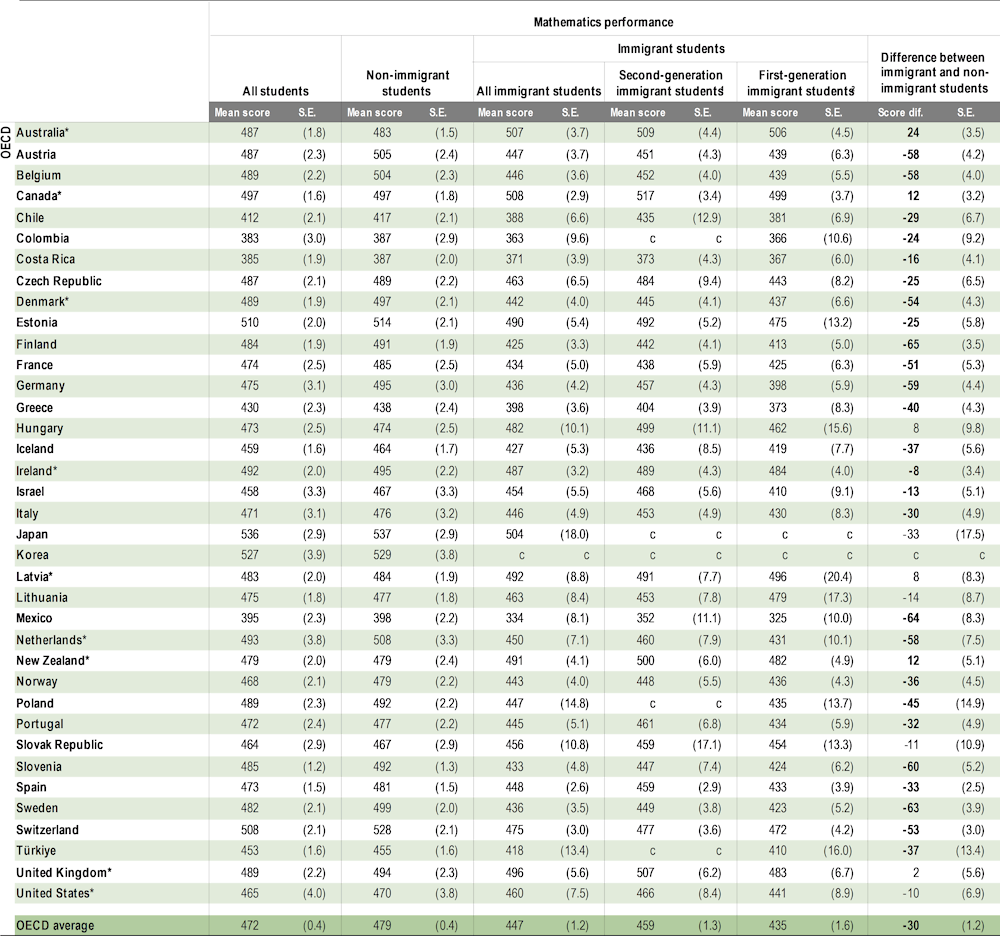
* Caution is required when interpreting estimates because one or more PISA sampling standards were not met (see Reader’s Guide, Annexes A2 and A4).
Note: Values that are statistically significant are indicated in bold (see Annex A3).
Table I.B1.7.17. Mathematics performance of students with an immigrant background in PISA 2022 [2/2]
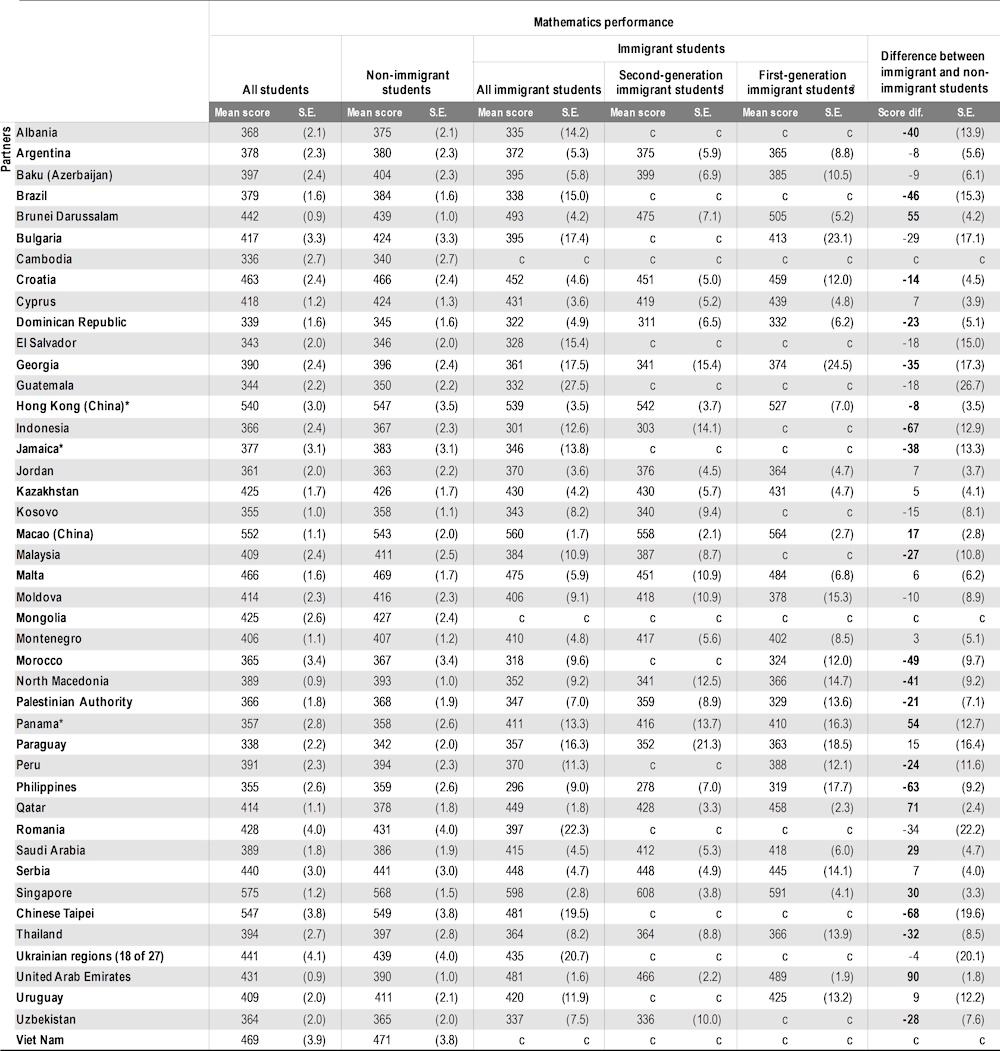
* Caution is required when interpreting estimates because one or more PISA sampling standards were not met (see Reader’s Guide, Annexes A2 and A4).
Note: Values that are statistically significant are indicated in bold (see Annex A3).
Table I.B1.2. How did countries perform in PISA 2022? Chapter 2 tables
|
Table I.B1.2.1 |
Mean score and variation in mathematics performance |
|
|
Table I.B1.2.2 |
Mean score and variation in reading performance |
|
|
Table I.B1.2.3 |
Mean score and variation in science performance |
|
|
WEB |
Table I.B1.2.4 |
Mean score and variation in student performance on the mathematics process subscale formulating |
|
WEB |
Table I.B1.2.5 |
Mean score and variation in student performance on the mathematics process subscale employing |
|
WEB |
Table I.B1.2.6 |
Mean score and variation in student performance on the mathematics process subscale interpreting |
|
WEB |
Table I.B1.2.7 |
Mean score and variation in student performance on the mathematics process subscale reasoning |
|
WEB |
Table I.B1.2.8 |
Mean score and variation in student performance on the mathematics content subscale change and relationships |
|
WEB |
Table I.B1.2.9 |
Mean score and variation in student performance on the mathematics content subscale quantity |
|
WEB |
Table I.B1.2.10 |
Mean score and variation in student performance on the mathematics content subscale space and shape |
|
WEB |
Table I.B1.2.11 |
Mean score and variation in student performance on the mathematics content subscale uncertainty and data |
|
WEB |
Table I.B1.2.12 |
Total variation in mathematics performance, and variation between and within schools |
|
WEB |
Table I.B1.2.13 |
Total variation in mathematics performance, and variation between and within schools (without modal grade restriction) |
|
WEB |
Table I.B1.2.14 |
Modal grade by country/economy |
|
WEB |
Table I.B1.2.15 |
Percentage of students, including those with missing information, at each grade level |
|
WEB |
Table I.B1.2.16 |
Index of mathematics anxiety and growth mindset |
|
WEB |
Table I.B1.2.17 |
Mathematics performance, mathematics anxiety and growth mindset |
Table I.B1.3. What can students do in mathematics, reading and science? Chapter 3 tables
|
Table I.B1.3.1 |
Percentage of students at each proficiency level in mathematics |
|
|
Table I.B1.3.2 |
Percentage of students at each proficiency level in reading |
|
|
Table I.B1.3.3 |
Percentage of students at each proficiency level in science |
|
|
WEB |
Table I.B1.3.4 |
Percentage of students at each proficiency level on the mathematics process subscale formulating |
|
WEB |
Table I.B1.3.5 |
Percentage of students at each proficiency level on the mathematics process subscale employing |
|
WEB |
Table I.B1.3.6 |
Percentage of students at each proficiency level on the mathematics process subscale interpreting |
|
WEB |
Table I.B1.3.7 |
Percentage of students at each proficiency level on the mathematics process subscale reasoning |
|
WEB |
Table I.B1.3.8 |
Percentage of students at each proficiency level on the mathematics content subscale change and relationships |
|
WEB |
Table I.B1.3.9 |
Percentage of students at each proficiency level on the mathematics content subscale quantity |
|
WEB |
Table I.B1.3.10 |
Percentage of students at each proficiency level on the mathematics content subscale space and shape |
|
WEB |
Table I.B1.3.11 |
Percentage of students at each proficiency level on the mathematics content subscale uncertainty and data |
|
WEB |
Table I.B1.3.12 |
Disparities in minimum achievement in reading and mathematics (SDG 4.5) |
Table I.B1.4. Equity in education in PISA 2022 annex tables
|
WEB |
Table I.B1.4.1 |
Access to education among 15-year-olds: change between 2012 and 2022 |
|
Table I.B1.4.2 |
Students' socio-economic status |
|
|
Table I.B1.4.3 |
Socio-economic status and mathematics performance |
|
|
WEB |
Table I.B1.4.4 |
Socio-economic status and reading performance |
|
WEB |
Table I.B1.4.5 |
Socio-economic status and science performance |
|
WEB |
Table I.B1.4.6 |
Percentage of students by international quintiles of socio-economic status |
|
WEB |
Table I.B1.4.7 |
Percentage of students by international deciles of socio-economic status |
|
WEB |
Table I.B1.4.8 |
Mathematics performance, by international quintiles of socio-economic status |
|
WEB |
Table I.B1.4.9 |
Reading performance, by international quintiles of socio-economic status |
|
WEB |
Table I.B1.4.10 |
Science performance, by international quintiles of socio-economic status |
|
WEB |
Table I.B1.4.11 |
Mathematics performance, by international deciles of socio-economic status |
|
WEB |
Table I.B1.4.12 |
Reading performance, by international deciles of socio-economic status |
|
WEB |
Table I.B1.4.13 |
Science performance, by international deciles of socio-economic status |
|
WEB |
Table I.B1.4.14 |
Low and top performance in mathematics, by students' socio-economic status |
|
WEB |
Table I.B1.4.15 |
Low and top performance in reading, by students' socio-economic status |
|
WEB |
Table I.B1.4.16 |
Low and top performance in science, by students' socio-economic status |
|
Table I.B1.4.17 |
Mathematics performance, by gender |
|
|
WEB |
Table I.B1.4.18 |
Reading performance, by gender |
|
WEB |
Table I.B1.4.19 |
Science performance, by gender |
|
WEB |
Table I.B1.4.20 |
Mean score and variation in the process subscale of mathematics formulating, by gender |
|
WEB |
Table I.B1.4.21 |
Mean score and variation in the process subscale of mathematics employing, by gender |
|
WEB |
Table I.B1.4.22 |
Mean score and variation in the process subscale of mathematics interpreting, by gender |
|
WEB |
Table I.B1.4.23 |
Mean score and variation in the process subscale of mathematics reasoning, by gender |
|
WEB |
Table I.B1.4.24 |
Mean score and variation in the content subscale of mathematics change and relationships, by gender |
|
WEB |
Table I.B1.4.25 |
Mean score and variation in the content subscale of mathematics quantity, by gender |
|
WEB |
Table I.B1.4.26 |
Mean score and variation in the content subscale of mathematics space and shape, by gender |
|
WEB |
Table I.B1.4.27 |
Mean score and variation in the content subscale of mathematics uncertainty and data, by gender |
|
WEB |
Table I.B1.4.28 |
Percentage of students at each proficiency level in mathematics, by gender |
|
WEB |
Table I.B1.4.29 |
Percentage of students at each proficiency level in reading, by gender |
|
WEB |
Table I.B1.4.30 |
Percentage of students at each proficiency level in science, by gender |
|
WEB |
Table I.B1.4.31 |
Low and top performance in mathematics, by gender |
|
WEB |
Table I.B1.4.32 |
Low and top performance in reading, by gender |
|
WEB |
Table I.B1.4.33 |
Low and top performance in science, by gender |
|
WEB |
Table I.B1.4.34 |
Mathematics performance, by gender and socio-economic status |
|
WEB |
Table I.B1.4.35 |
Reading performance, by gender and socio-economic status |
|
WEB |
Table I.B1.4.36 |
Science performance, by gender and socio-economic status |
|
WEB |
Table I.B1.4.37 |
Low and top performance in mathematics, by gender and socio-economic status |
|
WEB |
Table I.B1.4.38 |
Low and top performance in reading, by gender and socio-economic status |
|
WEB |
Table I.B1.4.39 |
Low and top performance in science, by gender and socio-economic status |
|
WEB |
Table I.B1.4.40 |
Between- and within-school variation in students' socio-economic status |
|
WEB |
Table I.B1.4.41 |
Between- and within-school variation in students' socio-economic status (without modal grade restriction) |
|
WEB |
Table I.B1.4.42 |
Overlap of top performers in mathematics, reading and science |
|
WEB |
Table I.B1.4.43 |
Overlap of low performers in mathematics, reading and science |
|
WEB |
Table I.B1.4.44 |
Overlap of top performers in mathematics, reading and science among all 15-year-olds |
|
WEB |
Table I.B1.4.45 |
Overlap of low performers in mathematics, reading and science among all 15-year-olds |
|
WEB |
Table I.B1.4.46 |
How often did students not eat because there was not enough money to buy food, in the past 30 days |
Table I.B1.5. Changes in performance and equity in education and long term trends annex tables
|
WEB |
Table I.B1.5.1 |
Percentage of low performers and top performers in mathematics, 2003 through 2022 |
|
WEB |
Table I.B1.5.2 |
Percentage of low performers and top performers in reading, 2009 through 2022 |
|
WEB |
Table I.B1.5.3 |
Percentage of low performers and top performers in science, 2006 through 2022 |
|
Table I.B1.5.4 |
Mean mathematics performance, 2003 through 2022 |
|
|
Table I.B1.5.5 |
Mean reading performance, 2000 through 2022 |
|
|
Table I.B1.5.6 |
Mean science performance, 2006 through 2022 |
|
|
WEB |
Table I.B1.5.7 |
Distribution of mathematics scores, 2003 through 2022 |
|
WEB |
Table I.B1.5.8 |
Distribution of reading scores, 2000 through 2022 |
|
WEB |
Table I.B1.5.9 |
Distribution of science scores, 2006 through 2022 |
|
WEB |
Table I.B1.5.10 |
Variation in mathematics performance, 2003 through 2022 |
|
WEB |
Table I.B1.5.11 |
Variation in reading performance, 2000 through 2022 |
|
WEB |
Table I.B1.5.12 |
Variation in science performance, 2006 through 2022 |
|
WEB |
Table I.B1.5.13 |
Percentage of low performers and top performers in mathematics among all 15-year-olds, 2012 through 2022 |
|
WEB |
Table I.B1.5.14 |
Percentage of low performers and top performers in reading among all 15-year-olds, 2012 through 2022 |
|
WEB |
Table I.B1.5.15 |
Percentage of low performers and top performers in science among all 15-year-olds, 2012 through 2022 |
|
WEB |
Table I.B1.5.16 |
Distribution of mathematics scores among 15-year-olds, 2012 through 2022 |
|
WEB |
Table I.B1.5.17 |
Distribution of reading scores among 15-year-olds, 2012 through 2022 |
|
WEB |
Table I.B1.5.18 |
Distribution of science scores among 15-year-olds, 2012 through 2022 |
|
WEB |
Table I.B1.5.19 |
Mathematics performance by national quarter of socio-economic status, 2012 through 2022 |
|
WEB |
Table I.B1.5.20 |
Reading performance by national quarter of socio-economic status, 2012 through 2022 |
|
WEB |
Table I.B1.5.21 |
Science performance by national quarter of socio-economic status, 2012 through 2022 |
|
WEB |
Table I.B1.5.22 |
Strength of the relationship between mathematics performance and socio-economic status, 2012 through 2022 |
|
WEB |
Table I.B1.5.23 |
Strength of the relationship between reading performance and socio-economic status, 2012 through 2022 |
|
WEB |
Table I.B1.5.24 |
Strength of the relationship between science performance and socio-economic status, 2012 through 2022 |
|
WEB |
Table I.B1.5.25 |
Low performance in mathematics, by quarter of socio-economic status, 2012 through 2022 |
|
WEB |
Table I.B1.5.26 |
Low performance in reading, by quarter of socio-economic status, 2012 through 2022 |
|
WEB |
Table I.B1.5.27 |
Top performance in mathematics, by quarter of socio-economic status, 2012 through 2022 |
|
WEB |
Table I.B1.5.28 |
Top performance in reading, by quarter of socio-economic status, 2012 through 2022 |
|
WEB |
Table I.B1.5.29 |
Distribution of mathematics scores among disadvantaged students, 2012 through 2022 |
|
WEB |
Table I.B1.5.30 |
Distribution of mathematics scores among advantaged students, 2012 through 2022 |
|
WEB |
Table I.B1.5.31 |
Socio-economic gaps at the top and bottom of the distribution of mathematics scores, 2012 through 2022 |
|
WEB |
Table I.B1.5.32 |
Distribution of reading scores among disadvantaged students, 2012 through 2022 |
|
WEB |
Table I.B1.5.33 |
Distribution of reading scores among advantaged students, 2012 through 2022 |
|
WEB |
Table I.B1.5.34 |
Socio-economic gaps at the top and bottom of the distribution of reading scores, 2012 through 2022 |
|
WEB |
Table I.B1.5.35 |
Distribution of science scores among disadvantaged students, 2012 through 2022 |
|
WEB |
Table I.B1.5.36 |
Distribution of science scores among advantaged students, 2012 through 2022 |
|
WEB |
Table I.B1.5.37 |
Socio-economic gaps at the top and bottom of the distribution of science scores, 2012 through 2022 |
|
WEB |
Table I.B1.5.38 |
Boys' mathematics performance, 2012 through 2022 |
|
WEB |
Table I.B1.5.39 |
Girls' mathematics performance, 2012 through 2022 |
|
WEB |
Table I.B1.5.40 |
Gender differences in mathematics performance, 2012 through 2022 |
|
WEB |
Table I.B1.5.41 |
Boys' reading performance, 2012 through 2022 |
|
WEB |
Table I.B1.5.42 |
Girls' reading performance, 2012 through 2022 |
|
WEB |
Table I.B1.5.43 |
Gender differences in reading performance, 2012 through 2022 |
|
WEB |
Table I.B1.5.44 |
Boys' science performance, 2012 through 2022 |
|
WEB |
Table I.B1.5.45 |
Girls' science performance, 2012 through 2022 |
|
WEB |
Table I.B1.5.46 |
Gender differences in science performance, 2012 through 2022 |
|
WEB |
Table I.B1.5.47 |
Low performance in mathematics among boys and girls, 2012 through 2022 |
|
WEB |
Table I.B1.5.48 |
Low performance in reading among boys and girls, 2012 through 2022 |
|
WEB |
Table I.B1.5.49 |
Top performance in mathematics among boys and girls, 2012 through 2022 |
|
WEB |
Table I.B1.5.50 |
Top performance in reading among boys and girls, 2012 through 2022 |
Table I.B1.7. Immigration background and student performance annex tables
|
Table I.B1.7.1 |
Percentage of students with an immigrant background in PISA 2022 |
|
|
WEB |
Table I.B1.7.2 |
Percentage of students with an immigrant background in PISA 2012, 2015 and 2018 |
|
WEB |
Table I.B1.7.3 |
Change between 2018 and 2022 in the percentage of students with an immigrant background |
|
WEB |
Table I.B1.7.4 |
Change between 2012, 2015 and 2022 in the percentage of students with an immigrant background |
|
WEB |
Table I.B1.7.5 |
Socio-economic status, by immigrant background |
|
WEB |
Table I.B1.7.6 |
Socio-economic status, by immigrant background in PISA 2012, 2015 and 2018 |
|
WEB |
Table I.B1.7.7 |
Change between 2022 and 2018 in socio-economic status, by immigrant background |
|
WEB |
Table I.B1.7.8 |
Change between 2012, 2015 and 2022 in socio-economic status, by immigrant background |
|
WEB |
Table I.B1.7.9 |
Language spoken at home by immigrant background, in PISA 2022 |
|
WEB |
Table I.B1.7.10 |
Students who do not speak the language of assessment at home by immigrant background in PISA 2012, 2015 and 2018 |
|
WEB |
Table I.B1.7.11 |
Change between 2018 and 2022 in language spoken at home by immigrant background |
|
WEB |
Table I.B1.7.12 |
Change between 2012, 2015 and 2022 in language spoken at home by immigrant background |
|
WEB |
Table I.B1.7.13 |
Age of arrival of immigrant students in 20221 |
|
WEB |
Table I.B1.7.14 |
Age of arrival of immigrant students, 2012 through 2018 |
|
WEB |
Table I.B1.7.15 |
Change between 2018 and 2022 in age of arrival of immigrant students |
|
WEB |
Table I.B1.7.16 |
Change between 2012, 2015 and 2022 in age of arrival of immigrant students |
|
Table I.B1.7.17 |
Mathematics performance of students with an immigrant background in PISA 2022 |
|
|
WEB |
Table I.B1.7.18 |
Mathematics performance of students with an immigrant background in PISA 2012, 2015 and 2018 |
|
WEB |
Table I.B1.7.19 |
Change between 2018 and 2022 in the mathematics performance of students with an immigrant background |
|
WEB |
Table I.B1.7.20 |
Change between 2012, 2015 and 2022 in the mathematics performance of students with an immigrant background |
|
WEB |
Table I.B1.7.21 |
Reading performance of students with an immigrant background in PISA 2022 |
|
WEB |
Table I.B1.7.22 |
Reading performance of students with an immigrant background in PISA 2012, 2015 and 2018 |
|
WEB |
Table I.B1.7.23 |
Change between 2018 and 2022 in the reading performance of students with an immigrant background |
|
WEB |
Table I.B1.7.24 |
Change between 2012, 2015 and 2022 in the reading performance of students with an immigrant background |
|
WEB |
Table I.B1.7.25 |
Science performance of students with an immigrant background in PISA 2022 |
|
WEB |
Table I.B1.7.26 |
Science performance of students with an immigrant background in PISA 2012, 2015 and 2018 |
|
WEB |
Table I.B1.7.27 |
Change between 2018 and 2022 in the science performance of students with an immigrant background |
|
WEB |
Table I.B1.7.28 |
Change between 2012, 2015 and 2022 in the science performance of students with an immigrant background |
|
WEB |
Table I.B1.7.29 |
Mathematics performance of students with an immigrant background by language spoken at home in PISA 2022 |
|
WEB |
Table I.B1.7.30 |
Mathematics performance of students with an immigrant background by language spoken at home in PISA 2012, 2015 and 2018 |
|
WEB |
Table I.B1.7.31 |
Change between 2018 and 2022 in the mathematics performance of students with an immigrant background by language spoken at home |
|
WEB |
Table I.B1.7.32 |
Change between 2012, 2015 and 2022 in the mathematics performance of students with an immigrant background by language spoken at home |
|
WEB |
Table I.B1.7.33 |
Reading performance of students with an immigrant background by language spoken at home in PISA 2022 |
|
WEB |
Table I.B1.7.34 |
Reading performance of students with an immigrant background by language spoken at home in PISA 2012, 2015 and 2018 |
|
WEB |
Table I.B1.7.35 |
Change between 2018 and 2022 in the reading performance of students with an immigrant background by language spoken at home |
|
WEB |
Table I.B1.7.36 |
Change between 2012, 2015 and 2022 in the reading performance of students with an immigrant background by language spoken at home |
|
WEB |
Table I.B1.7.37 |
Low performance in mathematics by immigrant background in PISA 2022 |
|
WEB |
Table I.B1.7.38 |
Low performance in mathematics, by immigrant background in PISA 2012, 2015 and 2018 |
|
WEB |
Table I.B1.7.39 |
Change between PISA 2018 and PISA 2022 in low performance in mathematics, by immigrant background |
|
WEB |
Table I.B1.7.40 |
Change between 2012, 2015 and 2022 in low performance in mathematics by immigrant background |
|
WEB |
Table I.B1.7.41 |
Low performance in reading by immigrant background in PISA 2022 |
|
WEB |
Table I.B1.7.42 |
Low performance in reading by immigrant background in PISA 2012, 2015 and 2018 |
|
WEB |
Table I.B1.7.43 |
Change between 2018 and 2022 in low performance in reading by immigrant background |
|
WEB |
Table I.B1.7.44 |
Change between 2012, 2015 and 2022 in low performance in reading by immigrant background |
|
WEB |
Table I.B1.7.45 |
Low performance in science by immigrant background in PISA 2022 |
|
WEB |
Table I.B1.7.46 |
Low performance in science by immigrant background in PISA 2012, 2015 and 2018 |
|
WEB |
Table I.B1.7.47 |
Change between 2018 and 2022 in low performance in science by immigrant background |
|
WEB |
Table I.B1.7.48 |
Change between 2012, 2015 and 2022 in low performance in science by immigrant background |
|
WEB |
Table I.B1.7.49 |
Inter-decile range in immigrant students' mathematics scores, 2012 through 2022 |
|
WEB |
Table I.B1.7.50 |
Inter-decile range in non-immigrant students' mathematics scores, 2012 through 2022 |
|
WEB |
Table I.B1.7.51 |
Differences in inter-decile range in mathematics performance by immigration background, 2012 through 2022 |
|
WEB |
Table I.B1.7.52 |
Difference in mathematics performance, by immigrant background, after accounting for student socio-economic background and language spoken at home in PISA 2022 |
|
WEB |
Table I.B1.7.53 |
Difference in mathematics performance, by immigrant background, after accounting for student socio-economic background and language spoken at home, 2012 through 2022 |
|
WEB |
Table I.B1.7.54 |
Inter-decile range in immigrant students' reading scores, 2012 through 2022 |
|
WEB |
Table I.B1.7.55 |
Inter-decile range in non-immigrant students' reading scores, 2012 through 2022 |
|
WEB |
Table I.B1.7.56 |
Differences in inter-decile range in reading performance by immigrant background, 2012 through 2022 |
|
WEB |
Table I.B1.7.57 |
Difference in reading performance, by immigrant background, after accounting for student socio-economic background and language spoken at home in PISA 2022 |
|
WEB |
Table I.B1.7.58 |
Difference in reading performance, by immigrant background, after accounting for student socio-economic background and language spoken at home, 2012 through 2022 |