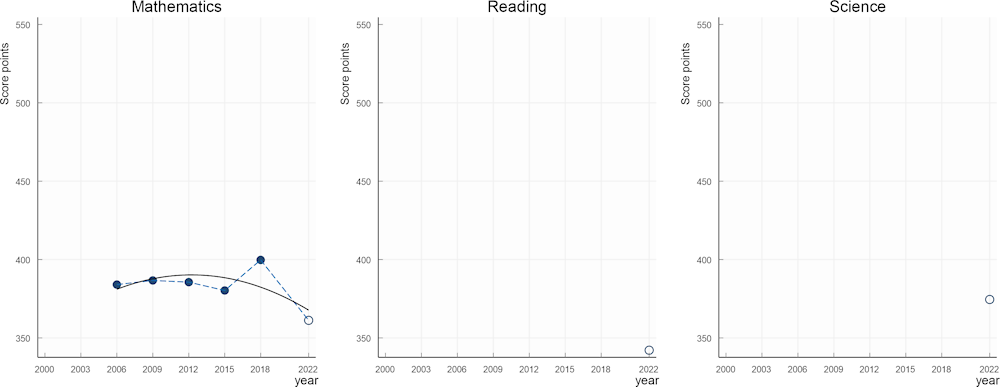
Note: Argentina switched from paper to computer assessment in 2022.
PISA 2022 Results (Volume I)
The State of Learning and Equity in Education
PISA

Annex D. Overview of Performance Trends
Table I.D.1. Overview of trends in mathematics, reading and science performance
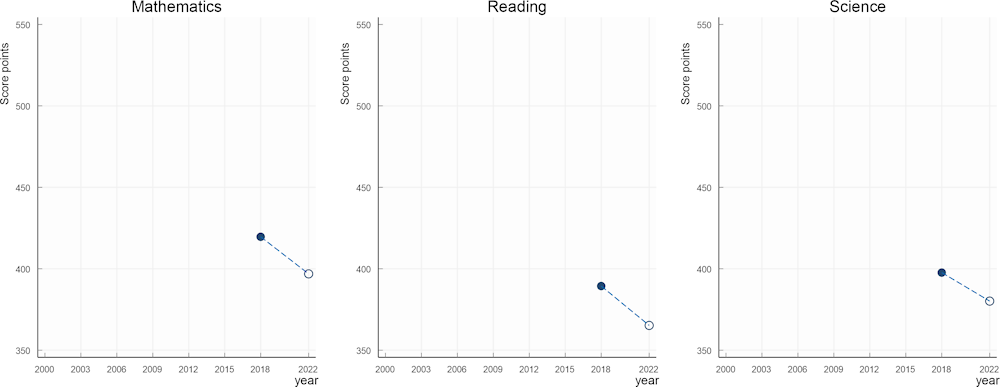
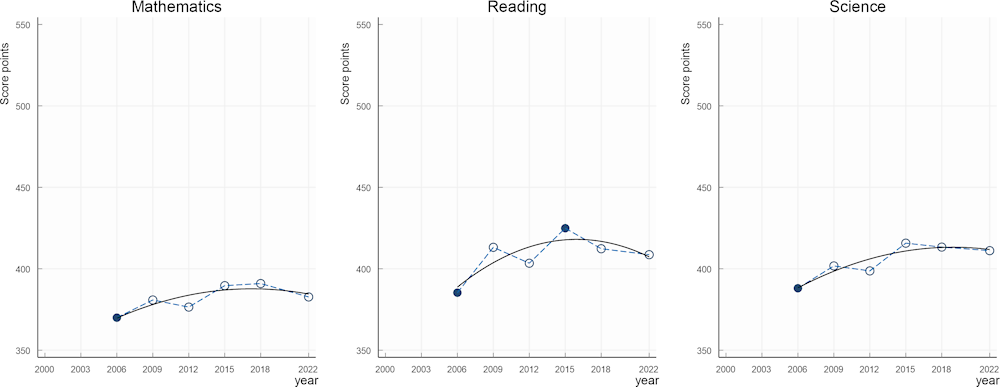
Overview of performance trends in Albania
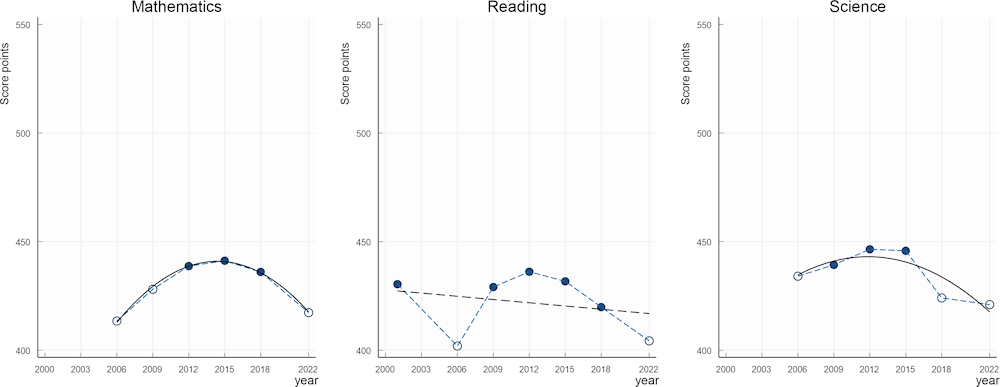
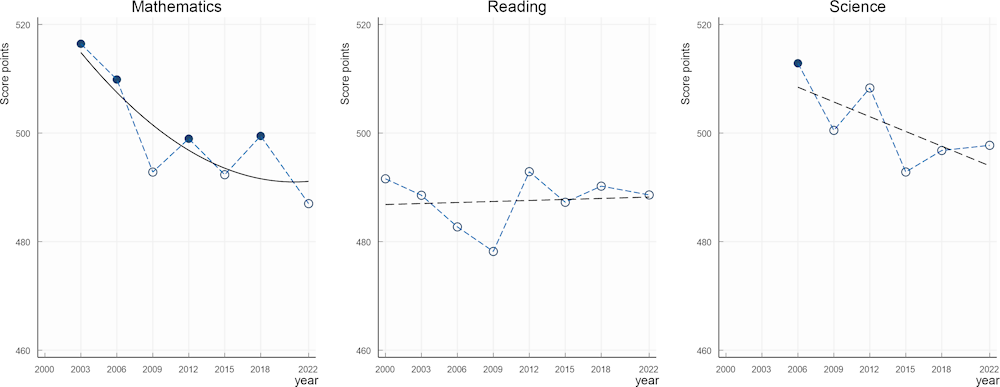
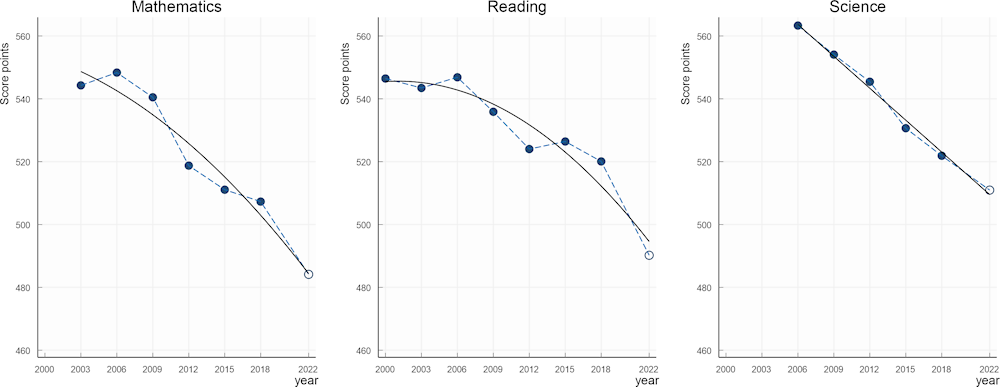
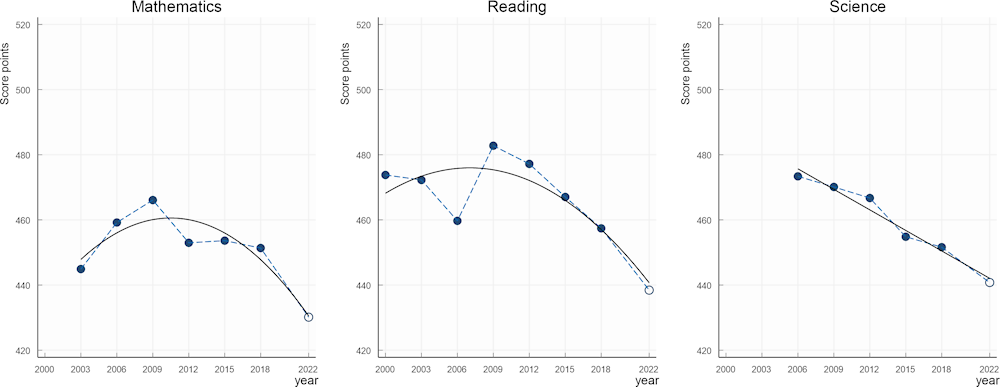
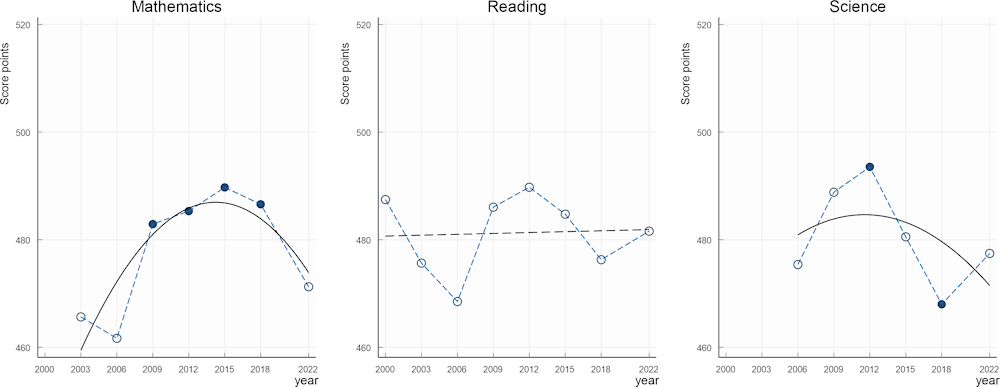
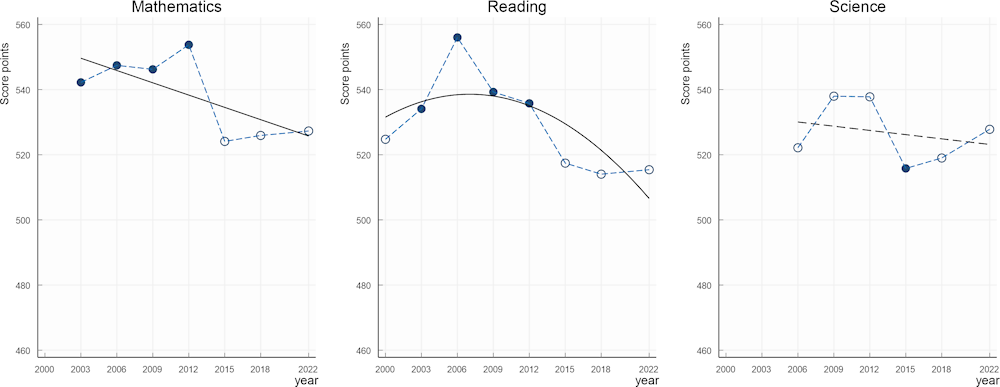
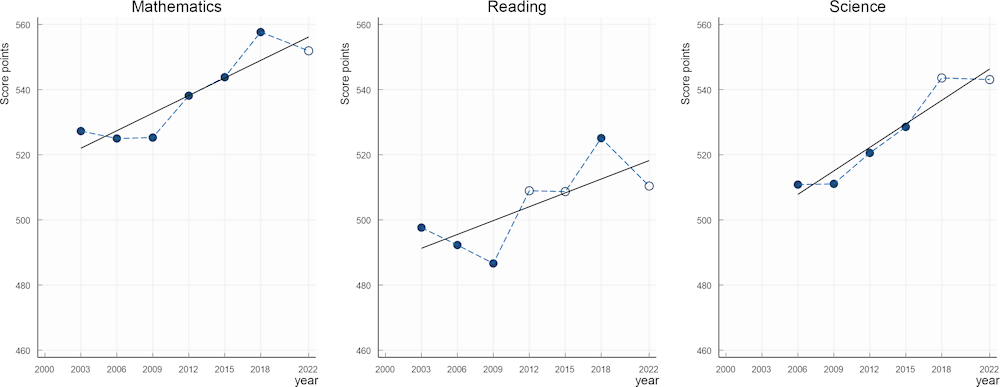
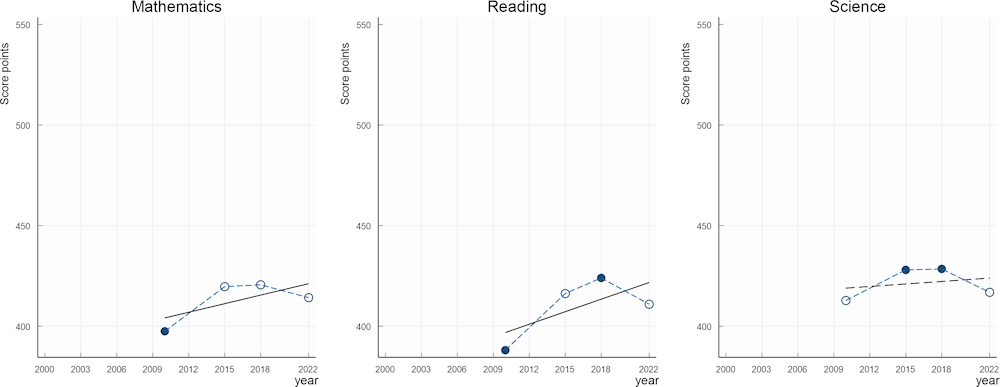
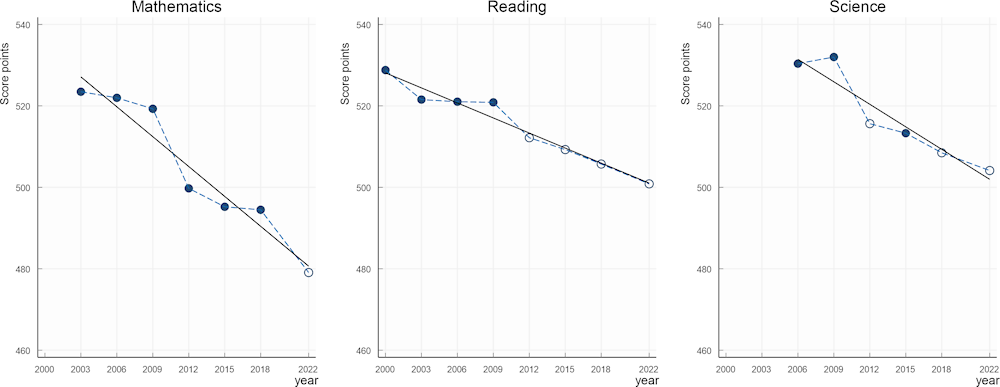
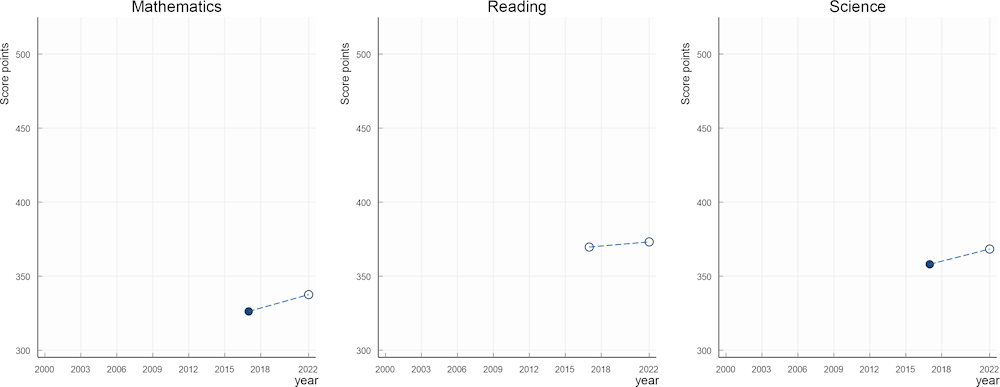
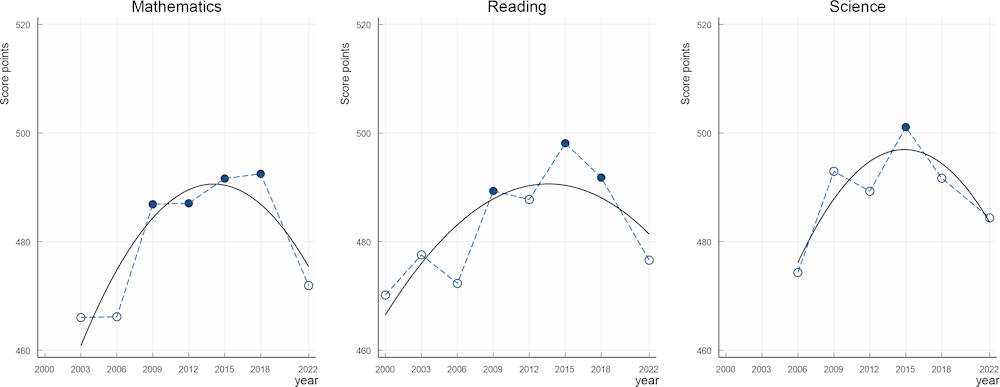
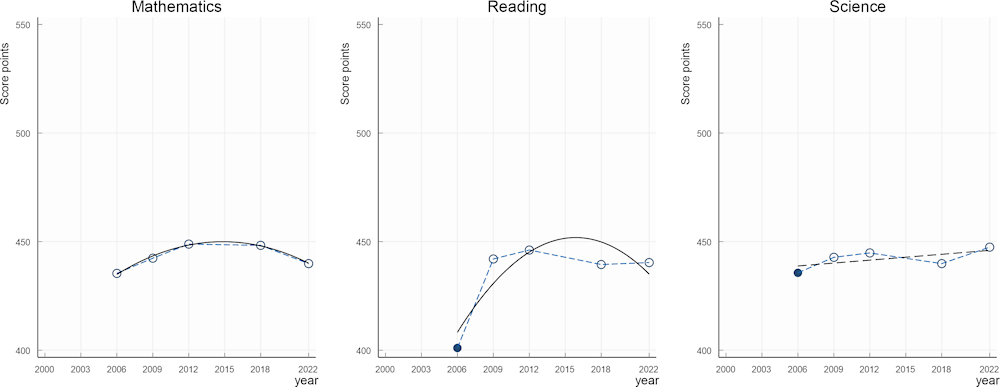
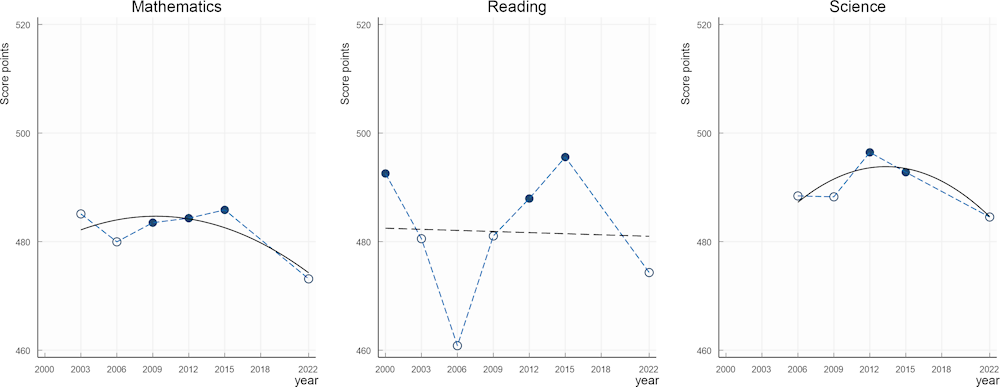
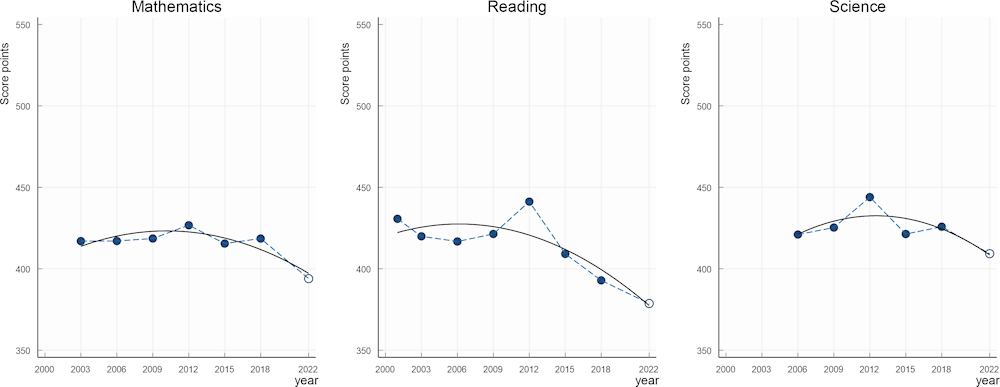
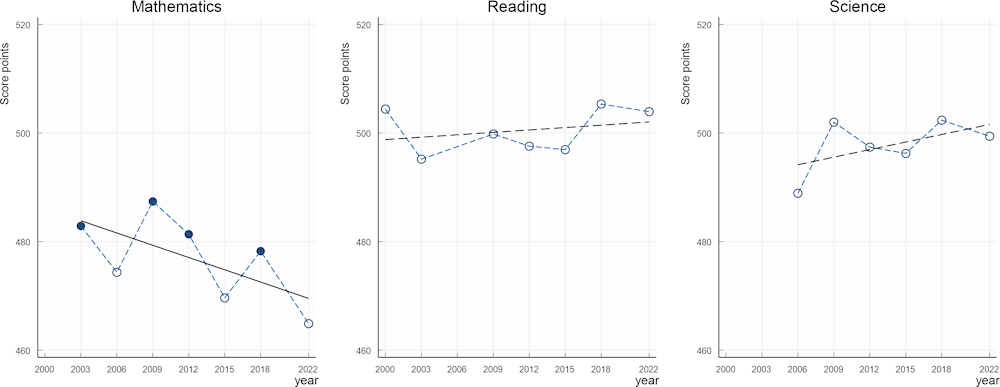
Trends in mathematics, reading and science performance in Albania
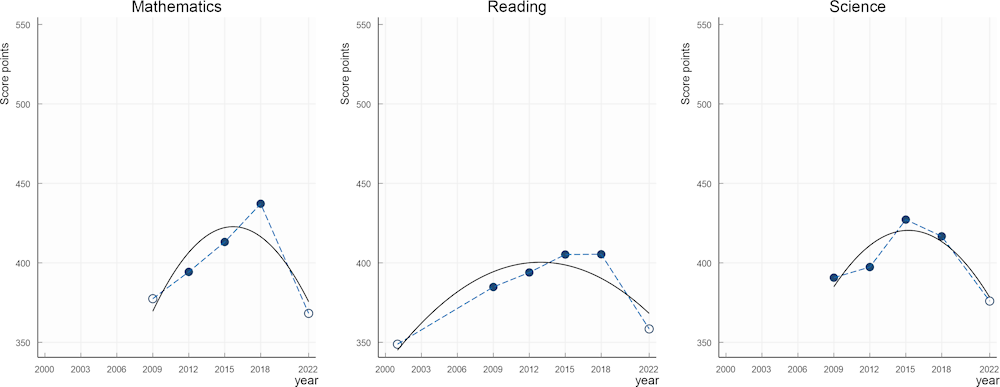
Note: White dots indicate mean-performance estimates that are not statistically significantly above/below PISA 2022 estimates. Black lines indicate the best-fitting trend.
Source: OECD, PISA 2022 Database, Tables I.B1.5.4, I.B1.5.5 and I.B1.5.6.
Snapshot of mathematics, reading and science results for Albania
Note: * indicates statistically significant trends and changes or mean-performance estimates that are significantly above or below PISA 2022 estimates.
Source: PISA 2022 Database, Tables I.B1.5.1-12, I.B1.5.19, I.B1.5.20 and I.B1.5.21.
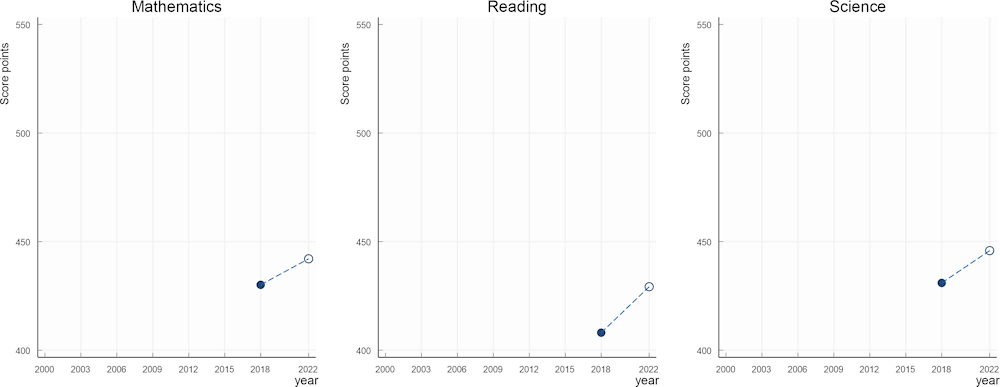
Overview of performance trends in Argentina
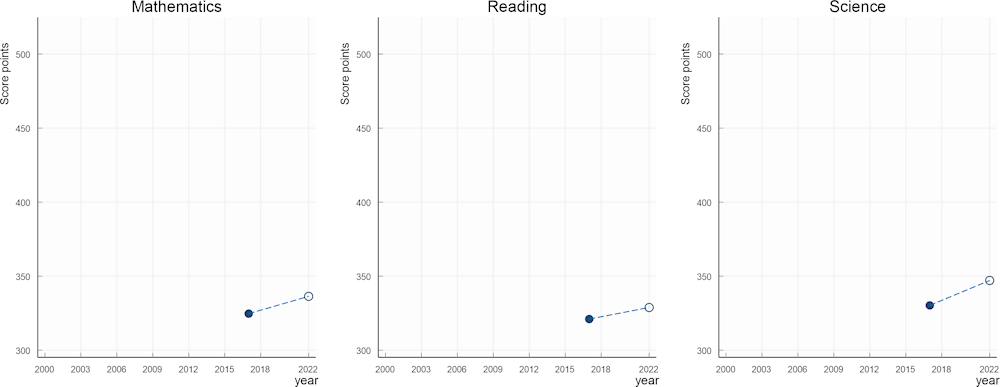
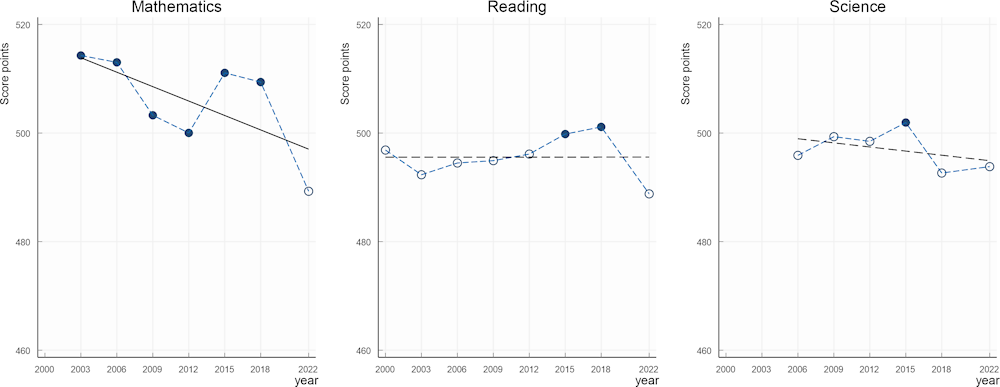
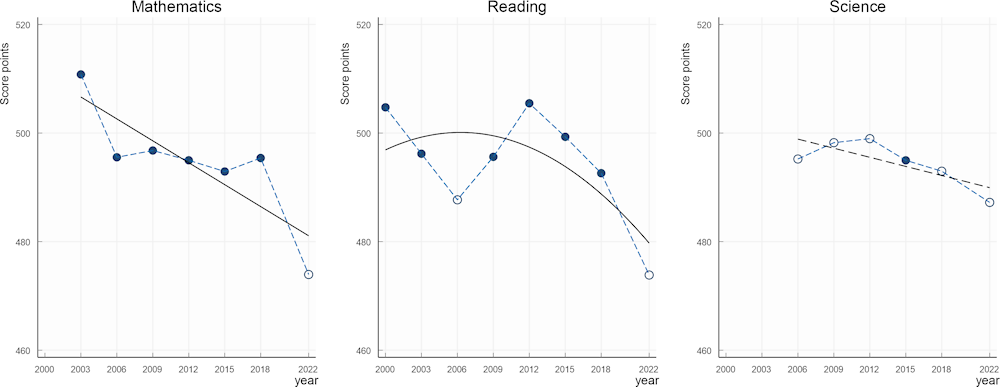
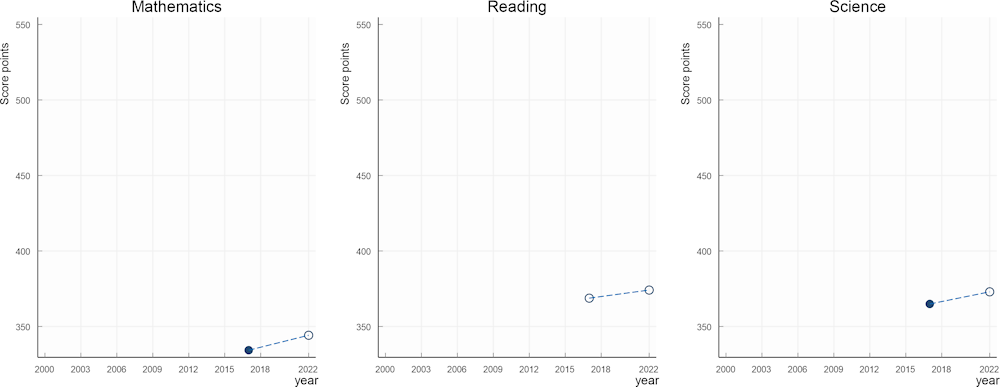
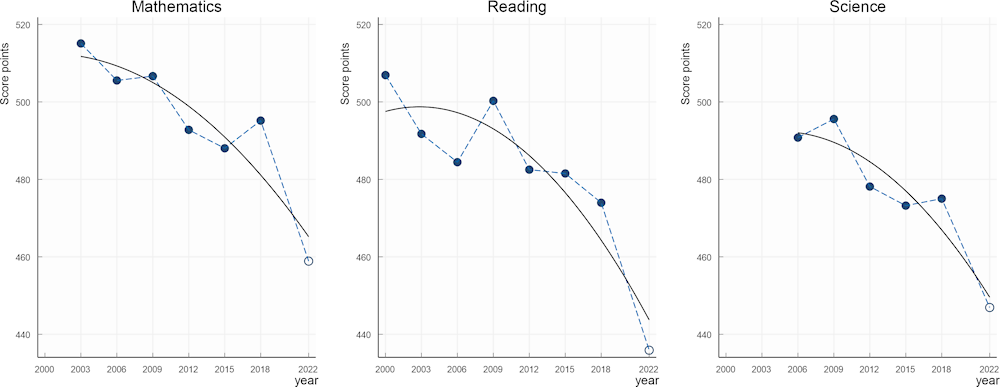
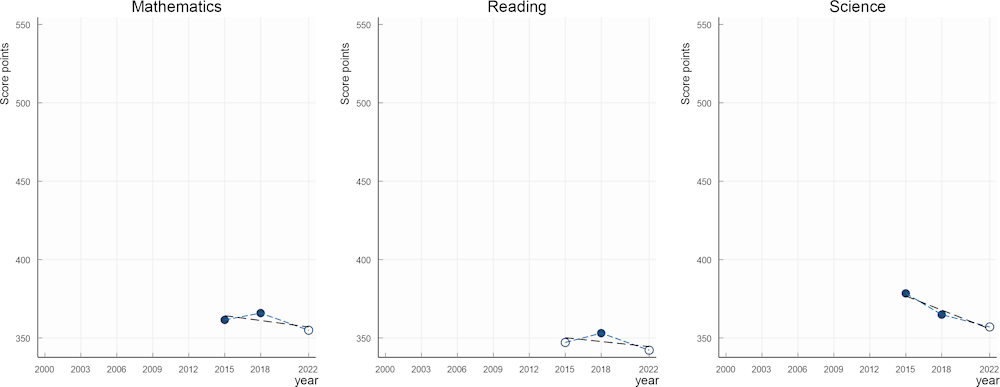
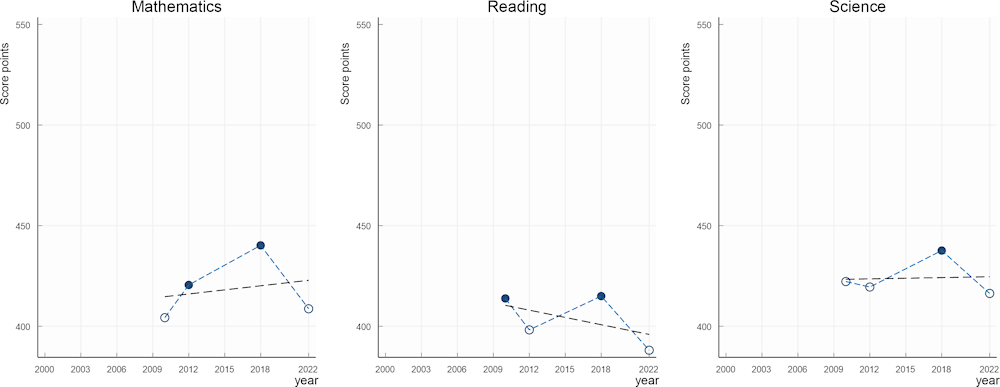
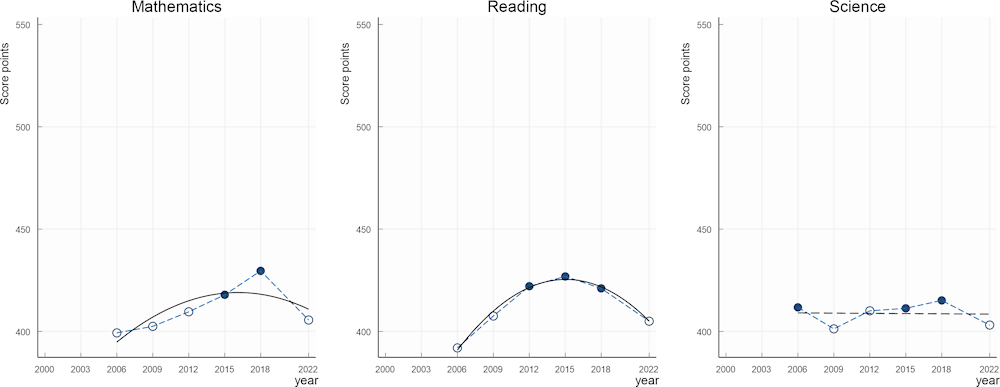
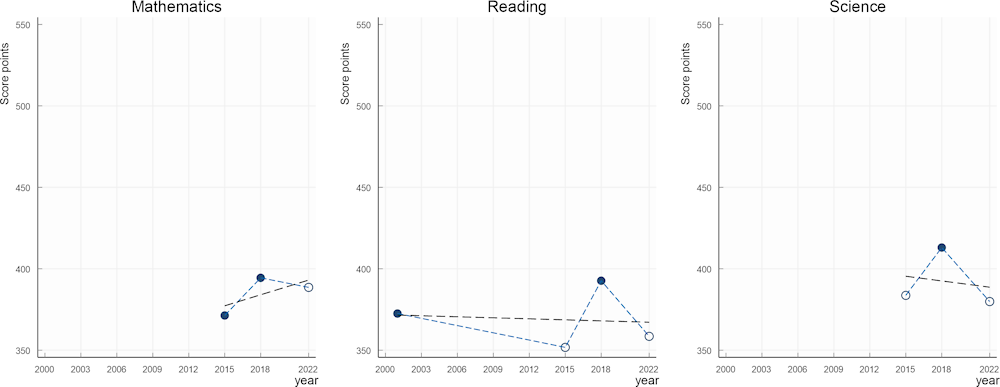
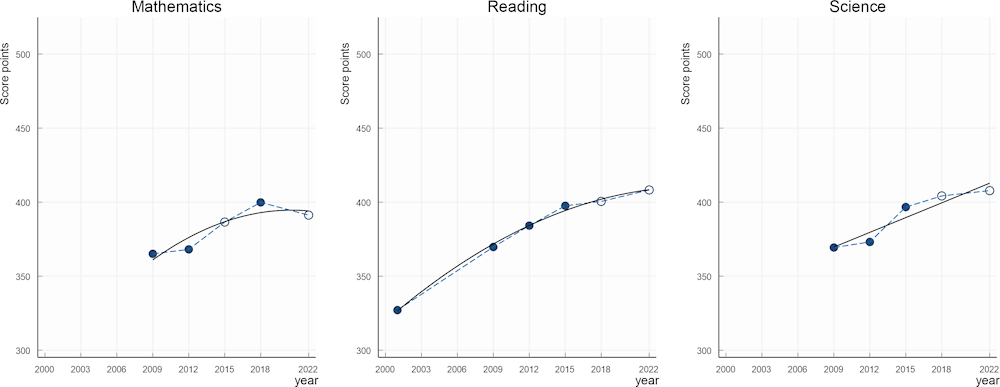
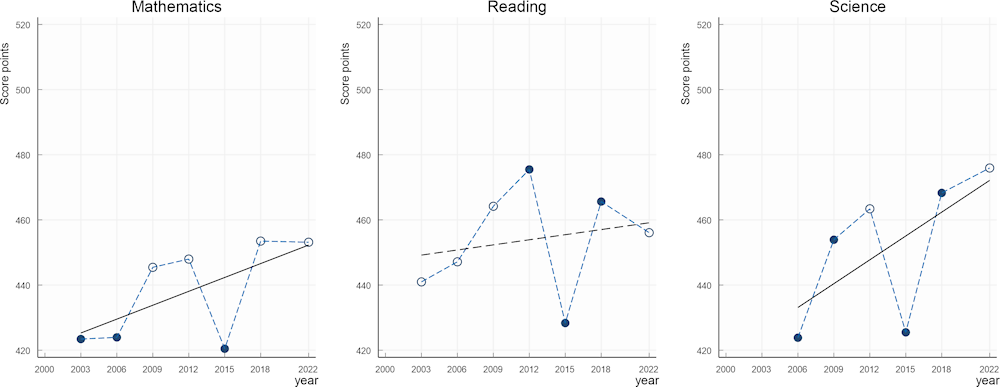
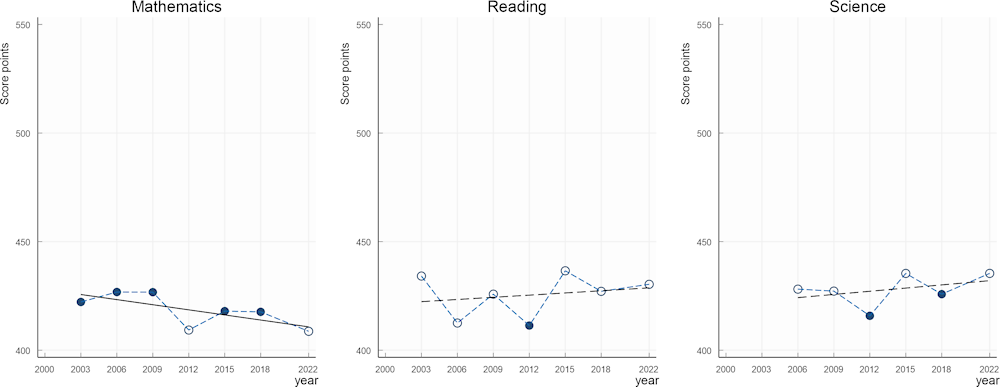
Trends in mathematics, reading and science performance in Argentina
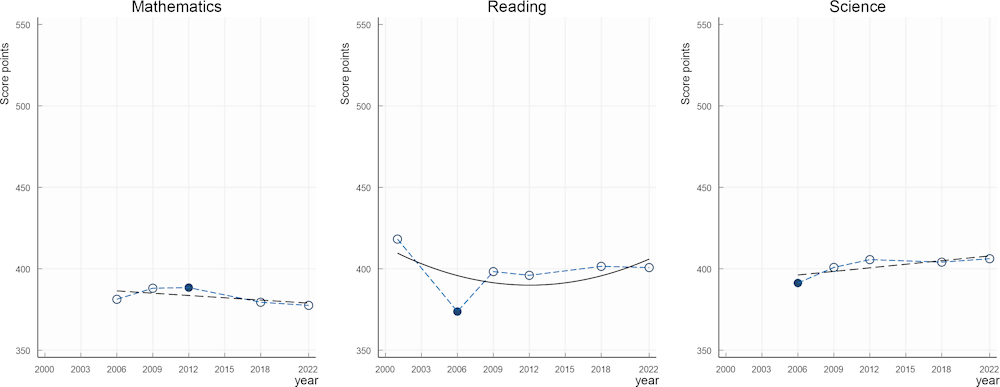
Note: White dots indicate mean-performance estimates that are not statistically significantly above/below PISA 2022 estimates. Black lines indicate the best-fitting trend.
Source: OECD, PISA 2022 Database, Tables I.B1.5.4, I.B1.5.5 and I.B1.5.6.
Snapshot of mathematics, reading and science results for Argentina
Note: * indicates statistically significant trends and changes or mean-performance estimates that are significantly above or below PISA 2022 estimates.
Source: PISA 2022 Database, Tables I.B1.5.1-12, I.B1.5.19, I.B1.5.20 and I.B1.5.21.
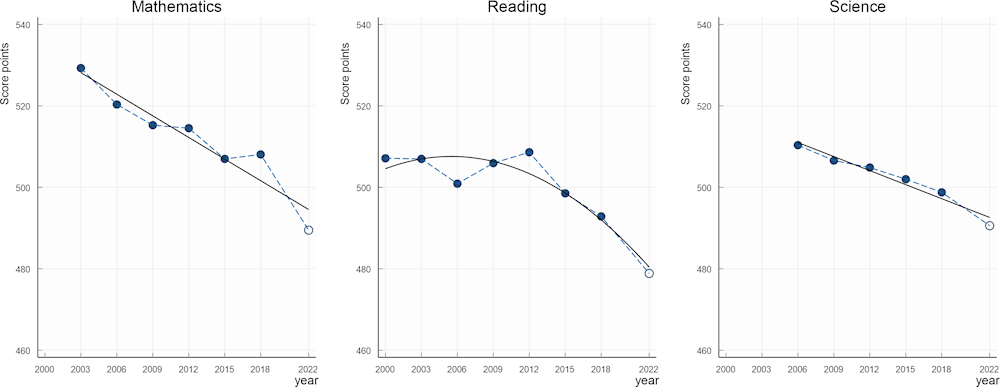
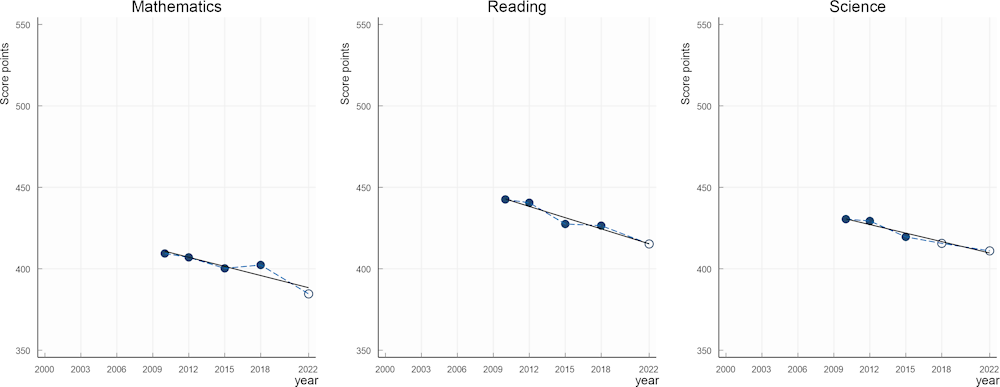
Overview of performance trends in Australia
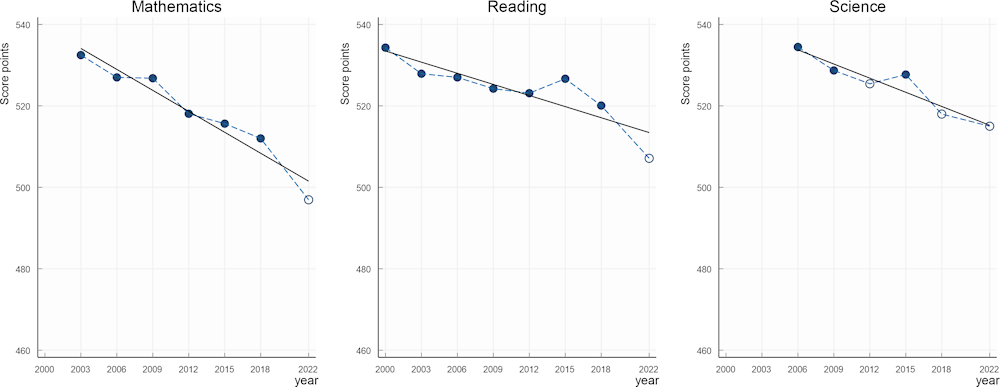
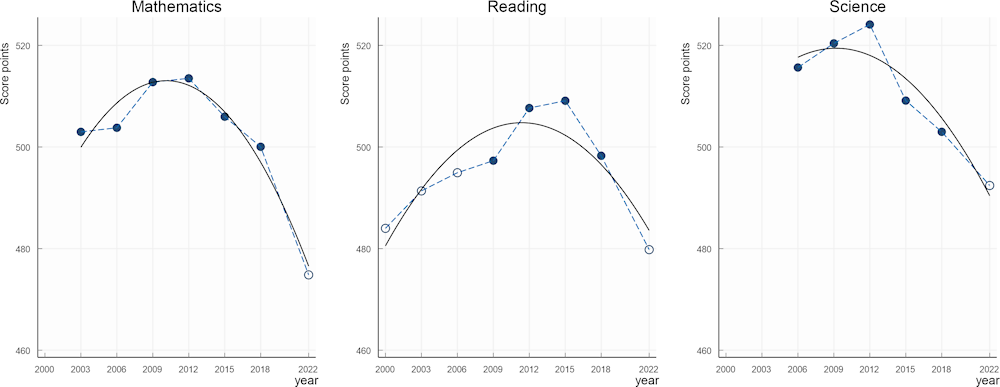
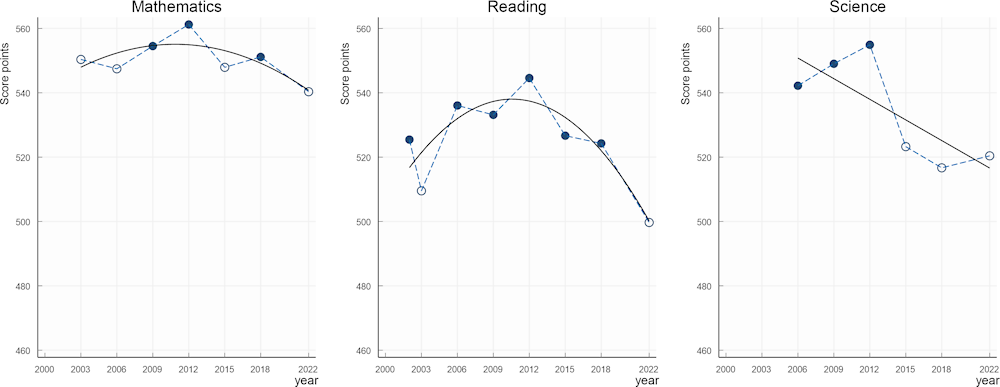
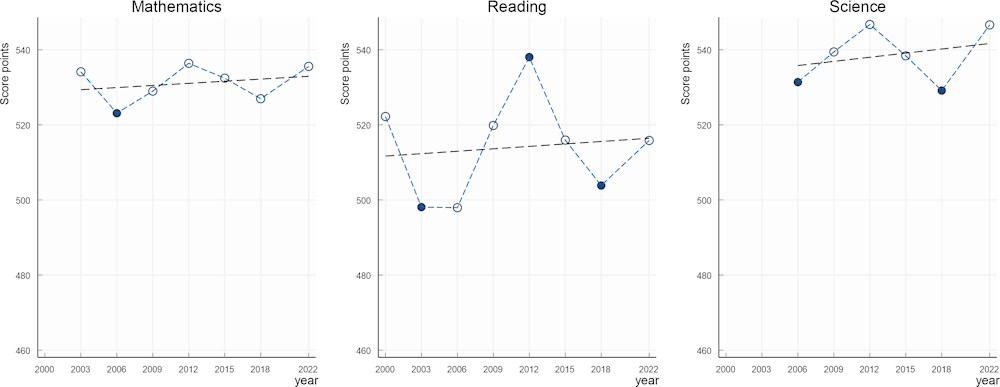
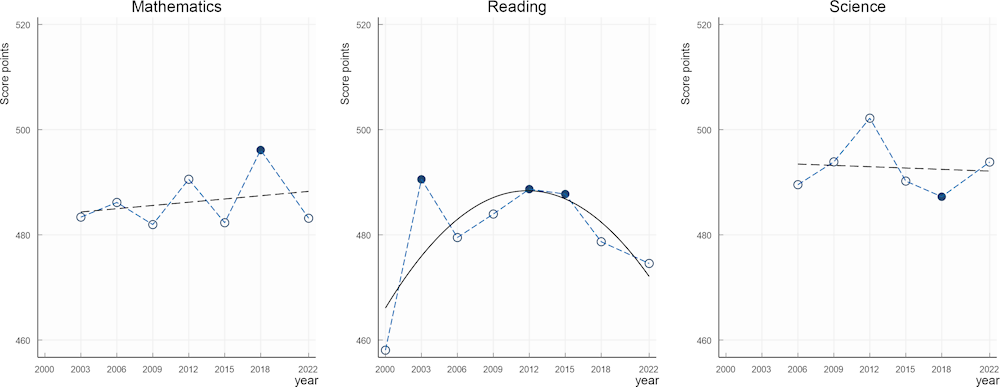
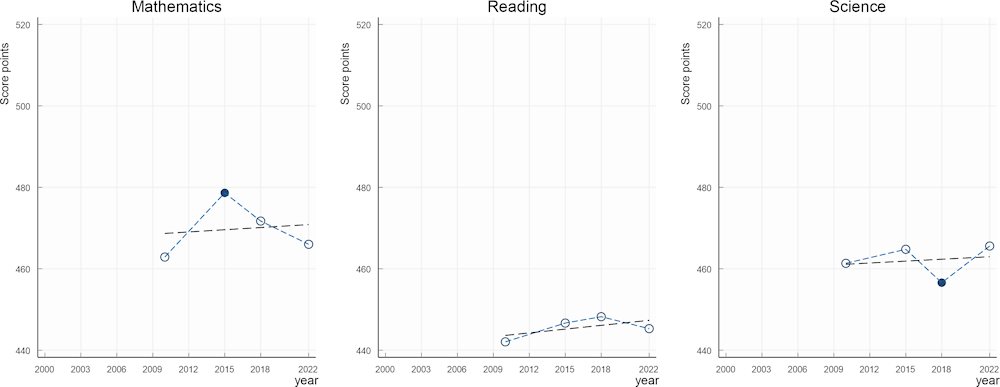
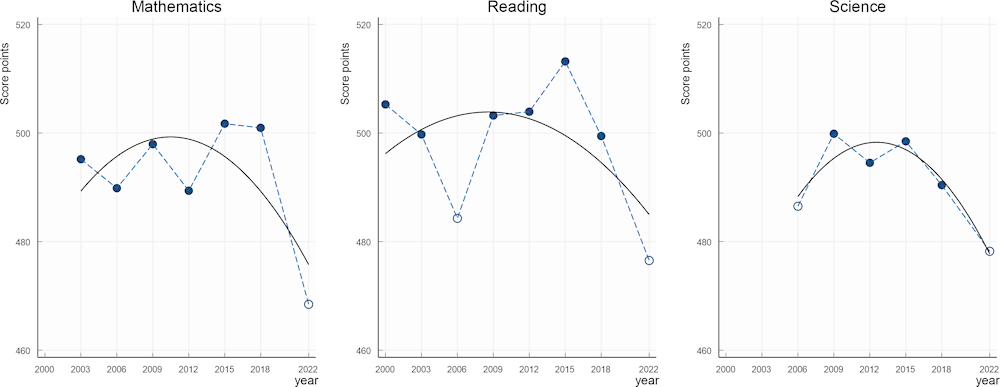
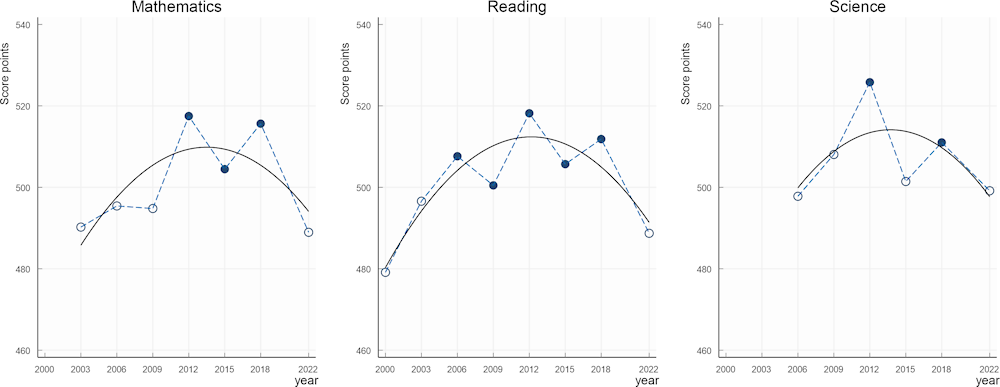
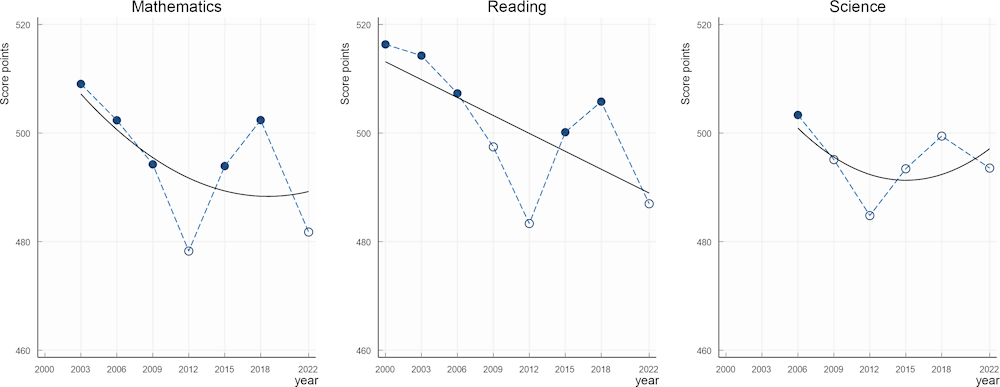
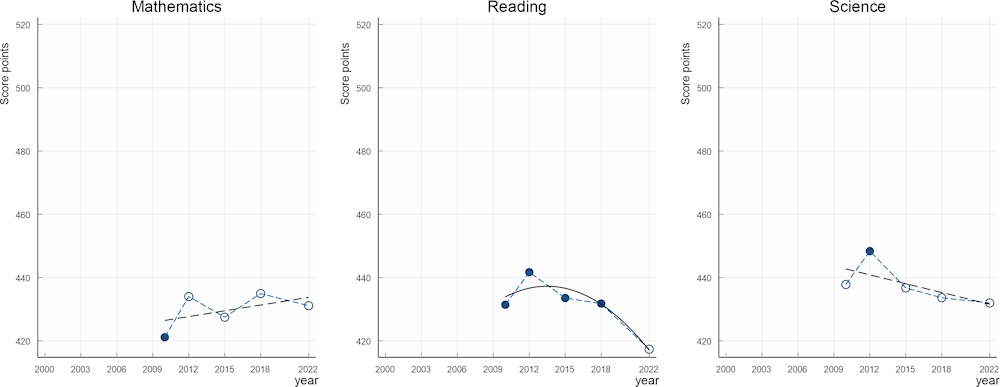
Trends in mathematics, reading and science performance in Australia
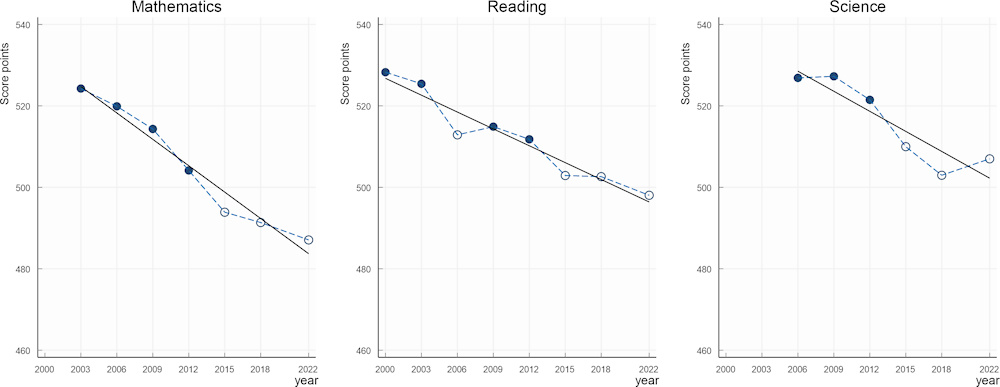
Note: White dots indicate mean-performance estimates that are not statistically significantly above/below PISA 2022 estimates. Black lines indicate the best-fitting trend.
Source: OECD, PISA 2022 Database, Tables I.B1.5.4, I.B1.5.5 and I.B1.5.6.
Snapshot of mathematics, reading and science results for Australia
Note: * indicates statistically significant trends and changes or mean-performance estimates that are significantly above or below PISA 2022 estimates.
Source: PISA 2022 Database, Tables I.B1.5.1-12, I.B1.5.19, I.B1.5.20 and I.B1.5.21.
Note: In 2022, student response rates decreased with respect to PISA 2018. A technically sound non-response bias analysis was submitted; however, the strength of the evidence was limited by the fact that no external student-level achievement variables could be used in the analysis. Based on the available evidence and experience of other countries participating in PISA, a small residual upward bias could not be excluded even though non-response adjustments likely limited its severity.
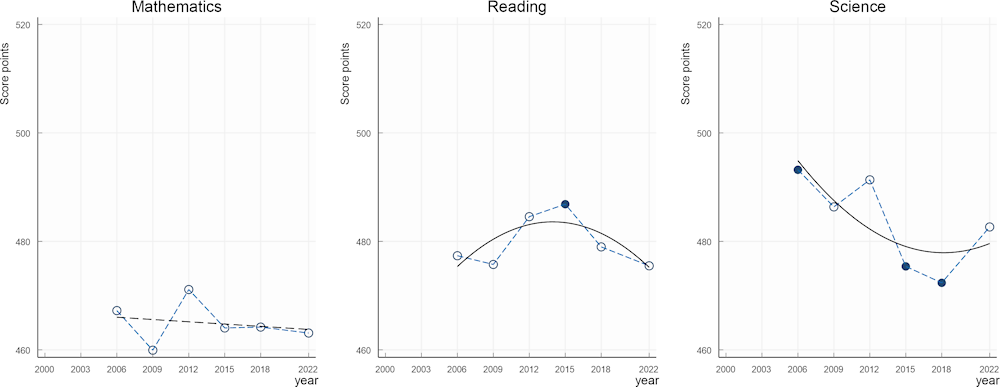
Overview of performance trends in Austria
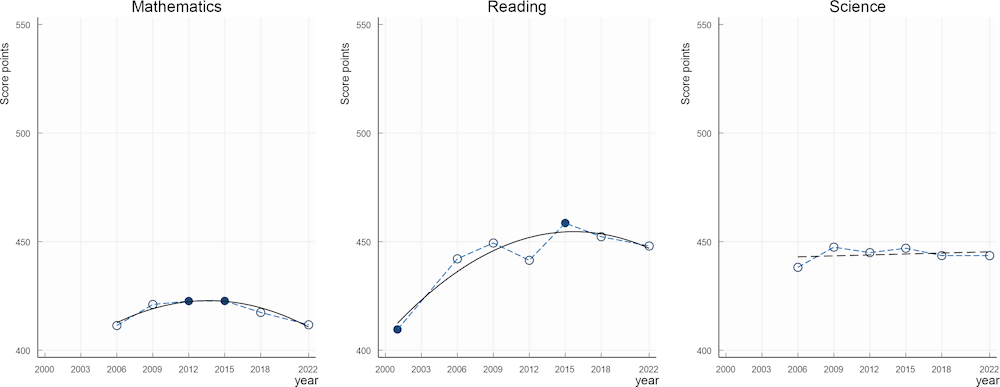
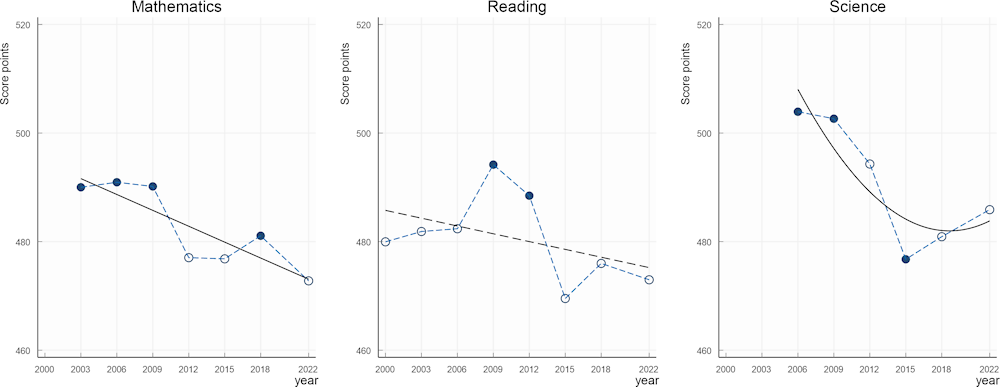
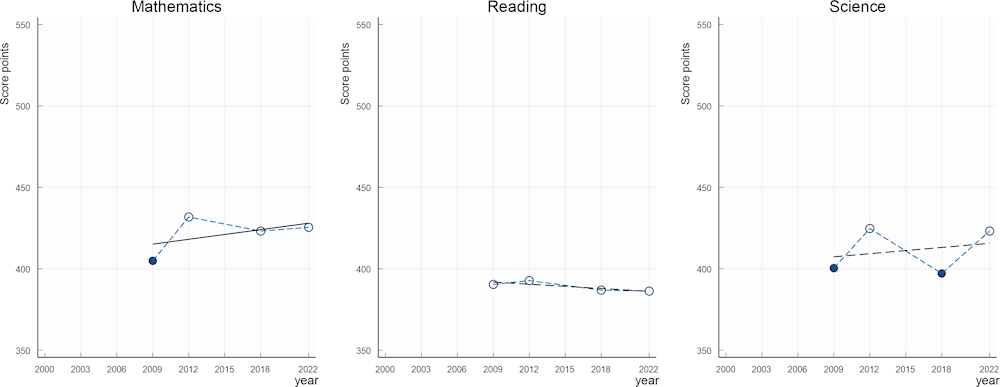
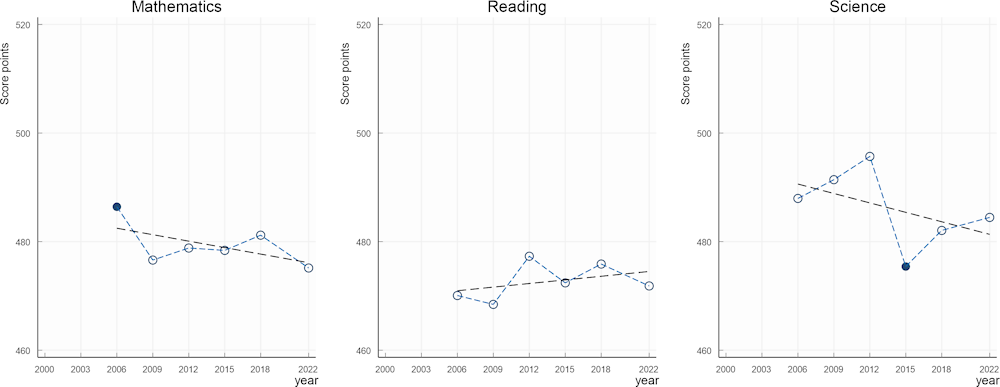
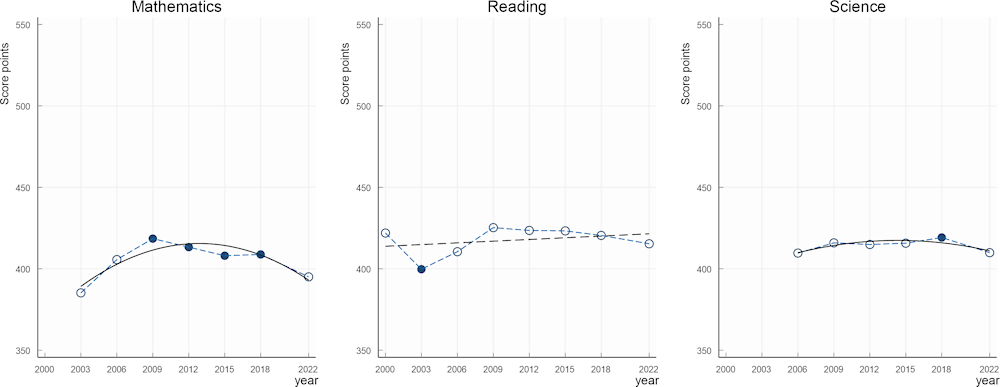
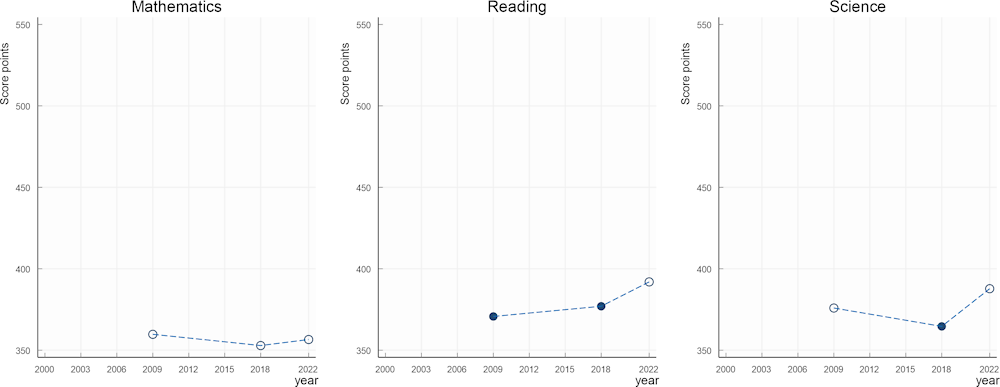
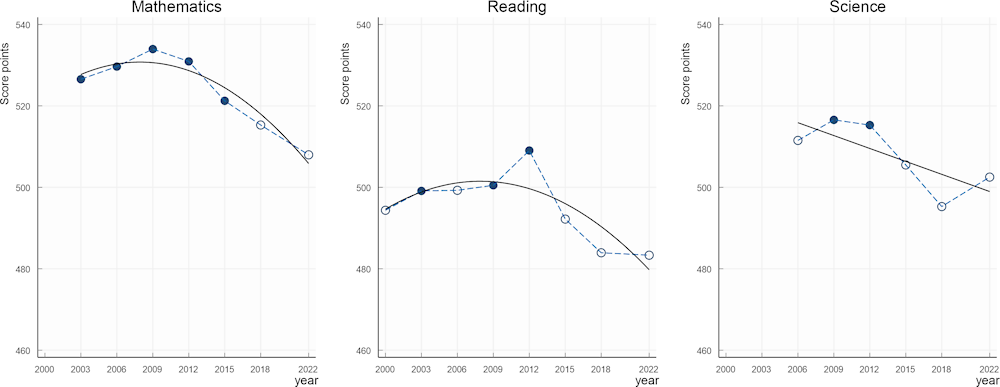
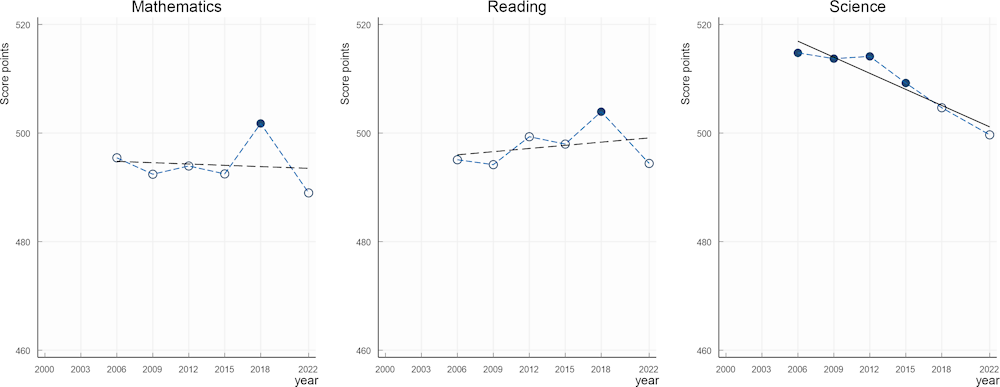
Trends in mathematics, reading and science performance in Austria
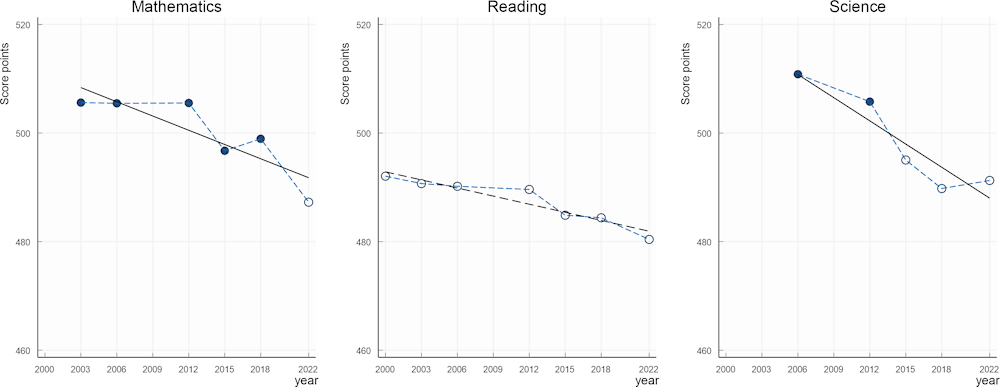
Note: White dots indicate mean-performance estimates that are not statistically significantly above/below PISA 2022 estimates. Black lines indicate the best-fitting trend.
Source: OECD, PISA 2022 Database, Tables I.B1.5.4, I.B1.5.5 and I.B1.5.6.
Snapshot of mathematics, reading and science results for Austria
Note: * indicates statistically significant trends and changes or mean-performance estimates that are significantly above or below PISA 2022 estimates.
Source: PISA 2022 Database, Tables I.B1.5.1-12, I.B1.5.19, I.B1.5.20 and I.B1.5.21.
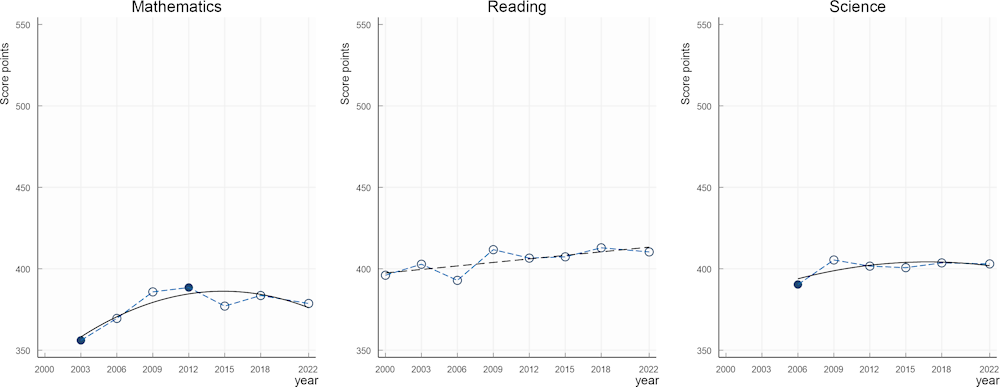
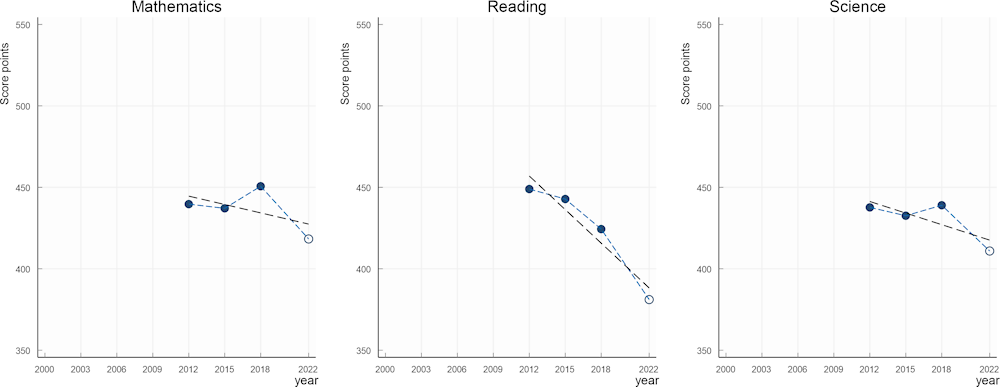
Overview of performance trends in Baku (Azerbaijan)
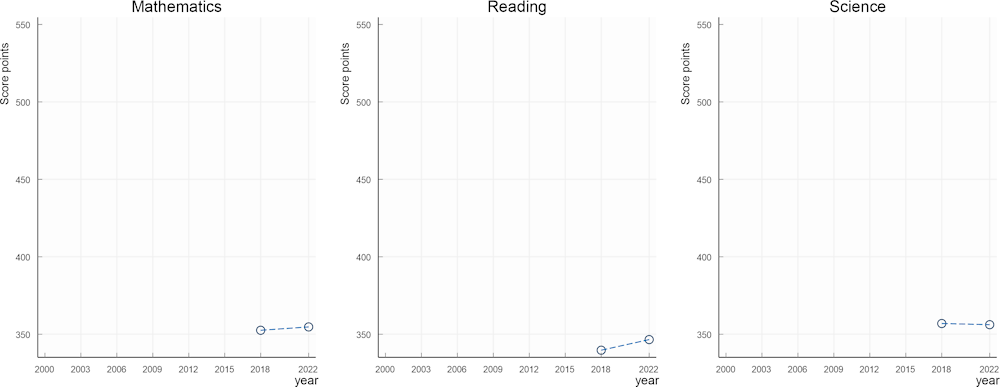
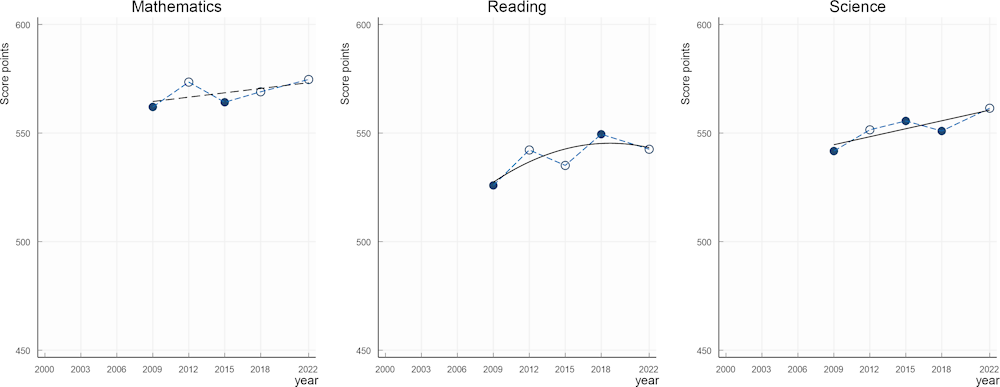
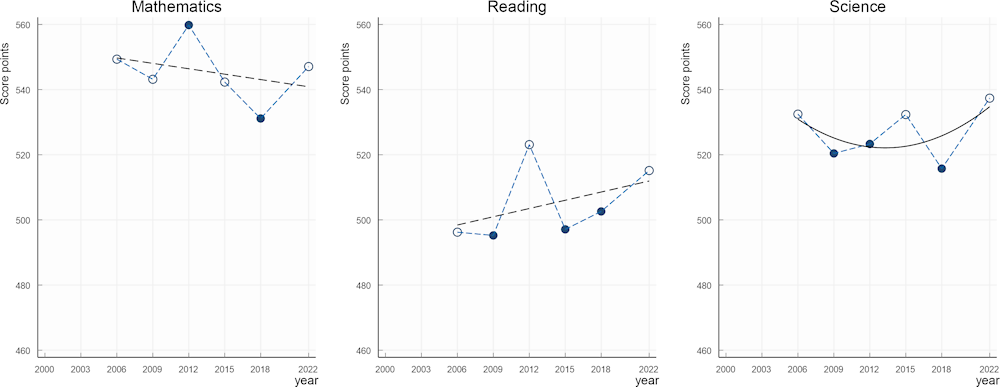
Trends in mathematics, reading and science performance in Baku (Azerbaijan)
Note: White dots indicate mean-performance estimates that are not statistically significantly above/below PISA 2022 estimates.
Source: OECD, PISA 2022 Database, Tables I.B1.5.4, I.B1.5.5 and I.B1.5.6.
Snapshot of mathematics, reading and science results for Baku (Azerbaijan)
Note: * indicates statistically significant trends and changes or mean-performance estimates that are significantly above or below PISA 2022 estimates.
Source: PISA 2022 Database, Tables I.B1.5.1-12, I.B1.5.19, I.B1.5.20 and I.B1.5.21.
Overview of performance trends in Belgium
Trends in mathematics, reading and science performance in Belgium
Note: White dots indicate mean-performance estimates that are not statistically significantly above/below PISA 2022 estimates. Black lines indicate the best-fitting trend.
Source: OECD, PISA 2022 Database, Tables I.B1.5.4, I.B1.5.5 and I.B1.5.6.
Snapshot of mathematics, reading and science results for Belgium
Note: * indicates statistically significant trends and changes or mean-performance estimates that are significantly above or below PISA 2022 estimates.
Source: PISA 2022 Database, Tables I.B1.5.1-12, I.B1.5.19, I.B1.5.20 and I.B1.5.21.
Overview of performance trends in Brazil
Trends in mathematics, reading and science performance in Brazil
Note: White dots indicate mean-performance estimates that are not statistically significantly above/below PISA 2022 estimates. Black lines indicate the best-fitting trend.
Source: OECD, PISA 2022 Database, Tables I.B1.5.4, I.B1.5.5 and I.B1.5.6.
Snapshot of mathematics, reading and science results for Brazil
Note: * indicates statistically significant trends and changes or mean-performance estimates that are significantly above or below PISA 2022 estimates.
Source: PISA 2022 Database, Tables I.B1.5.1-12, I.B1.5.19, I.B1.5.20 and I.B1.5.21.
Overview of performance trends in Brunei Darussalam
Trends in mathematics, reading and science performance in Brunei Darussalam
Note: White dots indicate mean-performance estimates that are not statistically significantly above/below PISA 2022 estimates.
Source: OECD, PISA 2022 Database, Tables I.B1.5.4, I.B1.5.5 and I.B1.5.6.
Snapshot of mathematics, reading and science results for Brunei Darussalam
Note: * indicates statistically significant trends and changes or mean-performance estimates that are significantly above or below PISA 2022 estimates.
Source: PISA 2022 Database, Tables I.B1.5.1-12, I.B1.5.19, I.B1.5.20 and I.B1.5.21.
Overview of performance trends in Bulgaria
Trends in mathematics, reading and science performance in Bulgaria
Note: White dots indicate mean-performance estimates that are not statistically significantly above/below PISA 2022 estimates. Black lines indicate the best-fitting trend.
Source: OECD, PISA 2022 Database, Tables I.B1.5.4, I.B1.5.5 and I.B1.5.6.
Snapshot of mathematics, reading and science results for Bulgaria
Note: * indicates statistically significant trends and changes or mean-performance estimates that are significantly above or below PISA 2022 estimates.
Source: PISA 2022 Database, Tables I.B1.5.1-12, I.B1.5.19, I.B1.5.20 and I.B1.5.21.
Overview of performance trends in Cambodia
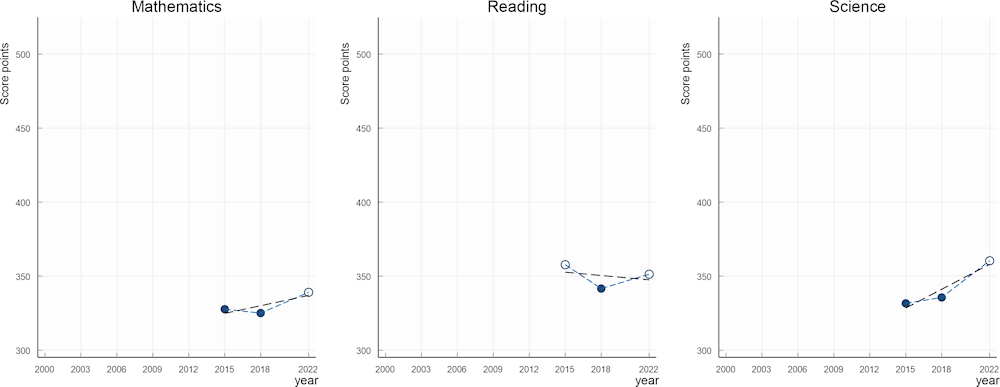
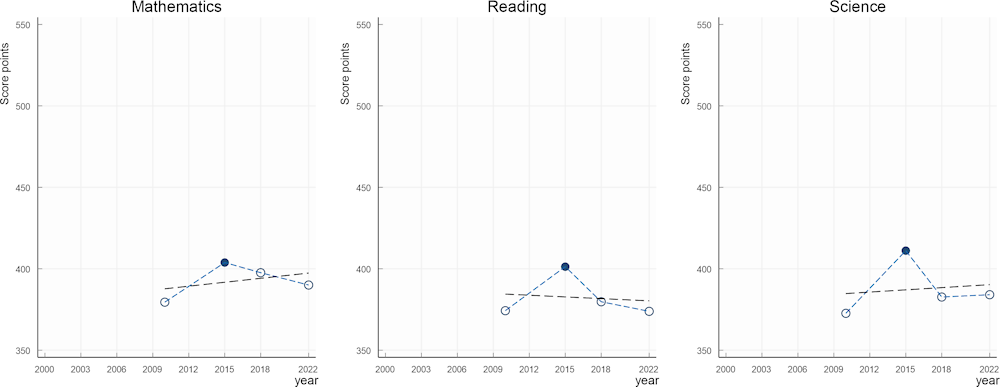
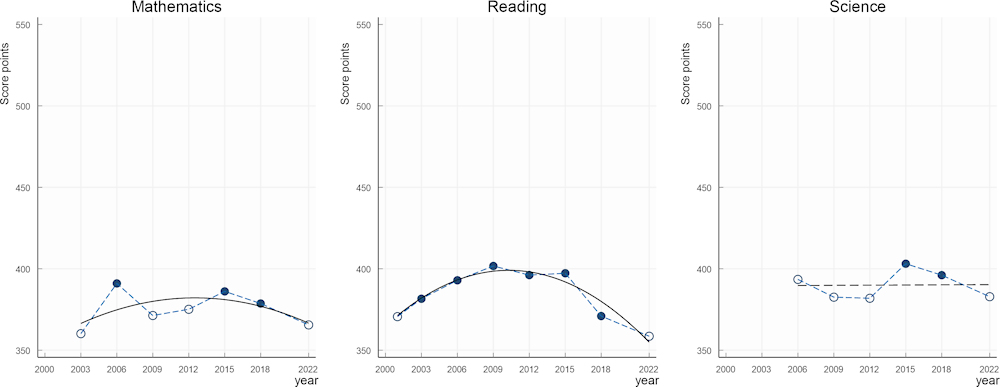
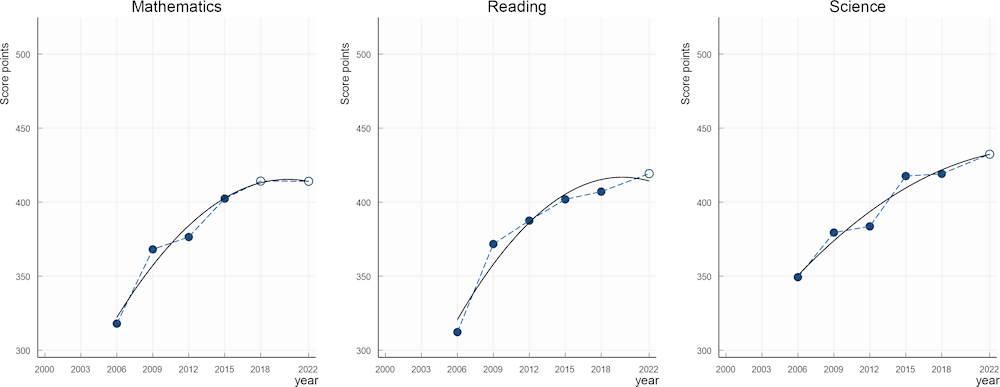
Trends in mathematics, reading and science performance in Cambodia
Note: White dots indicate mean-performance estimates that are not statistically significantly above/below PISA 2022 estimates.
Source: OECD, PISA 2022 Database, Tables I.B1.5.4, I.B1.5.5 and I.B1.5.6.
Snapshot of mathematics, reading and science results for Cambodia
Note: * indicates statistically significant trends and changes or mean-performance estimates that are significantly above or below PISA 2022 estimates.
Source: PISA 2022 Database, Tables I.B1.5.1-12, I.B1.5.19, I.B1.5.20 and I.B1.5.21.
Note: Results for 2018 refer to the results of the PISA for Development assessment, in 2017. The testing period (previously around December) was moved toaround June in 2022.
Overview of performance trends in Canada
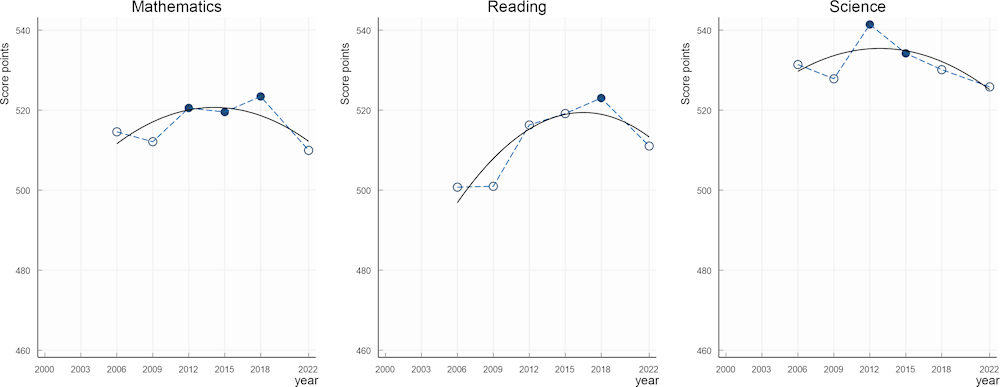
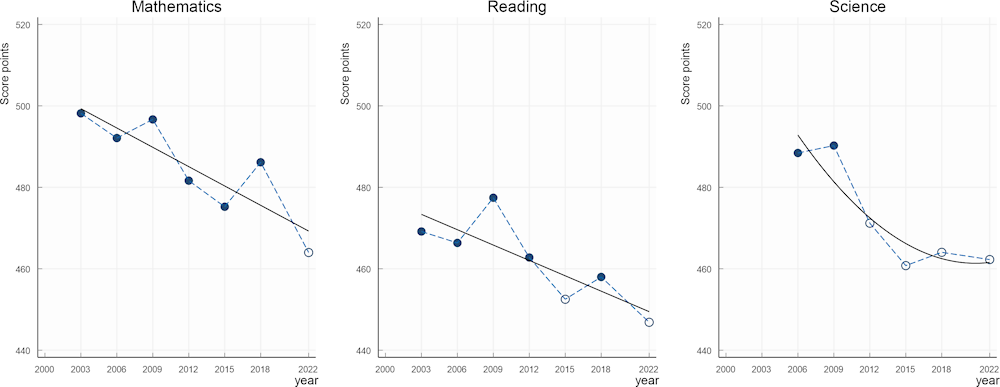
Trends in mathematics, reading and science performance in Canada
Note: White dots indicate mean-performance estimates that are not statistically significantly above/below PISA 2022 estimates. Black lines indicate the best-fitting trend.
Source: OECD, PISA 2022 Database, Tables I.B1.5.4, I.B1.5.5 and I.B1.5.6.
Snapshot of mathematics, reading and science results for Canada
Note: * indicates statistically significant trends and changes or mean-performance estimates that are significantly above or below PISA 2022 estimates.
Source: PISA 2022 Database, Tables I.B1.5.1-12, I.B1.5.19, I.B1.5.20 and I.B1.5.21.
Note: In 2022, student response rates decreased with respect to PISA 2018, and fell short of the target in 7 out of 10 provinces (all but New Brunswick, Prince Edward Island and Saskatchewan). School response rates also fell short of the target. The analyses clearly indicate that school non-response has not led to any appreciable bias, but student non-response has given rise to a small upwards bias. For more information, see the Reader’s Guide in this Volume.
Overview of performance trends in Chile
Trends in mathematics, reading and science performance in Chile
Note: White dots indicate mean-performance estimates that are not statistically significantly above/below PISA 2022 estimates. Black lines indicate the best-fitting trend.
Source: OECD, PISA 2022 Database, Tables I.B1.5.4, I.B1.5.5 and I.B1.5.6.
Snapshot of mathematics, reading and science results for Chile
Note: * indicates statistically significant trends and changes or mean-performance estimates that are significantly above or below PISA 2022 estimates.
Source: PISA 2022 Database, Tables I.B1.5.1-12, I.B1.5.19, I.B1.5.20 and I.B1.5.21.
Overview of performance trends in Colombia
Trends in mathematics, reading and science performance in Colombia
Note: White dots indicate mean-performance estimates that are not statistically significantly above/below PISA 2022 estimates. Black lines indicate the best-fitting trend.
Source: OECD, PISA 2022 Database, Tables I.B1.5.4, I.B1.5.5 and I.B1.5.6.
Snapshot of mathematics, reading and science results for Colombia
Note: * indicates statistically significant trends and changes or mean-performance estimates that are significantly above or below PISA 2022 estimates.
Source: PISA 2022 Database, Tables I.B1.5.1-12, I.B1.5.19, I.B1.5.20 and I.B1.5.21.
Overview of performance trends in Costa Rica
Trends in mathematics, reading and science performance in Costa Rica
Note: White dots indicate mean-performance estimates that are not statistically significantly above/below PISA 2022 estimates. Black lines indicate the best-fitting trend.
Source: OECD, PISA 2022 Database, Tables I.B1.5.4, I.B1.5.5 and I.B1.5.6.
Snapshot of mathematics, reading and science results for Costa Rica
Note: * indicates statistically significant trends and changes or mean-performance estimates that are significantly above or below PISA 2022 estimates.
Source: PISA 2022 Database, Tables I.B1.5.1-12, I.B1.5.19, I.B1.5.20 and I.B1.5.21.
Overview of performance trends in Croatia
Trends in mathematics, reading and science performance in Croatia
Note: White dots indicate mean-performance estimates that are not statistically significantly above/below PISA 2022 estimates. Black lines indicate the best-fitting trend.
Source: OECD, PISA 2022 Database, Tables I.B1.5.4, I.B1.5.5 and I.B1.5.6.
Snapshot of mathematics, reading and science results for Croatia
Note: * indicates statistically significant trends and changes or mean-performance estimates that are significantly above or below PISA 2022 estimates.
Source: PISA 2022 Database, Tables I.B1.5.1-12, I.B1.5.19, I.B1.5.20 and I.B1.5.21.
Overview of performance trends in Cyprus
Trends in mathematics, reading and science performance in Cyprus
Note: White dots indicate mean-performance estimates that are not statistically significantly above/below PISA 2022 estimates. Black lines indicate the best-fitting trend.
Source: OECD, PISA 2022 Database, Tables I.B1.5.4, I.B1.5.5 and I.B1.5.6.
Snapshot of mathematics, reading and science results for Cyprus
Note: * indicates statistically significant trends and changes or mean-performance estimates that are significantly above or below PISA 2022 estimates.
Source: PISA 2022 Database, Tables I.B1.5.1-12, I.B1.5.19, I.B1.5.20 and I.B1.5.21.
Overview of performance trends in Czech Republic
Trends in mathematics, reading and science performance in Czech Republic
Note: White dots indicate mean-performance estimates that are not statistically significantly above/below PISA 2022 estimates. Black lines indicate the best-fitting trend.
Source: OECD, PISA 2022 Database, Tables I.B1.5.4, I.B1.5.5 and I.B1.5.6.
Snapshot of mathematics, reading and science results for Czech Republic
Note: * indicates statistically significant trends and changes or mean-performance estimates that are significantly above or below PISA 2022 estimates.
Source: PISA 2022 Database, Tables I.B1.5.1-12, I.B1.5.19, I.B1.5.20 and I.B1.5.21.
Overview of performance trends in Denmark
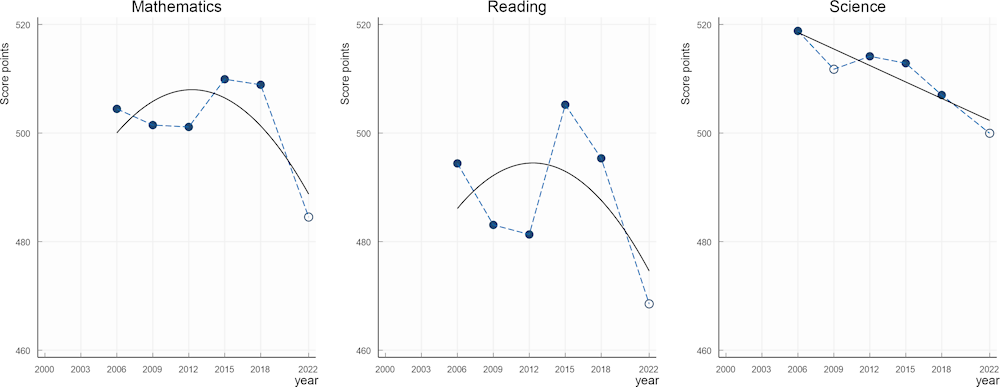
Trends in mathematics, reading and science performance in Denmark
Note: White dots indicate mean-performance estimates that are not statistically significantly above/below PISA 2022 estimates. Black lines indicate the best-fitting trend.
Source: OECD, PISA 2022 Database, Tables I.B1.5.4, I.B1.5.5 and I.B1.5.6.
Snapshot of mathematics, reading and science results for Denmark
Note: * indicates statistically significant trends and changes or mean-performance estimates that are significantly above or below PISA 2022 estimates.
Source: PISA 2022 Database, Tables I.B1.5.1-12, I.B1.5.19, I.B1.5.20 and I.B1.5.21.
Note: In 2022, exclusions from the sample exceeded the acceptable rate by a large margin and showed a marked increase with respect to 2018. High levels of student exclusions may bias performance results upwards. In Denmark, a major reason for the rise appears to be the increased share of students with diagnosed dyslexia and the fact that more of these students are using electronic assistive devices to help them read on the screen, including during exams. The lack of such an accommodation in PISA led schools to exclude many of these students.
Overview of performance trends in Dominican Republic
Trends in mathematics, reading and science performance in Dominican Republic
Note: White dots indicate mean-performance estimates that are not statistically significantly above/below PISA 2022 estimates. Black lines indicate the best-fitting trend.
Source: OECD, PISA 2022 Database, Tables I.B1.5.4, I.B1.5.5 and I.B1.5.6.
Snapshot of mathematics, reading and science results for Dominican Republic
Note: * indicates statistically significant trends and changes or mean-performance estimates that are significantly above or below PISA 2022 estimates.
Source: PISA 2022 Database, Tables I.B1.5.1-12, I.B1.5.19, I.B1.5.20 and I.B1.5.21.
Overview of performance trends in Estonia
Trends in mathematics, reading and science performance in Estonia
Note: White dots indicate mean-performance estimates that are not statistically significantly above/below PISA 2022 estimates. Black lines indicate the best-fitting trend.
Source: OECD, PISA 2022 Database, Tables I.B1.5.4, I.B1.5.5 and I.B1.5.6.
Snapshot of mathematics, reading and science results for Estonia
Note: * indicates statistically significant trends and changes or mean-performance estimates that are significantly above or below PISA 2022 estimates.
Source: PISA 2022 Database, Tables I.B1.5.1-12, I.B1.5.19, I.B1.5.20 and I.B1.5.21.
Overview of performance trends in Finland
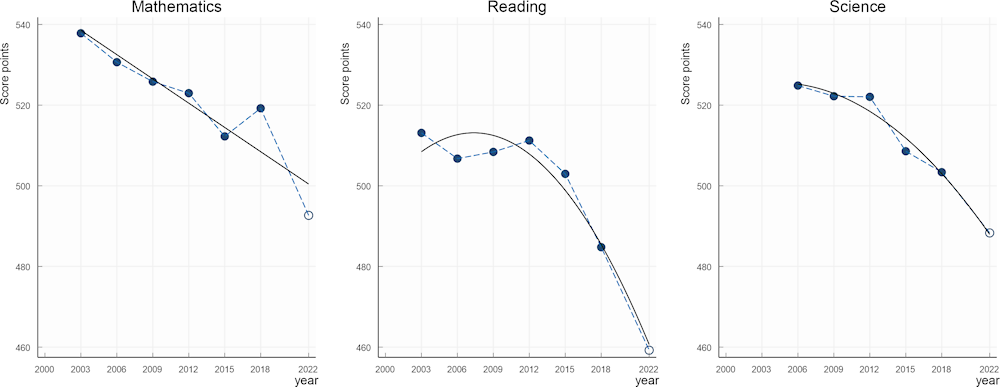
Trends in mathematics, reading and science performance in Finland
Note: White dots indicate mean-performance estimates that are not statistically significantly above/below PISA 2022 estimates. Black lines indicate the best-fitting trend.
Source: OECD, PISA 2022 Database, Tables I.B1.5.4, I.B1.5.5 and I.B1.5.6.
Snapshot of mathematics, reading and science results for Finland
Note: * indicates statistically significant trends and changes or mean-performance estimates that are significantly above or below PISA 2022 estimates.
Source: PISA 2022 Database, Tables I.B1.5.1-12, I.B1.5.19, I.B1.5.20 and I.B1.5.21.
Overview of performance trends in France
Trends in mathematics, reading and science performance in France
Note: White dots indicate mean-performance estimates that are not statistically significantly above/below PISA 2022 estimates. Black lines indicate the best-fitting trend.
Source: OECD, PISA 2022 Database, Tables I.B1.5.4, I.B1.5.5 and I.B1.5.6.
Snapshot of mathematics, reading and science results for France
Note: * indicates statistically significant trends and changes or mean-performance estimates that are significantly above or below PISA 2022 estimates.
Source: PISA 2022 Database, Tables I.B1.5.1-12, I.B1.5.19, I.B1.5.20 and I.B1.5.21.
Overview of performance trends in Georgia
Trends in mathematics, reading and science performance in Georgia
Note: White dots indicate mean-performance estimates that are not statistically significantly above/below PISA 2022 estimates. Black lines indicate the best-fitting trend.
Source: OECD, PISA 2022 Database, Tables I.B1.5.4, I.B1.5.5 and I.B1.5.6.
Snapshot of mathematics, reading and science results for Georgia
Note: * indicates statistically significant trends and changes or mean-performance estimates that are significantly above or below PISA 2022 estimates.
Source: PISA 2022 Database, Tables I.B1.5.1-12, I.B1.5.19, I.B1.5.20 and I.B1.5.21.
Overview of performance trends in Germany
Trends in mathematics, reading and science performance in Germany
Note: White dots indicate mean-performance estimates that are not statistically significantly above/below PISA 2022 estimates. Black lines indicate the best-fitting trend.
Source: OECD, PISA 2022 Database, Tables I.B1.5.4, I.B1.5.5 and I.B1.5.6.
Snapshot of mathematics, reading and science results for Germany
Note: * indicates statistically significant trends and changes or mean-performance estimates that are significantly above or below PISA 2022 estimates.
Source: PISA 2022 Database, Tables I.B1.5.1-12, I.B1.5.19, I.B1.5.20 and I.B1.5.21.
Overview of performance trends in Greece
Trends in mathematics, reading and science performance in Greece
Note: White dots indicate mean-performance estimates that are not statistically significantly above/below PISA 2022 estimates. Black lines indicate the best-fitting trend.
Source: OECD, PISA 2022 Database, Tables I.B1.5.4, I.B1.5.5 and I.B1.5.6.
Snapshot of mathematics, reading and science results for Greece
Note: * indicates statistically significant trends and changes or mean-performance estimates that are significantly above or below PISA 2022 estimates.
Source: PISA 2022 Database, Tables I.B1.5.1-12, I.B1.5.19, I.B1.5.20 and I.B1.5.21.
Overview of performance trends in Guatemala
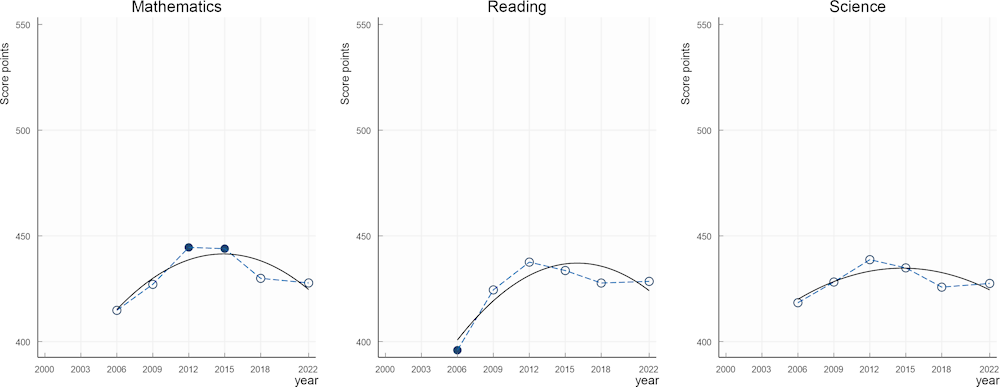
Trends in mathematics, reading and science performance in Guatemala
Note: White dots indicate mean-performance estimates that are not statistically significantly above/below PISA 2022 estimates.
Source: OECD, PISA 2022 Database, Tables I.B1.5.4, I.B1.5.5 and I.B1.5.6.
Snapshot of mathematics, reading and science results for Guatemala
Note: * indicates statistically significant trends and changes or mean-performance estimates that are significantly above or below PISA 2022 estimates.
Source: PISA 2022 Database, Tables I.B1.5.1-12, I.B1.5.19, I.B1.5.20 and I.B1.5.21.
Note: Results for 2018 refer to the results of the PISA for Development assessment in 2017.
Overview of performance trends in Hong Kong (China)
Trends in mathematics, reading and science performance in Hong Kong (China)
Note: White dots indicate mean-performance estimates that are not statistically significantly above/below PISA 2022 estimates. Black lines indicate the best-fitting trend.
Source: OECD, PISA 2022 Database, Tables I.B1.5.4, I.B1.5.5 and I.B1.5.6.
Snapshot of mathematics, reading and science results for Hong Kong (China)
Note: * indicates statistically significant trends and changes or mean-performance estimates that are significantly above or below PISA 2022 estimates.
Source: PISA 2022 Database, Tables I.B1.5.1-12, I.B1.5.19, I.B1.5.20 and I.B1.5.21.
Note: In 2022, student response rates decreased with respect to PISA 2018. School response rates also fell short of the target (as they did in 2018). At the school level, the risk of bias due to non-response is limited due to the sampling design. A non-response bias analysis was submitted; however, the strength of the evidence was limited by the fact that no external student-level achievement variables could be used in the analysis (only student grade information, already used in non-response adjustments, was available). Reassuringly, the proxies for school and student achievement (school size and student grade) that were used in the analyses showed no or very limited relationship with participation rates. Nevertheless, based on the available evidence, and on the experience of other countries participating in PISA, a small residual upward bias could not be excluded, even though non-response adjustments likely limited its severity.
Overview of performance trends in Hungary
Trends in mathematics, reading and science performance in Hungary
Note: White dots indicate mean-performance estimates that are not statistically significantly above/below PISA 2022 estimates. Black lines indicate the best-fitting trend.
Source: OECD, PISA 2022 Database, Tables I.B1.5.4, I.B1.5.5 and I.B1.5.6.
Snapshot of mathematics, reading and science results for Hungary
Note: * indicates statistically significant trends and changes or mean-performance estimates that are significantly above or below PISA 2022 estimates.
Source: PISA 2022 Database, Tables I.B1.5.1-12, I.B1.5.19, I.B1.5.20 and I.B1.5.21.
Overview of performance trends in Iceland
Trends in mathematics, reading and science performance in Iceland
Note: White dots indicate mean-performance estimates that are not statistically significantly above/below PISA 2022 estimates. Black lines indicate the best-fitting trend.
Source: OECD, PISA 2022 Database, Tables I.B1.5.4, I.B1.5.5 and I.B1.5.6.
Snapshot of mathematics, reading and science results for Iceland
Note: * indicates statistically significant trends and changes or mean-performance estimates that are significantly above or below PISA 2022 estimates.
Source: PISA 2022 Database, Tables I.B1.5.1-12, I.B1.5.19, I.B1.5.20 and I.B1.5.21.
Note: In 2022, Iceland relied on a server-based administration (using Chromebooks) in some schools. Students in these schools experienced difficulties moving through the cognitive assessment early in the testing period. Further investigation traced the problem back to overload on the PISA contractor’s server. The problem was rapidly solved for students who were tested later and did not affect other countries that used a server-based administration. In Iceland, it affected at most 13% of the final sample (438 students). During data adjudication, these data were thoroughly reviewed, and considered to be fit for reporting: the responses of students who were potentially affected did show good fit with the model, and were not remarkably different from the performance of students in other schools (see Annex A4). Furthermore, analyses conducted by the PISA National Centre for Iceland (where, due to the census nature of the survey, schools’ results in PISA could be tracked over time) confirmed that the issue affected only students’ ability to complete the test but not the way in which these students responded to the parts that they completed: performance changes were very similar in affected and non-affected schools.
Overview of performance trends in Indonesia
Trends in mathematics, reading and science performance in Indonesia
Note: White dots indicate mean-performance estimates that are not statistically significantly above/below PISA 2022 estimates. Black lines indicate the best-fitting trend.
Source: OECD, PISA 2022 Database, Tables I.B1.5.4, I.B1.5.5 and I.B1.5.6.
Snapshot of mathematics, reading and science results for Indonesia
Note: * indicates statistically significant trends and changes or mean-performance estimates that are significantly above or below PISA 2022 estimates.
Source: PISA 2022 Database, Tables I.B1.5.1-12, I.B1.5.19, I.B1.5.20 and I.B1.5.21.
Overview of performance trends in Ireland
Trends in mathematics, reading and science performance in Ireland
Note: White dots indicate mean-performance estimates that are not statistically significantly above/below PISA 2022 estimates. Black lines indicate the best-fitting trend.
Source: OECD, PISA 2022 Database, Tables I.B1.5.4, I.B1.5.5 and I.B1.5.6.
Snapshot of mathematics, reading and science results for Ireland
Note: * indicates statistically significant trends and changes or mean-performance estimates that are significantly above or below PISA 2022 estimates.
Source: PISA 2022 Database, Tables I.B1.5.1-12, I.B1.5.19, I.B1.5.20 and I.B1.5.21.
Notes: In 2022, student response rates decreased with respect to PISA 2018 and fell short of the target. A thorough non-response bias analysis was submitted using external achievement data at student level as auxiliary information. The analysis provided evidence to suggest a residual upwards bias of about 0.1 standard deviations, after non-response adjustments are taken into account. On the PISA scale, considering that the standard deviation in Ireland ranged (in 2018) from 78 score points in mathematics to 91 score points in reading, this could translate into an estimated bias of approximately eight or nine points. The bias associated with trend and cross-country comparisons, however, might be smaller if past data or data for other countries are biased in the same direction.
The testing period changed from March-April (in earlier PISA assessments) to October-December (in PISA 2022).
Overview of performance trends in Israel
Trends in mathematics, reading and science performance in Israel
Note: White dots indicate mean-performance estimates that are not statistically significantly above/below PISA 2022 estimates. Black lines indicate the best-fitting trend.
Source: OECD, PISA 2022 Database, Tables I.B1.5.4, I.B1.5.5 and I.B1.5.6.
Snapshot of mathematics, reading and science results for Israel
Note: * indicates statistically significant trends and changes or mean-performance estimates that are significantly above or below PISA 2022 estimates.
Source: PISA 2022 Database, Tables I.B1.5.1-12, I.B1.5.19, I.B1.5.20 and I.B1.5.21.
Overview of performance trends in Italy
Trends in mathematics, reading and science performance in Italy
Note: White dots indicate mean-performance estimates that are not statistically significantly above/below PISA 2022 estimates. Black lines indicate the best-fitting trend.
Source: OECD, PISA 2022 Database, Tables I.B1.5.4, I.B1.5.5 and I.B1.5.6.
Snapshot of mathematics, reading and science results for Italy
Note: * indicates statistically significant trends and changes or mean-performance estimates that are significantly above or below PISA 2022 estimates.
Source: PISA 2022 Database, Tables I.B1.5.1-12, I.B1.5.19, I.B1.5.20 and I.B1.5.21.
Overview of performance trends in Japan
Trends in mathematics, reading and science performance in Japan
Note: White dots indicate mean-performance estimates that are not statistically significantly above/below PISA 2022 estimates. Black lines indicate the best-fitting trend.
Source: OECD, PISA 2022 Database, Tables I.B1.5.4, I.B1.5.5 and I.B1.5.6.
Snapshot of mathematics, reading and science results for Japan
Note: * indicates statistically significant trends and changes or mean-performance estimates that are significantly above or below PISA 2022 estimates.
Source: PISA 2022 Database, Tables I.B1.5.1-12, I.B1.5.19, I.B1.5.20 and I.B1.5.21.
Overview of performance trends in Jordan
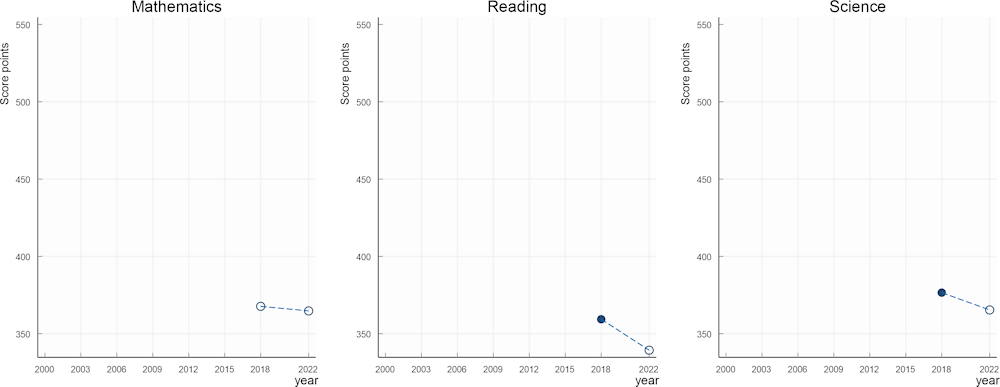
Trends in mathematics, reading and science performance in Jordan
Note: White dots indicate mean-performance estimates that are not statistically significantly above/below PISA 2022 estimates. Black lines indicate the best-fitting trend.
Source: OECD, PISA 2022 Database, Tables I.B1.5.4, I.B1.5.5 and I.B1.5.6.
Snapshot of mathematics, reading and science results for Jordan
Note: * indicates statistically significant trends and changes or mean-performance estimates that are significantly above or below PISA 2022 estimates.
Source: PISA 2022 Database, Tables I.B1.5.1-12, I.B1.5.19, I.B1.5.20 and I.B1.5.21.
Note: Jordan switched from paper to computer assessment in 2022. Past reading and science scores were computed on a scale that was only weakly linked to the international scale; for this reason, this volume does not report trends in reading and science for Jordan and limits trend reporting to mathematics.
Overview of performance trends in Kazakhstan
Trends in mathematics, reading and science performance in Kazakhstan
Note: White dots indicate mean-performance estimates that are not statistically significantly above/below PISA 2022 estimates. Black lines indicate the best-fitting trend.
Source: OECD, PISA 2022 Database, Tables I.B1.5.4, I.B1.5.5 and I.B1.5.6.
Snapshot of mathematics, reading and science results for Kazakhstan
Note: * indicates statistically significant trends and changes or mean-performance estimates that are significantly above or below PISA 2022 estimates.
Source: PISA 2022 Database, Tables I.B1.5.1-12, I.B1.5.19, I.B1.5.20 and I.B1.5.21.
Overview of performance trends in Korea
Trends in mathematics, reading and science performance in Korea
Note: White dots indicate mean-performance estimates that are not statistically significantly above/below PISA 2022 estimates. Black lines indicate the best-fitting trend.
Source: OECD, PISA 2022 Database, Tables I.B1.5.4, I.B1.5.5 and I.B1.5.6.
Snapshot of mathematics, reading and science results for Korea
Note: * indicates statistically significant trends and changes or mean-performance estimates that are significantly above or below PISA 2022 estimates.
Source: PISA 2022 Database, Tables I.B1.5.1-12, I.B1.5.19, I.B1.5.20 and I.B1.5.21.
Overview of performance trends in Kosovo1
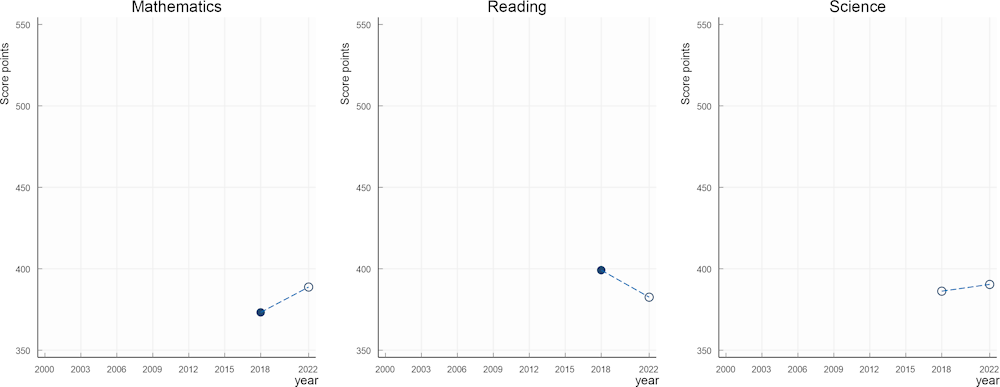
Trends in mathematics, reading and science performance in Kosovo
Note: White dots indicate mean-performance estimates that are not statistically significantly above/below PISA 2022 estimates. Black lines indicate the best-fitting trend.
Source: OECD, PISA 2022 Database, Tables I.B1.5.4, I.B1.5.5 and I.B1.5.6.
Snapshot of mathematics, reading and science results for Kosovo
Note: * indicates statistically significant trends and changes or mean-performance estimates that are significantly above or below PISA 2022 estimates.
Source: PISA 2022 Database, Tables I.B1.5.1-12, I.B1.5.19, I.B1.5.20 and I.B1.5.21.
Overview of performance trends in Latvia
Trends in mathematics, reading and science performance in Latvia
Note: White dots indicate mean-performance estimates that are not statistically significantly above/below PISA 2022 estimates. Black lines indicate the best-fitting trend.
Source: OECD, PISA 2022 Database, Tables I.B1.5.4, I.B1.5.5 and I.B1.5.6.
Snapshot of mathematics, reading and science results for Latvia
Note: * indicates statistically significant trends and changes or mean-performance estimates that are significantly above or below PISA 2022 estimates.
Source: PISA 2022 Database, Tables I.B1.5.1-12, I.B1.5.19, I.B1.5.20 and I.B1.5.21.
Note: In 2022, exclusions from the sample exceeded the acceptable rate by a large margin and showed a marked increase, with respect to 2018. High levels of student exclusions may bias performance results upwards.
Overview of performance trends in Lithuania
Trends in mathematics, reading and science performance in Lithuania
Note: White dots indicate mean-performance estimates that are not statistically significantly above/below PISA 2022 estimates. Black lines indicate the best-fitting trend.
Source: OECD, PISA 2022 Database, Tables I.B1.5.4, I.B1.5.5 and I.B1.5.6.
Snapshot of mathematics, reading and science results for Lithuania
Note: * indicates statistically significant trends and changes or mean-performance estimates that are significantly above or below PISA 2022 estimates.
Source: PISA 2022 Database, Tables I.B1.5.1-12, I.B1.5.19, I.B1.5.20 and I.B1.5.21.
Overview of performance trends in Macao (China)
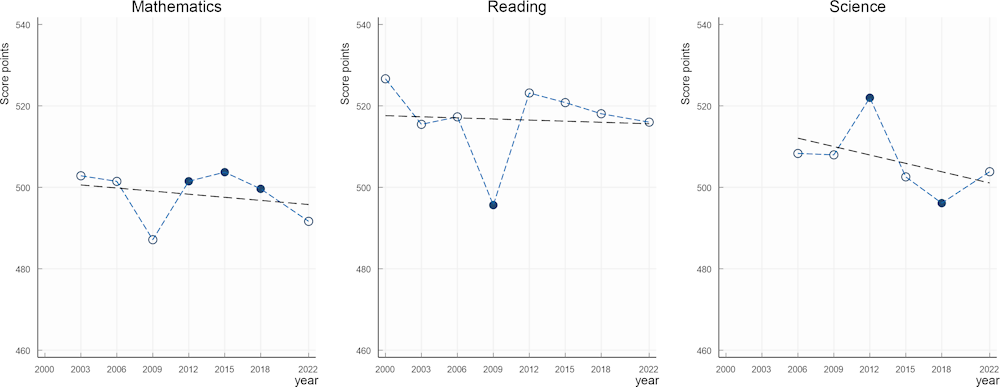
Trends in mathematics, reading and science performance in Macao (China)
Note: White dots indicate mean-performance estimates that are not statistically significantly above/below PISA 2022 estimates. Black lines indicate the best-fitting trend.
Source: OECD, PISA 2022 Database, Tables I.B1.5.4, I.B1.5.5 and I.B1.5.6.
Snapshot of mathematics, reading and science results for Macao (China)
Note: * indicates statistically significant trends and changes or mean-performance estimates that are significantly above or below PISA 2022 estimates.
Source: PISA 2022 Database, Tables I.B1.5.1-12, I.B1.5.19, I.B1.5.20 and I.B1.5.21.
Overview of performance trends in Malaysia
Trends in mathematics, reading and science performance in Malaysia
Note: White dots indicate mean-performance estimates that are not statistically significantly above/below PISA 2022 estimates. Black lines indicate the best-fitting trend.
Source: OECD, PISA 2022 Database, Tables I.B1.5.4, I.B1.5.5 and I.B1.5.6.
Snapshot of mathematics, reading and science results for Malaysia
Note: * indicates statistically significant trends and changes or mean-performance estimates that are significantly above or below PISA 2022 estimates.
Source: PISA 2022 Database, Tables I.B1.5.1-12, I.B1.5.19, I.B1.5.20 and I.B1.5.21.
Overview of performance trends in Malta
Trends in mathematics, reading and science performance in Malta
Note: White dots indicate mean-performance estimates that are not statistically significantly above/below PISA 2022 estimates. Black lines indicate the best-fitting trend.
Source: OECD, PISA 2022 Database, Tables I.B1.5.4, I.B1.5.5 and I.B1.5.6.
Snapshot of mathematics, reading and science results for Malta
Note: * indicates statistically significant trends and changes or mean-performance estimates that are significantly above or below PISA 2022 estimates.
Source: PISA 2022 Database, Tables I.B1.5.1-12, I.B1.5.19, I.B1.5.20 and I.B1.5.21.
Overview of performance trends in Mexico
Trends in mathematics, reading and science performance in Mexico
Note: White dots indicate mean-performance estimates that are not statistically significantly above/below PISA 2022 estimates. Black lines indicate the best-fitting trend.
Source: OECD, PISA 2022 Database, Tables I.B1.5.4, I.B1.5.5 and I.B1.5.6.
Snapshot of mathematics, reading and science results for Mexico
Note: * indicates statistically significant trends and changes or mean-performance estimates that are significantly above or below PISA 2022 estimates.
Source: PISA 2022 Database, Tables I.B1.5.1-12, I.B1.5.19, I.B1.5.20 and I.B1.5.21.
Overview of performance trends in Moldova
Trends in mathematics, reading and science performance in Moldova
Note: White dots indicate mean-performance estimates that are not statistically significantly above/below PISA 2022 estimates. Black lines indicate the best-fitting trend.
Source: OECD, PISA 2022 Database, Tables I.B1.5.4, I.B1.5.5 and I.B1.5.6.
Snapshot of mathematics, reading and science results for Moldova
Note: * indicates statistically significant trends and changes or mean-performance estimates that are significantly above or below PISA 2022 estimates.
Source: PISA 2022 Database, Tables I.B1.5.1-12, I.B1.5.19, I.B1.5.20 and I.B1.5.21.
Overview of performance trends in Montenegro
Trends in mathematics, reading and science performance in Montenegro
Note: White dots indicate mean-performance estimates that are not statistically significantly above/below PISA 2022 estimates. Black lines indicate the best-fitting trend.
Source: OECD, PISA 2022 Database, Tables I.B1.5.4, I.B1.5.5 and I.B1.5.6.
Snapshot of mathematics, reading and science results for Montenegro
Note: * indicates statistically significant trends and changes or mean-performance estimates that are significantly above or below PISA 2022 estimates.
Source: PISA 2022 Database, Tables I.B1.5.1-12, I.B1.5.19, I.B1.5.20 and I.B1.5.21.
Overview of performance trends in Morocco
Trends in mathematics, reading and science performance in Morocco
Note: White dots indicate mean-performance estimates that are not statistically significantly above/below PISA 2022 estimates.
Source: OECD, PISA 2022 Database, Tables I.B1.5.4, I.B1.5.5 and I.B1.5.6.
Snapshot of mathematics, reading and science results for Morocco
Note: * indicates statistically significant trends and changes or mean-performance estimates that are significantly above or below PISA 2022 estimates.
Source: PISA 2022 Database, Tables I.B1.5.1-12, I.B1.5.19, I.B1.5.20 and I.B1.5.21.
Overview of performance trends in Netherlands
Trends in mathematics, reading and science performance in Netherlands
Note: White dots indicate mean-performance estimates that are not statistically significantly above/below PISA 2022 estimates. Black lines indicate the best-fitting trend.
Source: OECD, PISA 2022 Database, Tables I.B1.5.4, I.B1.5.5 and I.B1.5.6.
Snapshot of mathematics, reading and science results for Netherlands
Note: * indicates statistically significant trends and changes or mean-performance estimates that are significantly above or below PISA 2022 estimates.
Source: PISA 2022 Database, Tables I.B1.5.1-12, I.B1.5.19, I.B1.5.20 and I.B1.5.21.
Notes: In 2022, overall exclusions from the sample (at the student or school level) exceeded the acceptable rate by a large margin and showed a marked increase with respect to 2018. High levels of student exclusions may bias performance results upwards.
In the Netherlands, the testing period changed from March-April (in earlier PISA assessments) to October-December (in PISA 2022).
Overview of performance trends in New Zealand
Trends in mathematics, reading and science performance in New Zealand
Note: White dots indicate mean-performance estimates that are not statistically significantly above/below PISA 2022 estimates. Black lines indicate the best-fitting trend.
Source: OECD, PISA 2022 Database, Tables I.B1.5.4, I.B1.5.5 and I.B1.5.6.
Snapshot of mathematics, reading and science results for New Zealand
Note: * indicates statistically significant trends and changes or mean-performance estimates that are significantly above or below PISA 2022 estimates.
Source: PISA 2022 Database, Tables I.B1.5.1-12, I.B1.5.19, I.B1.5.20 and I.B1.5.21.
Note: In 2022, student response rates decreased with respect to PISA 2018 and fell short of the target. School response rates also fell short of the target. A thorough and detailed non-response bias analysis was submitted using external achievement data at student level but also information on chronic absenteeism as auxiliary information along with demographic characteristics. The analysis provided evidence to suggest a residual upwards bias of about 0.1 standard deviations, after non-response adjustments are taken into account, driven entirely by student non-response (school non-participation did not result in significant bias, in contrast). The analysis also suggests that chronically absent students are over-represented among non-respondents in PISA. On the PISA scale, considering that the standard deviation in New Zealand ranged (in 2018) from 93 score points in mathematics to 106 score points in reading, this could translate into an estimated bias of approximately 10 points. The bias associated with trend and cross-country comparisons, however, might be smaller if past data or data for other countries are biased in the same direction.
Overview of performance trends in North Macedonia
Trends in mathematics, reading and science performance in North Macedonia
Note: White dots indicate mean-performance estimates that are not statistically significantly above/below PISA 2022 estimates. Black lines indicate the best-fitting trend.
Source: OECD, PISA 2022 Database, Tables I.B1.5.4, I.B1.5.5 and I.B1.5.6.
Snapshot of mathematics, reading and science results for North Macedonia
Note: * indicates statistically significant trends and changes or mean-performance estimates that are significantly above or below PISA 2022 estimates.
Source: PISA 2022 Database, Tables I.B1.5.1-12, I.B1.5.19, I.B1.5.20 and I.B1.5.21.
Overview of performance trends in Norway
Trends in mathematics, reading and science performance in Norway
Note: White dots indicate mean-performance estimates that are not statistically significantly above/below PISA 2022 estimates. Black lines indicate the best-fitting trend.
Source: OECD, PISA 2022 Database, Tables I.B1.5.4, I.B1.5.5 and I.B1.5.6.
Snapshot of mathematics, reading and science results for Norway
Note: * indicates statistically significant trends and changes or mean-performance estimates that are significantly above or below PISA 2022 estimates.
Source: PISA 2022 Database, Tables I.B1.5.1-12, I.B1.5.19, I.B1.5.20 and I.B1.5.21.
Note: In 2022, Norway relied on a server-based administration (using Chromebooks) in some schools. Students in these schools experienced difficulties moving through the cognitive assessment early in the testing period. Further investigation traced the problem back to overload on the PISA contractor’s server. The problem was rapidly solved for students who were tested later and did not affect other countries that used a server-based administration. In Norway, it affected at most 9% of the final sample (584 students). During data adjudication, these data were thoroughly reviewed, and considered to be fit for reporting: the responses of students who were potentially affected did show good fit with the model, and were not remarkably different from the performance of students in other schools (see Annex A4).
Overview of performance trends in Panama
Trends in mathematics, reading and science performance in Panama
Note: White dots indicate mean-performance estimates that are not statistically significantly above/below PISA 2022 estimates.
Source: OECD, PISA 2022 Database, Tables I.B1.5.4, I.B1.5.5 and I.B1.5.6.
Snapshot of mathematics, reading and science results for Panama
Note: * indicates statistically significant trends and changes or mean-performance estimates that are significantly above or below PISA 2022 estimates.
Source: PISA 2022 Database, Tables I.B1.5.1-12, I.B1.5.19, I.B1.5.20 and I.B1.5.21.
Note: In the challenging circumstances surrounding schooling in Panama in 2022 (teacher strikes, road blockades, and student absenteeism), student response rates decreased markedly from 90% with respect to PISA 2018 and fell short of the standard. No non-response bias analysis was submitted; the PISA national centre explained that non-response was potentially related to the agitated school climate students found themselves in when returning to their schools after the strikes. A comparison of respondent characteristics (both before and after non-response adjustment) to characteristics of the full eligible sample of students suggests that (before non-response adjustments were taken into account), non-response was related to students’ grade level and special-needs status. Based on the available information, it is not possible to exclude the possibility of bias; considering the analyses on student non-response conducted in other countries, the residual bias after non-response adjustments are taken into account is likely to correspond to an upward bias.
Overview of performance trends in Paraguay
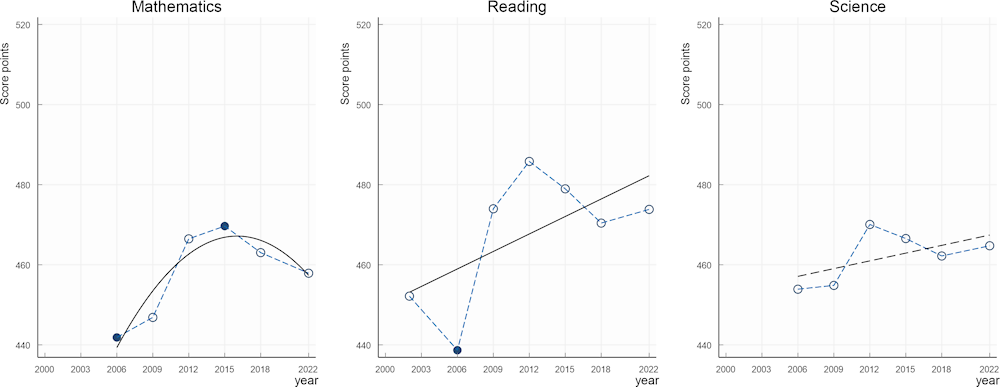
Trends in mathematics, reading and science performance in Paraguay
Note: White dots indicate mean-performance estimates that are not statistically significantly above/below PISA 2022 estimates.
Source: OECD, PISA 2022 Database, Tables I.B1.5.4, I.B1.5.5 and I.B1.5.6.
Snapshot of mathematics, reading and science results for Paraguay
Note: * indicates statistically significant trends and changes or mean-performance estimates that are significantly above or below PISA 2022 estimates.
Source: PISA 2022 Database, Tables I.B1.5.1-12, I.B1.5.19, I.B1.5.20 and I.B1.5.21.
Note: Results for 2018 refer to the results of the PISA for Development assessment, in 2017.
Overview of performance trends in Peru
Trends in mathematics, reading and science performance in Peru
Note: White dots indicate mean-performance estimates that are not statistically significantly above/below PISA 2022 estimates. Black lines indicate the best-fitting trend.
Source: OECD, PISA 2022 Database, Tables I.B1.5.4, I.B1.5.5 and I.B1.5.6.
Snapshot of mathematics, reading and science results for Peru
Note: * indicates statistically significant trends and changes or mean-performance estimates that are significantly above or below PISA 2022 estimates.
Source: PISA 2022 Database, Tables I.B1.5.1-12, I.B1.5.19, I.B1.5.20 and I.B1.5.21.
Overview of performance trends in Philippines
Trends in mathematics, reading and science performance in Philippines
Note: White dots indicate mean-performance estimates that are not statistically significantly above/below PISA 2022 estimates.
Source: OECD, PISA 2022 Database, Tables I.B1.5.4, I.B1.5.5 and I.B1.5.6.
Snapshot of mathematics, reading and science results for Philippines
Note: * indicates statistically significant trends and changes or mean-performance estimates that are significantly above or below PISA 2022 estimates.
Source: PISA 2022 Database, Tables I.B1.5.1-12, I.B1.5.19, I.B1.5.20 and I.B1.5.21.
Overview of performance trends in Poland
Trends in mathematics, reading and science performance in Poland
Note: White dots indicate mean-performance estimates that are not statistically significantly above/below PISA 2022 estimates. Black lines indicate the best-fitting trend.
Source: OECD, PISA 2022 Database, Tables I.B1.5.4, I.B1.5.5 and I.B1.5.6.
Snapshot of mathematics, reading and science results for Poland
Note: * indicates statistically significant trends and changes or mean-performance estimates that are significantly above or below PISA 2022 estimates.
Source: PISA 2022 Database, Tables I.B1.5.1-12, I.B1.5.19, I.B1.5.20 and I.B1.5.21.
Overview of performance trends in Portugal
Trends in mathematics, reading and science performance in Portugal
Note: White dots indicate mean-performance estimates that are not statistically significantly above/below PISA 2022 estimates. Black lines indicate the best-fitting trend.
Source: OECD, PISA 2022 Database, Tables I.B1.5.4, I.B1.5.5 and I.B1.5.6.
Snapshot of mathematics, reading and science results for Portugal
Note: * indicates statistically significant trends and changes or mean-performance estimates that are significantly above or below PISA 2022 estimates.
Source: PISA 2022 Database, Tables I.B1.5.1-12, I.B1.5.19, I.B1.5.20 and I.B1.5.21.
Note: In 2018, Portugal did not meet the student-response rate standard: response rates dropped between 2015 and 2018 but then returned to higher levels in 2022. The non-response-bias analysis submitted for 2018 implies a small upward bias for PISA 2018 performance results in Portugal.
Overview of performance trends in Qatar
Trends in mathematics, reading and science performance in Qatar
Note: White dots indicate mean-performance estimates that are not statistically significantly above/below PISA 2022 estimates. Black lines indicate the best-fitting trend.
Source: OECD, PISA 2022 Database, Tables I.B1.5.4, I.B1.5.5 and I.B1.5.6.
Snapshot of mathematics, reading and science results for Qatar
Note: * indicates statistically significant trends and changes or mean-performance estimates that are significantly above or below PISA 2022 estimates.
Source: PISA 2022 Database, Tables I.B1.5.1-12, I.B1.5.19, I.B1.5.20 and I.B1.5.21.
Overview of performance trends in Romania
Trends in mathematics, reading and science performance in Romania
Note: White dots indicate mean-performance estimates that are not statistically significantly above/below PISA 2022 estimates. Black lines indicate the best-fitting trend.
Source: OECD, PISA 2022 Database, Tables I.B1.5.4, I.B1.5.5 and I.B1.5.6.
Snapshot of mathematics, reading and science results for Romania
Note: * indicates statistically significant trends and changes or mean-performance estimates that are significantly above or below PISA 2022 estimates.
Source: PISA 2022 Database, Tables I.B1.5.1-12, I.B1.5.19, I.B1.5.20 and I.B1.5.21.
Overview of performance trends in Saudi Arabia
Trends in mathematics, reading and science performance in Saudi Arabia
Note: White dots indicate mean-performance estimates that are not statistically significantly above/below PISA 2022 estimates.
Source: OECD, PISA 2022 Database, Tables I.B1.5.4, I.B1.5.5 and I.B1.5.6.
Snapshot of mathematics, reading and science results for Saudi Arabia
Note: * indicates statistically significant trends and changes or mean-performance estimates that are significantly above or below PISA 2022 estimates.
Source: PISA 2022 Database, Tables I.B1.5.1-12, I.B1.5.19, I.B1.5.20 and I.B1.5.21.
Overview of performance trends in Serbia
Trends in mathematics, reading and science performance in Serbia
Note: White dots indicate mean-performance estimates that are not statistically significantly above/below PISA 2022 estimates. Black lines indicate the best-fitting trend.
Source: OECD, PISA 2022 Database, Tables I.B1.5.4, I.B1.5.5 and I.B1.5.6.
Snapshot of mathematics, reading and science results for Serbia
Note: * indicates statistically significant trends and changes or mean-performance estimates that are significantly above or below PISA 2022 estimates.
Source: PISA 2022 Database, Tables I.B1.5.1-12, I.B1.5.19, I.B1.5.20 and I.B1.5.21.
Overview of performance trends in Singapore
Trends in mathematics, reading and science performance in Singapore
Note: White dots indicate mean-performance estimates that are not statistically significantly above/below PISA 2022 estimates. Black lines indicate the best-fitting trend.
Source: OECD, PISA 2022 Database, Tables I.B1.5.4, I.B1.5.5 and I.B1.5.6.
Snapshot of mathematics, reading and science results for Singapore
Note: * indicates statistically significant trends and changes or mean-performance estimates that are significantly above or below PISA 2022 estimates.
Source: PISA 2022 Database, Tables I.B1.5.1-12, I.B1.5.19, I.B1.5.20 and I.B1.5.21.
Overview of performance trends in Slovak Republic
Trends in mathematics, reading and science performance in Slovak Republic
Note: White dots indicate mean-performance estimates that are not statistically significantly above/below PISA 2022 estimates. Black lines indicate the best-fitting trend.
Source: OECD, PISA 2022 Database, Tables I.B1.5.4, I.B1.5.5 and I.B1.5.6.
Snapshot of mathematics, reading and science results for Slovak Republic
Note: * indicates statistically significant trends and changes or mean-performance estimates that are significantly above or below PISA 2022 estimates.
Source: PISA 2022 Database, Tables I.B1.5.1-12, I.B1.5.19, I.B1.5.20 and I.B1.5.21.
Overview of performance trends in Slovenia
Trends in mathematics, reading and science performance in Slovenia
Note: White dots indicate mean-performance estimates that are not statistically significantly above/below PISA 2022 estimates. Black lines indicate the best-fitting trend.
Source: OECD, PISA 2022 Database, Tables I.B1.5.4, I.B1.5.5 and I.B1.5.6.
Snapshot of mathematics, reading and science results for Slovenia
Note: * indicates statistically significant trends and changes or mean-performance estimates that are significantly above or below PISA 2022 estimates.
Source: PISA 2022 Database, Tables I.B1.5.1-12, I.B1.5.19, I.B1.5.20 and I.B1.5.21.
Overview of performance trends in Spain
Trends in mathematics, reading and science performance in Spain
Note: White dots indicate mean-performance estimates that are not statistically significantly above/below PISA 2022 estimates. Black lines indicate the best-fitting trend.
Source: OECD, PISA 2022 Database, Tables I.B1.5.4, I.B1.5.5 and I.B1.5.6.
Snapshot of mathematics, reading and science results for Spain
Note: * indicates statistically significant trends and changes or mean-performance estimates that are significantly above or below PISA 2022 estimates.
Source: PISA 2022 Database, Tables I.B1.5.1-12, I.B1.5.19, I.B1.5.20 and I.B1.5.21.
Overview of performance trends in Sweden
Trends in mathematics, reading and science performance in Sweden
Note: White dots indicate mean-performance estimates that are not statistically significantly above/below PISA 2022 estimates. Black lines indicate the best-fitting trend.
Source: OECD, PISA 2022 Database, Tables I.B1.5.4, I.B1.5.5 and I.B1.5.6.
Snapshot of mathematics, reading and science results for Sweden
Note: * indicates statistically significant trends and changes or mean-performance estimates that are significantly above or below PISA 2022 estimates.
Source: PISA 2022 Database, Tables I.B1.5.1-12, I.B1.5.19, I.B1.5.20 and I.B1.5.21.
Overview of performance trends in Switzerland
Trends in mathematics, reading and science performance in Switzerland
Note: White dots indicate mean-performance estimates that are not statistically significantly above/below PISA 2022 estimates. Black lines indicate the best-fitting trend.
Source: OECD, PISA 2022 Database, Tables I.B1.5.4, I.B1.5.5 and I.B1.5.6.
Snapshot of mathematics, reading and science results for Switzerland
Note: * indicates statistically significant trends and changes or mean-performance estimates that are significantly above or below PISA 2022 estimates.
Source: PISA 2022 Database, Tables I.B1.5.1-12, I.B1.5.19, I.B1.5.20 and I.B1.5.21.
Overview of performance trends in Chinese Taipei
Trends in mathematics, reading and science performance in Chinese Taipei
Note: White dots indicate mean-performance estimates that are not statistically significantly above/below PISA 2022 estimates. Black lines indicate the best-fitting trend.
Source: OECD, PISA 2022 Database, Tables I.B1.5.4, I.B1.5.5 and I.B1.5.6.
Snapshot of mathematics, reading and science results for Chinese Taipei
Note: * indicates statistically significant trends and changes or mean-performance estimates that are significantly above or below PISA 2022 estimates.
Source: PISA 2022 Database, Tables I.B1.5.1-12, I.B1.5.19, I.B1.5.20 and I.B1.5.21.
Overview of performance trends in Thailand
Trends in mathematics, reading and science performance in Thailand
Note: White dots indicate mean-performance estimates that are not statistically significantly above/below PISA 2022 estimates. Black lines indicate the best-fitting trend.
Source: OECD, PISA 2022 Database, Tables I.B1.5.4, I.B1.5.5 and I.B1.5.6.
Snapshot of mathematics, reading and science results for Thailand
Note: * indicates statistically significant trends and changes or mean-performance estimates that are significantly above or below PISA 2022 estimates.
Source: PISA 2022 Database, Tables I.B1.5.1-12, I.B1.5.19, I.B1.5.20 and I.B1.5.21.
Overview of performance trends in Türkiye
Trends in mathematics, reading and science performance in Türkiye
Note: White dots indicate mean-performance estimates that are not statistically significantly above/below PISA 2022 estimates. Black lines indicate the best-fitting trend.
Source: OECD, PISA 2022 Database, Tables I.B1.5.4, I.B1.5.5 and I.B1.5.6.
Snapshot of mathematics, reading and science results for Türkiye
Note: * indicates statistically significant trends and changes or mean-performance estimates that are significantly above or below PISA 2022 estimates.
Source: PISA 2022 Database, Tables I.B1.5.1-12, I.B1.5.19, I.B1.5.20 and I.B1.5.21.
Overview of performance trends in United Arab Emirates
Trends in mathematics, reading and science performance in United Arab Emirates
Note: White dots indicate mean-performance estimates that are not statistically significantly above/below PISA 2022 estimates. Black lines indicate the best-fitting trend.
Source: OECD, PISA 2022 Database, Tables I.B1.5.4, I.B1.5.5 and I.B1.5.6.
Snapshot of mathematics, reading and science results for United Arab Emirates
Note: * indicates statistically significant trends and changes or mean-performance estimates that are significantly above or below PISA 2022 estimates.
Source: PISA 2022 Database, Tables I.B1.5.1-12, I.B1.5.19, I.B1.5.20 and I.B1.5.21.
Overview of performance trends in United Kingdom
Trends in mathematics, reading and science performance in United Kingdom
Note: White dots indicate mean-performance estimates that are not statistically significantly above/below PISA 2022 estimates. Black lines indicate the best-fitting trend.
Source: OECD, PISA 2022 Database, Tables I.B1.5.4, I.B1.5.5 and I.B1.5.6.
Snapshot of mathematics, reading and science results for United Kingdom
Note: * indicates statistically significant trends and changes or mean-performance estimates that are significantly above or below PISA 2022 estimates.
Source: PISA 2022 Database, Tables I.B1.5.1-12, I.B1.5.19, I.B1.5.20 and I.B1.5.21.
Note: In 2022, student response rates decreased slightly with respect to PISA 2018 and fell short of the target. School response rates also fell short of the target. An informative non-response bias analysis was submitted using external achievement data at student level as auxiliary information along with demographic characteristics; analyses were limited to England and Scotland as the largest subnational entities within the United Kingdom. The analysis provided evidence to suggest a small residual upwards bias, driven entirely by student non-response (school non-participation did not result in significant bias, in contrast). The bias associated with trend comparisons, however, might be smaller or entirely absent when considering the fact that response rates remained close to those observed in 2018.
Overview of performance trends in United States
Trends in mathematics, reading and science performance in United States
Note: White dots indicate mean-performance estimates that are not statistically significantly above/below PISA 2022 estimates. Black lines indicate the best-fitting trend.
Source: OECD, PISA 2022 Database, Tables I.B1.5.4, I.B1.5.5 and I.B1.5.6.
Snapshot of mathematics, reading and science results for United States
Note: * indicates statistically significant trends and changes or mean-performance estimates that are significantly above or below PISA 2022 estimates.
Source: PISA 2022 Database, Tables I.B1.5.1-12, I.B1.5.19, I.B1.5.20 and I.B1.5.21.
Note: In 2022, school participation rates missed the standard by a substantial margin, and participation rates were particularly low among private schools (representing about 7% of the student population). A non-response bias analysis was submitted, indicating that, after replacement schools and nonresponse adjustments are taken into account, a number of characteristics (not including direct measures of school performance) are balanced across respondents and non-respondents. Exclusions from the sample also showed a marked increase, with respect to 2018, and exceeded the acceptable rate by a small margin; finally, the response rate for students was only slightly above the target (80%). Based on the available information, it is not possible to exclude the possibility of bias, nor to determine its most likely direction.
Overview of performance trends in Uruguay
Trends in mathematics, reading and science performance in Uruguay
Note: White dots indicate mean-performance estimates that are not statistically significantly above/below PISA 2022 estimates. Black lines indicate the best-fitting trend.
Source: OECD, PISA 2022 Database, Tables I.B1.5.4, I.B1.5.5 and I.B1.5.6.
Snapshot of mathematics, reading and science results for Uruguay
Note: * indicates statistically significant trends and changes or mean-performance estimates that are significantly above or below PISA 2022 estimates.
Source: PISA 2022 Database, Tables I.B1.5.1-12, I.B1.5.19, I.B1.5.20 and I.B1.5.21.
Note
← 1. This designation is without prejudice to positions on status, and is in line with United Nations Security Council Resolution 1244/99 and the Advisory Opinion of the International Court of Justice on Kosovo’s declaration of independence.